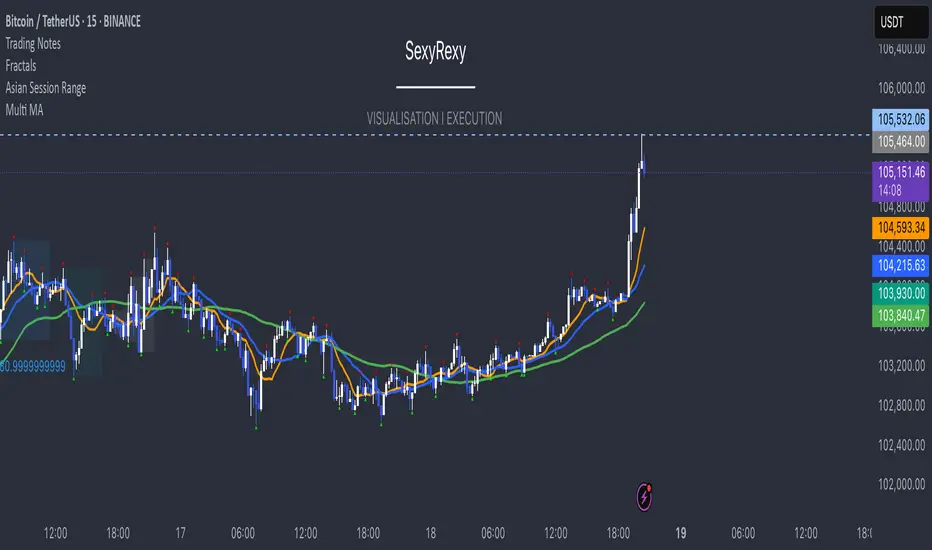
21/55 EMA Cloud w/ Optional RibbonThis indicator behaves like a traditional EMA ribbon by using the 21, 25, 30, 35, 40, 45, 50, and 55 bar exponential moving averages. In this particular indicator, the traditional EMA ribbon lines are turned off by default leaving only a filled in area between the 21 and 55 bar averages. The filled in area is green when the 21 bar average is greater than the 55 and red otherwise. Additionally, the 9, 100, and 200 exponential moving averages are available for reference.
Cari dalam skrip untuk "averages"

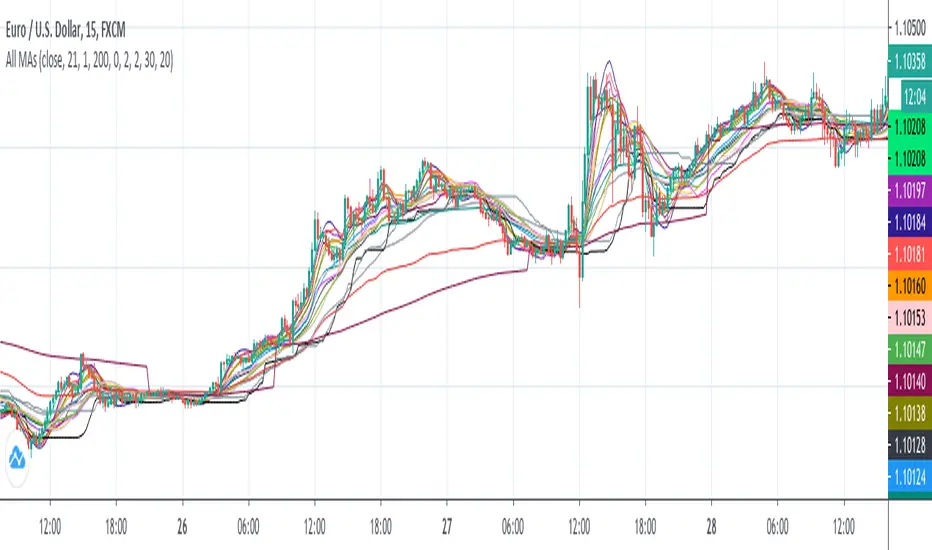
All MAs displayedThis is a collection of moving averages.
Thanks to everget and other pinecoders to pubblish their codes in tradingview.
I just collect a lot of moving averages in one script and transform them in stand alone functions, so you can copy and paste in your script the MA that best fit your needs.
Furthermore, the chart shows which moving average has more smooth and which one has less lag and so on: in this way it is easy to graphically compare moving averages.
Phicube EMASAR ( EMA Support and Resistance )Indicator based on the Concept created by Bo Williams. But unlike the original that uses MIMAs, EMAs are used here.
Exponential moving averages will be shown according to fractal alignment, in order to show the important support and resistance levels ( SAR ).
When the fractals are aligned to become support,
we will have the EMA in the graph with a bright color.
When the fractals are aligned to become resistance, we will have EMA in the graph with a matte color.
Available exponential moving averages: 17,34,72,144,305,610,1292 and 2584
____________________________________________________//_____________________________________________________________________
Indicador baseado no Conceito criado pelo Bo Williams. Mas diferente do original que utiliza MIMAs, aqui é utilizado EMAs.
As médias móveis exponenciais serão mostradas de acordo com o alinhamento dos fractais, com objetivo de mostrar os níveis importantes
de suporte e resistência( SAR ).
Quando estiver com os fractais alinhados virando suporte, teremos no gráfico a EMA com uma cor em tom brilhante.
Quando estiver com os fractais alinhados virando resistência, teremos no gráfico a EMA com uma cor em tom fosco.
Médias móveis exponenciais disponíveis: 17,34,72,144,305,610,1292 e 2584

Bundle of various indicators, All-in-oneThis scripts compiles many indicators into one. It comes from many sources and i added all sources i used. If i forgot one, don't hesitate to message me.
This is useful if you need to setup your chart layout fast. The menu makes it easy to configure it.
You can configure and display:
- Various types of moving averages: RMA, SMA , EMA , WMA , VWMA , SMMA , HullMA, LSMA , DEMA , TEMA
- Stochastic RSI crosses from multi-timeframes directly on candle's close (1h, 4h, D, W)
- Bollinger bands with primary and secondary deviation
- SAR
- Color background using difference between Stochastic RSI K and D
- Support and resistance
- Open high low close from higher timeframes (D, W, M)
- Auto fibonacci levels (still a work in progress, i will add logarithmic fibonacci levels too later)
- "Alt season" for crypto users: if BTC dominance cross his SMA , display a pictogram on every chart
Stil working on:
- Auto fibonacci levels: i will add logarithmic fibonacci levels
- Stochastic crosses
- Alt season: use others types of moving averages
If you have any suggestions / improvements, feel free to message me or write it in the comments below.

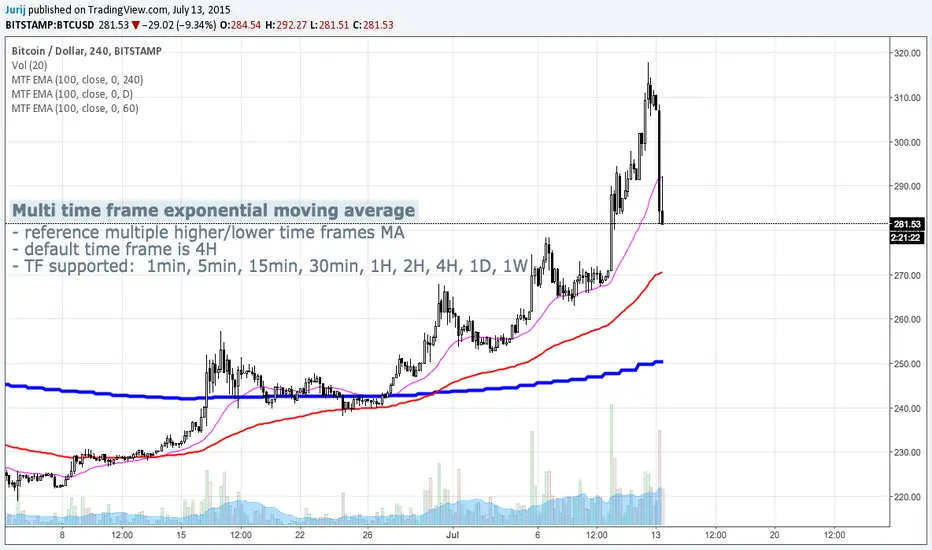
Multi Time Frame Exponential Moving AverageThis indicator allows you to reference exponential moving averages from other time frames
Same indicator for simple moving averages:
Adaptive 2-Pole Trend Bands [supfabio]Adaptive 2-Pole Trend Bands is a volatility-aware trend filtering indicator designed to identify the dominant market direction while providing dynamic reference zones around price.
Instead of relying on traditional moving averages, this indicator uses a two-pole digital filter to smooth price action while maintaining responsiveness. Around this central trend line, a multi-band structure based on ATR is applied to help traders evaluate pullbacks, extensions, and potential exhaustion areas within a trend.
Core Concept
The indicator is built around three key ideas:
Digital Trend Filtering
Volatility-Adjusted Bands
Trend Persistence Measurement
These components work together to separate meaningful price movement from noise and to provide context for how far price has moved relative to recent volatility.
Two-Pole Trend Filter
At its core, the indicator uses a two-pole smoothing filter, which produces a cleaner trend curve than common moving averages.
Compared to standard averages, this approach:
Reduces market noise
Produces smoother transitions
Responds faster to genuine trend changes
Avoids excessive lag in trending markets
The result is a trend line that represents the structural direction of price, rather than short-term fluctuations.
Adaptive Multi-Band System
Around the central trend filter, the indicator plots four independent volatility-based bands, each derived from the Average True Range (ATR).
Each band represents a different degree of price extension:
Band 1: Shallow pullbacks and minor reactions
Band 2: Moderate extensions within a trend
Band 3: Strong directional moves
Band 4: Extreme extensions relative to recent volatility
Because the bands are ATR-based, they automatically adapt to changing market conditions, expanding during high volatility and contracting during calmer periods.
This makes the indicator suitable for both slow and fast markets without manual recalibration.
Trend State Detection
The color of the central filter dynamically reflects trend persistence, not just direction:
Sustained upward movement highlights bullish conditions
Sustained downward movement highlights bearish conditions
Transitional phases are visually distinct, helping identify regime changes
This logic is based on how long price has maintained directional behavior, reducing sensitivity to isolated candles or short-lived spikes.
Practical Applications
This indicator can be used as:
A trend filter for discretionary or systematic strategies
A context tool to evaluate pullbacks versus overextension
A risk reference to avoid entries in extreme price zones
A confirmation layer when combined with price action or momentum tools
It performs consistently across different asset classes, including futures, cryptocurrencies, forex, indices, and equities.
Configuration
Key parameters such as filter length, damping factor, and band multipliers are fully configurable, allowing traders to adapt the indicator to different timeframes and trading styles.
Important Notes
This indicator does not predict future price movement
It does not generate guaranteed buy or sell signals
Best results are achieved when used in combination with sound risk management and additional confirmation tools
Past behavior does not imply future performance
Disclaimer
This indicator is provided for educational and analytical purposes only and should not be considered financial advice.
Se quiser, posso:
Criar uma versão resumida para a primeira linha da publicação
Ajustar o texto para um tom mais técnico ou mais comercial
Traduzir para português mantendo o inglês como idioma principal
Revisar o título para SEO dentro da Biblioteca Pública

Trend detection zero lag Trend Detection Zero-Lag (v6)
Trend Detection Zero-Lag is a high-performance trend identification indicator designed for intraday traders, scalpers, and swing traders who require fast trend recognition with minimal lag. It combines a zero-lag Hull Moving Average, slope analysis, swing structure logic, and adaptive volatility sensitivity to deliver early yet stable trend signals.
This indicator is optimized for real-time decision-making, particularly in fast markets where traditional moving averages react too slowly.
Core Features
🔹 Zero-Lag Trend Engine
Uses a Zero-Lag Hull Moving Average (HMA) to reduce lag by approximately 40–60% versus standard moving averages.
Provides earlier trend shifts while maintaining smoothness.
🔹 Multi-Factor Trend Detection
Trend direction is determined using a hybrid engine:
HMA slope (momentum direction)
Rising / falling confirmation
Swing structure detection (HH/HL vs LH/LL)
ATR-adjusted dynamic sensitivity
This approach allows fast flips when conditions change, without excessive noise.
Adaptive Volatility Sensitivity
Sensitivity dynamically adjusts based on ATR relative to price
In high volatility: faster reaction
In low volatility: smoother, more stable trend state
This ensures the indicator adapts across:
Trend days
Range days
Volatility expansion or contraction
Trend Duration Intelligence
The indicator tracks historical trend durations and maintains a rolling memory of recent bullish and bearish phases.
From this, it calculates:
Current trend duration
Average historical duration for the active trend direction
This helps traders gauge:
Whether a trend is early, mature, or extended
Probability of continuation vs exhaustion
Strength Scoring
A normalized Trend Strength Score (0–100) is calculated using:
Zero-lag slope magnitude
ATR normalization
This provides a quick read on:
Weak / choppy trends
Healthy trend continuation
Overextended momentum
Visual Design
Color-coded Zero-Lag HMA
Bullish trend → user-defined bullish color
Bearish trend → user-defined bearish color
Designed for dark mode / neon-style charts
Clean overlay with no clutter
Trend Detection Zero-Lag is built for traders who need:
Faster trend recognition
Adaptive behavior across market regimes
Structural confirmation beyond simple moving averages
Clear, actionable visual signals

J&C Indicator 20/40 MA4H SMA Signal Map (20/40) Strategy
Timeframe: 4-Hour
Overview:
This is a momentum-based trend confirmation system using dual moving averages. The strategy identifies potential entry points when price action aligns with moving average positioning.
LONG Signal:
Triggers when the market demonstrates bullish momentum with price confirming an upside breakout while both moving averages are in a favorable uptrend alignment.
SHORT Signal:
Triggers when the market demonstrates bearish momentum with price confirming a downside breakdown while both moving averages are in a favorable downtrend alignment.
Key Features:
Uses a 20-period and 40-period simple moving average on the 4-hour timeframe
Filters out false signals by requiring multi-factor confirmation
Generates clear visual alerts with background highlighting
Real-time dashboard showing current MA values and trend direction
Sound/notification alerts for immediate signal awareness
Best Used For:
Swing trading on higher timeframes with proper risk management and support from additional confluence factors on your trading setup.

VWAP D/W/M + MA100 & EMA100 albanThis TradingView indicator displays three independent VWAPs (Volume Weighted Average Prices) along with MA100 (Simple Moving Average) and EMA100 (Exponential Moving Average) on the chart.
Key Features:
VWAP #1, VWAP #2, VWAP #3: Each VWAP can be configured independently with:
Source (hlc3, close, etc.)
Anchor period (Session, Week, Month, Quarter, Year, Decade, Century, Earnings, Dividends, Splits)
Offset
Option to hide on daily or higher timeframes
MA100: 100-period Simple Moving Average
EMA100: 100-period Exponential Moving Average
Purpose:
This script is ideal for traders who want to track multiple VWAP levels simultaneously while also monitoring the 100-period moving averages for trend analysis. It provides a clean setup without bands or fills, focusing solely on price averages.
Use Cases:
Identify intraday or multi-timeframe VWAP levels
Combine VWAP levels with MA100/EMA100 for support/resistance analysis
Analyze trend direction and momentum using moving averages

Golden Cross Screener [Pineify]Golden Cross Screener Pineify – Multi-Symbol Trend Detection Screener for TradingView
Discover the Golden Cross Screener Pineify for TradingView: a multi-symbol, multi-timeframe indicator for crypto and other assets. Customizable Golden Cross detection, robust algorithm, and intuitive screener design for smarter portfolio trend analysis.
Key Features
Multi-symbol screening across major cryptocurrencies or assets – BTCUSD, ETHUSD, XRPUSD, USDT, BNB, SOLUSD, DOGEUSD, TRXUSD (fully customizable).
Multi-timeframe analysis (e.g., 1m, 5m, 10m, 30m), enabling robust trend detection from scalp to swing.
Customizable Moving Average settings for both Fast and Slow MA (source and length).
Efficient screener table, highlighting Golden Cross events and current asset trends in one panel.
Visual cues for bullish, bearish, and cross states using intuitive color-coding and labels.
Flexible symbol and timeframe inputs to tailor the screener to any portfolio or watchlist.
How It Works
The Golden Cross Screener Pineify leverages the classic Golden Cross methodology—a bullish trend signal triggered when a shorter-term moving average crosses above a longer-term moving average. To improve robustness, you are empowered to configure both Fast MA and Slow MA periods and sources, making the detection logic applicable to any symbol, timeframe, or asset class.
Internally, the script runs dedicated calculations on each chosen symbol and timeframe, generating independent signals using exponential moving averages (EMA). Using the TradingView `request.security` function, it fetches and processes price data for up to eight portfolio assets on four timeframes, displaying the detected Golden Cross, Bullish, or Bearish states in a central screener table.
Trading Ideas and Insights
Spot emerging bullish or bearish trends across your favorite crypto pairs or trading assets in real time.
Capture prime opportunities when multiple assets align with Golden Cross signals—ideal for portfolio rebalancing or rotational strategies.
Analyze trend consistency by monitoring cross events at multiple timeframes for a given asset.
Swiftly identify when short-term and long-term momentum diverge—flagging potential reversals or trend initiations.
The Golden Cross Screener Pineify is not just a trend signal; it’s a holistic multi-asset scanner built for traders who know the power of combining technical breadth with agile timing.
How Multiple Indicators Work Together
This screener stands out with its modular approach: each asset/timeframe pair is monitored in isolation, yet displayed collectively for multidimensional market insight. Each symbol’s price action is processed through independently configured EMAs—Fast and Slow—whose crossovers are analyzed for directional bias. The implementation’s real innovation is in its screener table engine: it aggregates signals, synchronizes timeframes, and color-codes market states, allowing users to see confluences, divergences, and sector trends at a glance.
Combining Golden Cross detection with customizable moving averages and flexible multi-timeframe, multi-symbol scanning means users can fine-tune sensitivity, focus on specific signals, and adapt screener logic for scalping, swing trading, or investing.
Unique Aspects
True multi-symbol screener within the TradingView indicator framework.
Full customization of screener assets, timeframes, and moving averages.
Advanced, efficient use of TradingView table for clear, actionable visualization.
No dependency on standard, static MA settings—adjust everything to match your strategy.
Big-picture and granular trend detection in one tool, designed for both active traders and portfolio managers.
How to Use
Add the Golden Cross Screener Pineify to your TradingView chart.
Choose up to eight symbols—crypto, stock, forex, or custom assets.
Set four timeframes for screening, from lower to higher intervals.
Adjust moving average sources (price, close, etc.) and period lengths for both Fast and Slow MAs to suit your trading style.
Interpret table cells: clear labels and color indicate Golden Cross (trend shift), Bullish (uptrend), Bearish (downtrend) states for each symbol/timeframe.
React to signal alignments—deploy or rebalance positions, increase alert sensitivity, or backtest sequence confluences.
Customization
The indicator’s inputs panel gives full control:
Select which symbols to screen, making it perfect for any asset watchlist.
Pick the desired timeframes—mix daily, hourly, or minute-based intervals.
Adjust Fast and Slow MA settings: switch source type, change period length, and fine-tune detection logic as needed.
Style your screener table via TradingView settings (colors, font sizes, alignment).
Every element is customizable—adapt the Golden Cross Screener Pineify for your specific portfolio, trading timeframe, and strategy focus.
Conclusion
The Golden Cross Screener Pineify elevates multi-symbol trend detection to a new level on TradingView. By combining configurable Golden Cross logic with a powerful screener engine, it serves both precision and broad market insight—crucial for agile traders and strategic portfolio managers. Whether you’re tracking crypto pairs, stocks, forex, or a mix, this tool transforms static trend analysis into an active, multi-dimensional trading edge.

TradeScope: MA Reversion • RVOL • Trendlines • GAPs • TableTradeScope is an all-in-one technical analysis suite that brings together price action, momentum, volume dynamics, and trend structure into one cohesive and fully customizable indicator.
An advanced, modular trading suite that combines moving averages, reversion signals, RSI/CCI momentum, relative volume, gap detection, trendline analysis, and dynamic tables — all within one powerful dashboard.
Perfect for swing traders, intraday traders, and analysts who want to read price strength, volume context, and market structure in real time.
⚙️ Core Components & Inputs
🧮 Moving Average Settings
Moving Average Type & Length:
Choose between SMA or EMA and set your preferred period for smoother or more reactive trend tracking.
Multi-MA Plotting:
Up to 8 customizable moving averages (each with independent type, color, and length).
Includes a “window filter” to show only the last X bars, reducing chart clutter.
MA Reversion Engine:
Detects when price has extended too far from its moving average.
Reversion Lookback: Number of bars analyzed to determine historical extremes.
Reversion Threshold: Sensitivity multiplier—lower = more frequent signals, higher = stricter triggers.
🔄 Trend Settings
Short-Term & Long-Term Trend Lookbacks:
Uses linear regression to detect the slope and direction of the short- and long-term trend.
Results are displayed in the live table with color-coded bias:
🟩 Bullish | 🟥 Bearish
📈 Momentum Indicators
RSI (Relative Strength Index):
Adjustable period; displays the current RSI value, overbought (>70) / oversold (<30) zones, and trending direction.
CCI (Commodity Channel Index):
Customizable length with color-coded bias:
🟩 Oversold (< -100), 🟥 Overbought (> 100).
Tooltip shows whether the CCI is trending up or down.
📊 Volume Analysis
Relative Volume (RVOL):
Estimates end-of-day projected volume using intraday progress and compares it against the 20-day average.
Displays whether today’s volume is expected to exceed yesterday’s, and highlights color by strength.
Volume Trend (Short & Long Lookbacks):
Visual cues for whether current volume is above or below short-term and long-term averages.
Estimated Full-Day Volume & Multiplier:
Converts raw volume into “X” multiples (e.g., 2.3X average) for quick interpretation.
🕳️ Gap Detection
Automatically identifies and plots bullish and bearish price gaps within a defined lookback period.
Gap Lookback: Defines how far back to search for gaps.
Gap Line Width / Visibility: Controls the thickness and display of gap lines on chart.
Displays the closest open gap in the live table, including its distance from current price (%).
🔍 ATR & Volatility
14-day ATR (% of price):
Automatically converts the Average True Range into a percent, providing quick volatility context:
🟩 Low (<3%) | 🟨 Moderate (3–5%) | 🟥 High (>5%)
💬 Candlestick Pattern Recognition
Auto-detects popular reversal and continuation patterns such as:
Bullish/Bearish Engulfing
Hammer / Hanging Man
Shooting Star / Inverted Hammer
Doji / Harami / Kicking / Marubozu / Morning Star
Each pattern is shown with contextual color coding in the table.
🧱 Pivot Points & Support/Resistance
Optional Pivot High / Pivot Low Labels
Adjustable left/right bar lengths for pivot detection
Theme-aware text and label color options
Automatically drawn diagonal trendlines for both support and resistance
Adjustable line style, color, and thickness
Detects and tracks touches for reliability
Includes breakout alerts (with optional volume confirmation)
🚨 Alerts
MA Cross Alerts:
Triggers when price crosses the fast or slow moving average within a tolerance band (default ±0.3%).
Diagonal Breakout Alerts:
Detects and alerts when price breaks diagonal trendlines.
Volume-Confirmed Alerts:
Filters breakouts where volume exceeds 1.5× the 20-bar average.
🧾 Live Market Table
A fully dynamic table displayed on-chart, customizable via input toggles:
Choose which rows to show (e.g., RSI, ATR, RVOL, Gaps, CCI, Trend, MA info, Diff, Low→Close%).
Choose table position (top-right, bottom-left, etc.) and text size.
Theme selection: Light or Dark
Conditional background colors for instant visual interpretation:
🟩 Bullish or Oversold
🟥 Bearish or Overbought
🟨 Neutral / Moderate
🎯 Practical Uses
✅ Identify confluence setups combining MA reversion, volume expansion, and RSI/CCI extremes.
✅ Track trend bias and gap proximity directly in your dashboard.
✅ Monitor relative volume behavior for intraday strength confirmation.
✅ Automate MA cross or breakout alerts to stay ahead of key price action.
🧠 Ideal For
Swing traders seeking confluence-based setups
Intraday traders monitoring multi-factor bias
Analysts looking for compact market health dashboards
💡 Summary
TradeScope is designed as a single-pane-of-glass market view — combining momentum, trend, volume, structure, and reversion into one clear visual system.
Fully customizable. Fully dynamic.
Use it to see what others miss — clarity, confluence, and confidence in every trade.

Bitcoin Cycle History Visualization [SwissAlgo]BTC 4-Year Cycle Tops & Bottoms
Historical visualization of Bitcoin's market cycles from 2010 to present, with projections based on weighted averages of past performance.
-----------------------------------------------------------------
CALCULATION METHODOLOGY
Why Bottom-to-Bottom Cycle Measurement?
This indicator defines cycles as bottom-to-bottom periods. This is one of several valid approaches to Bitcoin cycle analysis:
- Focuses on market behavior (price bottoms) rather than supply schedule events (halving-to-halving)
- Bottoms may offer good reference points for some analytical purposes
- Tops tend to be extended periods that are harder to define precisely
- Aligns with how some traditional asset cycles are measured and the timing observed in the broader "risk-on" assets category
- Halving events are shown separately (yellow backgrounds) for reference
- Neither halving-based nor bottom-based measurement is inherently superior
Different analysts prefer different cycle definitions based on their analytical goals. This approach prioritizes observable market turning points.
Cycle Date Definitions
- Approximate monthly ranges used for each event (e.g., Nov 2022 bottom = Nov 1-30, 2022)
- Cycle 1: Jul 2010 bottom → Jun 2011 top → Nov 2011 bottom
- Cycle 2: Nov 2011 bottom → Dec 2013 top → Jan 2015 bottom
- Cycle 3: Jan 2015 bottom → Dec 2017 top → Dec 2018 bottom
- Cycle 4: Dec 2018 bottom → Nov 2021 top → Nov 2022 bottom
- Future cycles will be added as new top/bottom dates become firm
Duration Calculations
- Days = timestamp difference converted to days (milliseconds ÷ 86,400,000)
- Bottom → Top: days from cycle bottom to peak
- Top → Bottom: days from peak to next cycle bottom
- Bottom → Bottom: full cycle duration (sum of above)
Price Change Calculations
- % Change = ((New Price - Old Price) / Old Price) × 100
- Example: $200 → $19,700 = ((19,700 - 200) / 200) × 100 = 9,750% gain
- Approximate historical prices used (rounded to significant figures)
Weighted Average Formula
Recent cycles weighted more heavily to reflect the evolved market structure:
- Cycle 1 (2010-2011): EXCLUDED (too early-stage, tiny market cap)
- Cycle 2 (2011-2015): Weight = 1x
- Cycle 3 (2015-2018): Weight = 3x
- Cycle 4 (2018-2022): Weight = 5x
Formula: Weighted Avg = (C2×1 + C3×3 + C4×5) / (1+3+5)
Example for Bottom→Top days: (761×1 + 1065×3 + 1066×5) / 9 = 1,032 days
Projection Method
- Projected Top Date = Nov 2022 bottom + weighted avg Bottom→Top days
- Projected Bottom Date = Nov 2022 bottom + weighted avg Bottom→Bottom days
- Current days elapsed compared to weighted averages
- Warning symbol (⚠) shown when the current cycle exceeds the historical average
Technical Implementation
- Historical cycle dates are hardcoded (not algorithmically detected)
- Dates represent approximate monthly ranges for each event
- The indicator will be updated as the Cycle 5 top and bottom dates become confirmed
- Updates require manual code maintenance - not automatic
- Users should verify they're using the latest version for current cycle data
-----------------------------------------------------------------
FEATURES
- Background highlights for historical tops (red), bottoms (green), and halving events (yellow)
- Data table showing cycle durations and price changes
- Visual cycle boundary boxes with subtle coloring
- Projected timeframes displayed as dashed vertical lines
- Toggle on/off for each visual element
- Customizable background colors
-----------------------------------------------------------------
DISPLAY SETTINGS
- Show/hide cycle tops, bottoms, halvings, data table, and cycle boxes
- Customizable background colors for each event type
- Clean, institutional-grade visual design suitable for analysis
UPDATES & MAINTENANCE
This indicator is maintained as new cycle events occur. When Cycle 5's top and bottom are confirmed with sufficient time elapsed, the code and projections will be updated accordingly. Check for the latest version periodically.
OPEN SOURCE
Code available for review, modification, and improvement. Educational transparency is prioritized.
-----------------------------------------------------------------
IMPORTANT LIMITATIONS
⚠ EXTREMELY SMALL SAMPLE SIZE
Based on only 4 complete cycles (2011-2022). In statistical analysis, this is insufficient for reliable predictions.
⚠ CHANGED MARKET STRUCTURE
Bitcoin's market has fundamentally evolved since early cycles:
- 2010-2015: Tiny market cap, retail-only, unregulated
- 2024-2025: Institutional adoption, spot ETFs, regulatory frameworks, macro correlation
The environment that created past patterns no longer exists in the same form.
⚠ NO PREDICTIVE GUARANTEE
Historical patterns can and do break. Market cycles are not laws of physics. Past performance does not guarantee future results. The next cycle may not follow historical averages.
⚠ LENGTHENING CYCLE THEORY
Some analysts believe cycles are extending over time (diminishing returns, maturing market). If true, simple averaging underestimates future cycle lengths.
⚠ SELF-FULFILLING PROPHECY RISK
The halving narrative may be partially circular - it works because people believe it works. Sufficient changes in market structure or participant behavior can invalidate the pattern.
⚠ APPROXIMATE DATA
Historical prices rounded to significant figures. Exact bottom/top dates vary by exchange. Month-long ranges are used for simplicity.
EDUCATIONAL USE ONLY
This indicator is designed for historical analysis and understanding Bitcoin's past behavior. It is NOT:
- Trading advice or financial recommendations
- A guarantee or prediction of future price movements
- Suitable as a sole basis for investment decisions
- A replacement for fundamental or technical analysis
The projections show "what if the pattern continues exactly" - not "what will happen."
Always conduct independent research, understand the risks, and consult qualified financial advisors before making investment decisions. Only invest what you can afford to lose.

Adaptive Convergence Divergence### Adaptive Convergence Divergence (ACD)
By Gurjit Singh
The Adaptive Convergence Divergence (ACD) reimagines the classic MACD by replacing fixed moving averages with adaptive moving averages. Instead of a static smoothing factor, it dynamically adjusts sensitivity based on price momentum, relative strength, volatility, fractal roughness, or volume pressure. This makes the oscillator more responsive in trending markets while filtering noise in choppy ranges.
#### 📌 Key Features
1. Dual Adaptive Structure: The oscillator uses two adaptive moving averages to form its convergence-divergence line, with EMA/RMA as signal line:
* Primary Adaptive (MA): Fast line, reacts quickly to changes.
* Following Adaptive (FAMA): Slow line, with half-alpha smoothing for confirmation.
2. Adaptive MA Types
* ACMO: Adaptive CMO (momentum)
* ARSI: Adaptive RSI (relative strength)
* FRMA: Fractal Roughness (volatility + fractal dimension)
* VOLA: Volume adaptive (volume pressure)
3. PPO Option: Switch between classic MACD or Percentage Price Oscillator (PPO) style calculation.
4. Signal Smoothing: Choose between EMA or Wilder’s RMA.
5. Visuals: Colored oscillator, signal line, histogram with adaptive transparency.
6. Alerts: Bullish/Bearish crossovers built-in.
#### 🔑 How to Use
1. Add to chart: Works on any timeframe and asset.
2. Choose MA Type: Experiment with ACMO, ARSI, FRMA, or VOLA depending on market regime.
3. Crossovers:
* Bullish (🐂): Oscillator crosses above signal → potential long entry.
* Bearish (🐻): Oscillator crosses below signal → potential short entry.
4. Histogram: expansion = strengthening trend; contraction = weakening trend.
5. Divergences:
* Bullish (hidden strength): Price pushes lower, but ACD turns higher = potential upward reversal.
* Bearish (hidden weakness): Price pushes higher, but ACD turns lower = potential downward reversal.
6. Customize: Adjust lengths, smoothing type, and PPO/MACD mode to match your style.
7. Set Alerts:
* Enable Bullish or Bearish crossover alerts to catch momentum shifts in real time.
#### 💡 Tips
* PPO mode normalizes values across assets, useful for cross-asset analysis.
* Wilder’s smoothing is gentler than EMA, reducing whipsaws in sideways conditions.
* Adaptive smoothing helps reduce false divergence signals by filtering noise in choppy ranges.

LMAsLibrary "LMAs"
Credits
Thank you to @QuantraSystems for dynamic calculations.
Introduction
This lightweight library offers dynamic implementations of popular moving averages that adapt their length automatically as new bars are added to the chart.
Each function is built on a dynamic length formula:
len = math.min(maxLength, bar_index + 1)
This approach ensures that calculations begin as early as the first bar, allowing for smoother initialization and more consistent behavior across all timeframes. It’s especially useful in custom scripts that run from bar 0 or when historical data is limited.
Usage
You can use this library as a drop-in replacement for standard moving averages. It provides more flexibility and stability in live or backtesting environments where fixed-length indicators may delay or fail to initialize properly.
Why Use This?
• Works from the very first bar
• Avoids na values during early bars
• Great for real-time indicators, strategies, and bar-replay
• Clean and efficient code with dynamic behavior
How to Use
Import the library into your script and call any of the included functions just like you would with their native counterparts.
Summary
A lightweight Pine Script™ library offering dynamic moving averages that work seamlessly from the very first bar. Ideal for strategies and indicators requiring robust initialization and adaptive behavior.
SMA(sourceData, maxLength)
Dynamic SMA
Parameters:
sourceData (float)
maxLength (int)
EMA(src, length)
Dynamic EMA
Parameters:
src (float)
length (int)
DEMA(src, length)
Dynamic DEMA
Parameters:
src (float)
length (int)
TEMA(src, length)
Dynamic TEMA
Parameters:
src (float)
length (int)
WMA(src, length)
Dynamic WMA
Parameters:
src (float)
length (int)
HMA(src, length)
Dynamic HMA
Parameters:
src (float)
length (int)
VWMA(src, volsrc, length)
Dynamic VWMA
Parameters:
src (float)
volsrc (float)
length (int)
SMMA(src, length)
Dynamic SMMA
Parameters:
src (float)
length (int)
LSMA(src, length, offset)
Dynamic LSMA
Parameters:
src (float)
length (int)
offset (int)
RMA(src, length)
Dynamic RMA
Parameters:
src (float)
length (int)
ALMA(src, length, offset_sigma, sigma)
Dynamic ALMA
Parameters:
src (float)
length (int)
offset_sigma (float)
sigma (float)
ZLSMA(src, length)
Dynamic ZLSMA
Parameters:
src (float)
length (int)
FRAMA(src, length)
Parameters:
src (float)
length (int)
KAMA(src, length)
Dynamic KAMA
Parameters:
src (float)
length (int)
JMA(src, length, phase)
Dynamic JMA
Parameters:
src (float)
length (int)
phase (float)
T3(src, length, volumeFactor)
Dynamic T3
Parameters:
src (float)
length (int)
volumeFactor (float)

Supertrend - SSL Strategy with Toggle [AlPashaTrader]📈 Overview of the Supertrend - SSL Strategy with Toggle Indicator
This strategy combines two powerful technical tools—Supertrend and SSL Channel—to deliver precise and reliable trading signals, designed for traders who value confirmation and risk management. 🎯
⚙️ How This Indicator Was Created
The strategy was meticulously crafted to harness the complementary strengths of:
Supertrend Indicator: A trend-following tool based on Average True Range (ATR) and a multiplier factor, it detects bullish or bearish trends by calculating dynamic support and resistance levels. 📊
SSL Channel: A channel indicator built using two Simple Moving Averages (SMA) of the highs and lows over a set period. It cleverly determines trend direction by comparing price action relative to these moving averages. 🔄
These two indicators are merged into one cohesive strategy with an optional toggle feature allowing the trader to choose whether to require confirmation from both indicators before taking a position or to act on signals from either. 🎚️
The script includes user-friendly controls for:
Defining a custom trading date range 📅, useful for backtesting or restricting trading to specific market conditions.
Setting the ATR length and multiplier for Supertrend sensitivity ⚙️.
Adjusting the SSL channel period for responsiveness to price changes ⏱️.
Choosing whether to require dual confirmation (both Supertrend and SSL signals) for more conservative trading or a single indicator trigger for a more aggressive approach 🛡️ vs ⚔️.
🔍 How This Indicator Works
Signal Generation:
Supertrend analyzes market volatility and trend direction, signaling a potential buy when the trend turns bullish 📈 and a sell when bearish 📉.
SSL Channel tracks price relative to its high and low moving averages to identify uptrends and downtrends. A crossover of the SSL Up and SSL Down lines generates buy or sell signals 🔔.
Confirmation Logic:
When confirmation is enabled, the strategy waits for agreement between both indicators before entering a trade ✅, reducing false signals.
When confirmation is disabled, it trades based on signals from either indicator ⚡, allowing more frequent entries but potentially higher risk.
Entry and Exit Rules:
Entry occurs when the indicator(s) signal a new trend direction 🚀 for long, or decline for short.
Exit happens when opposing signals appear 🛑, closing existing positions to lock in profits or cut losses.
Visual Aids:
The SSL Channel lines are plotted directly on the chart with distinct colors to intuitively show trend shifts 🎨.
The system respects the specified date range ⏳, ensuring trades only occur within user-defined periods.
🎯 How to Use This Strategy Effectively
Set Your Preferences: Adjust ATR length, factor, and SSL period to your style. More sensitive? Decrease lengths. Smoother? Increase them ⚙️.
Choose Confirmation Mode: Use the toggle depending on your risk appetite:
Confirmation ON ✅: For conservative traders wanting high-probability setups.
Confirmation OFF ⚡: For aggressive traders who want more signals.
Apply Date Filters: Focus your trading or backtesting on specific periods 📅.
Monitor Entry/Exit Signals: Watch crossovers and Supertrend changes closely 👀.
Risk Management: The strategy uses position sizing as a percentage of equity (default 15%) 💰. Adjust accordingly.
Combine with Other Tools: Enhance results by combining this with volume, price action, or fundamentals 🔧.
📝 Summary
This Supertrend - SSL Strategy with Toggle is a dynamic and flexible trading tool blending volatility-based trend detection with moving-average channel insights. It empowers traders to customize confirmation strictness, control trading periods, and efficiently capture trending opportunities while managing risk smartly.
By integrating proven indicators in a user-friendly, visually intuitive package, this strategy stands as a sophisticated tool suitable for various markets and trading styles. 🚀📊

Multi Moving Average with CustomizationCore Functionality
The indicator allows you to display up to 5 different moving averages on your chart simultaneously.
Each moving average can be fully customized with its own settings.
You can choose between
1. Simple Moving Average (SMA),
2. Exponential Moving Average (EMA)
3. Weighted Moving Average (WMA) types
Multi-Timeframe Support
One standout feature is the ability to display higher timeframe moving averages on lower timeframe charts.
For example, you can show a 200 EMA from the daily chart while viewing a 15-minute chart.
Advanced Visualization Features
The indicator includes several visualization enhancements:
1. MA Cloud - Creates a filled area between any two selected moving averages. The cloud automatically changes color based on which MA is on top - typically green when the faster MA is above (bullish) and red when below (bearish).
2. Golden/Death Cross Detection - Automatically detects and marks important MA crossover events:
* Golden Cross: When a shorter-term MA crosses above a longer-term MA (bullish signal)
* Death Cross: When a shorter-term MA crosses below a longer-term MA (bearish signal)
3. Trend Background - Colors the entire chart background based on whether price is above or below a specified MA, giving a clear visual indicator of the overall trend.
Alert System
The indicator can generate alerts when price crosses above or below any selected moving average. This feature is useful for automated trading signals or notifications, and can be configured to trigger once per bar.
Flexible Architecture
The code uses several programming techniques to maximize flexibility:
* Switch statements for selecting MA types and cloud values
* Conditional logic throughout the code
* Function abstraction for calculating MAs and handling multi-timeframe display
* String identifiers to select which MAs to use for cloud visualization
Unique Technical Aspects
1. The multi-timeframe plotting function solves the common problem of higher timeframe MAs looking distorted on lower timeframe charts.
2. The cloud feature uses string identifiers to select which MAs to use, allowing for any combination.
3. The indicator employs smart conditional logic to handle complex decision trees efficiently.
4. Every visual aspect (colors, line widths, display conditions) is customizable through the settings.
This indicator combines multiple technical analysis tools into a single, highly configurable package that can adapt to different trading styles and timeframes.
Its ability to correctly display higher timeframe MAs on lower timeframe charts makes it particularly valuable for traders who analyze multiple timeframes simultaneously.