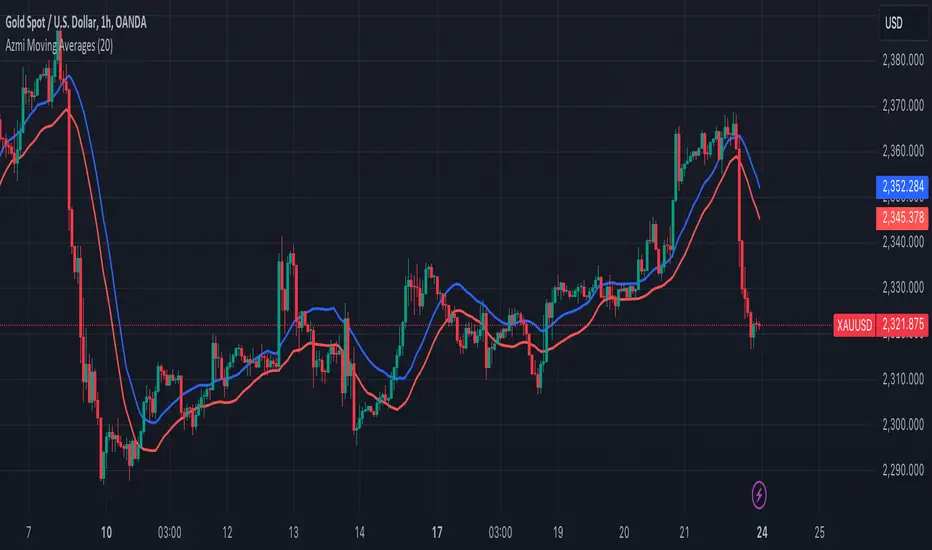
Azmi Moving AveragesThis trading indicator, designed using Pine Script, incorporates two simple moving averages (SMAs) with the same length but different data sources. Here's a detailed description of the indicator:
### Indicator Overview
**Name:** Two Moving Averages
### Inputs
1. **Length (20):** The period over which the moving averages are calculated. Both moving averages use a length of 20 periods.
2. **Source:**
- **High:** The first moving average is calculated using the high prices of the candles.
- **Low:** The second moving average is calculated using the low prices of the candles.
### Calculations
1. **MA High (maHigh):** This is the simple moving average of the high prices over the specified length (20 periods). It smooths the high prices over time, showing the average high price trend.
2. **MA Low (maLow):** This is the simple moving average of the low prices over the same length (20 periods). It smooths the low prices over time, showing the average low price trend.
### Plotting
- **MA High (Blue Line):** This line represents the moving average of the high prices. It is plotted in blue with a line width of 2.
- **MA Low (Red Line):** This line represents the moving average of the low prices. It is plotted in red with a line width of 2.
### Interpretation
1. **Trend Identification:**
- **Bullish Trend:** When the MA High is above the MA Low, it generally indicates a bullish trend, as the average high prices are higher than the average low prices.
- **Bearish Trend:** When the MA High is below the MA Low, it suggests a bearish trend, as the average high prices are lower than the average low prices.
2. **Support and Resistance:**
- The MA High can act as a dynamic resistance level, where the price may face selling pressure.
- The MA Low can act as a dynamic support level, where the price may find buying interest.
3. **Price Channels:**
- The area between the MA High and MA Low creates a channel that can help traders visualize the range within which the price is fluctuating. This channel can be used to identify potential breakout or breakdown points.
### Example Usage
- **Buy Signal:** A potential buy signal may occur when the price crosses above both the MA High and MA Low, indicating a possible upward trend.
- **Sell Signal:** A potential sell signal may occur when the price crosses below both the MA High and MA Low, indicating a possible downward trend.
This indicator provides a visual representation of the average high and low prices, helping traders identify trends, potential support and resistance levels, and price channels for better trading decisions.
Cari dalam skrip untuk "averages"
Coiled Moving AveragesThis indicator detects when 3 moving averages converge and become coiled. This indicates volatility contraction which often leads to volatility expansion, i.e. large price movements.
Moving averages are considered coiled when the percent difference from each moving average to the others is less than the Coil Tolerance % input value.
This indicator is unique in that it detects when moving averages converge within a specified percent range. This is in contrast to other indicators that only detect moving average crossovers, or the distance between price and a moving average.
This indicator includes options such as:
- % difference between the MAs to be considered coiled
- type and length of MAs
- background color to indicate when the MAs are coiled
- arrows to indicate if price is above or below the MAs when they become coiled
While coiling predicts an increased probability for volatility expansion, it does not necessarily predict the direction of expansion. However, the arrows which indicate whether price is above or below the moving average coil may increase the odds of a move in that direction. Bullish alignment of the moving averages (faster MAs above the slower MAs) may also increase the odds of a bullish break, while bearish alignment may increase the odds of a bearish break.
Note that mean reversion back to the MA coil is common after initial volatility expansion. This can present an entry opportunity for traders, as mean reversion may be followed by continuation in the direction of the initial break.
Experiment with different settings and timeframes to see how coiled MAs can help predict the onset of volatility.

Fibonacci Averages Trend OscillatorOverview:
The Fibonacci Averages Trend Oscillator is a unique technical indicator that leverages Fibonacci numbers to analyze market trends. It calculates the average trend sentiment over periods determined by Fibonacci numbers and smooths the result to create an oscillator.
Key Features:
Uses Fibonacci sequences for trend analysis.
Smooths the trend data to create a clear oscillator.
Offers adjustable oversold and overbought levels for customized analysis.
Inputs:
Max Fib Number: Select the highest Fibonacci number for trend calculation.
Smooth: Adjust the smoothness of the oscillator line.
Using the Oscillator:
A rising oscillator indicates a bullish trend, while a falling oscillator suggests bearish sentiment.
Oversold and overbought levels help identify potential reversal points.
Use the oscillator in conjunction with other indicators for comprehensive market analysis.
Tips for Effective Use:
Adjusting Fibonacci Levels: Experiment with different 'Max Fib Number' settings to find the one that best matches your trading style and the asset's characteristics. Higher Fibonacci numbers consider longer periods, which might be more suitable for long-term trend analysis.
Smoothing Level: The 'Smooth' input helps in reducing noise. A higher smooth level results in a less responsive but smoother line, which can be useful for identifying the overall trend direction.
Interpreting Overbought/Oversold: Watch for the oscillator reaching overbought or oversold levels. These points could signal potential trend reversals or consolidation phases.
Combination with Other Tools: For best results, combine the Fibonacci Averages Trend Oscillator with other technical tools like moving averages, RSI, or MACD to validate the signals and develop a robust trading strategy.
Conclusion:
The Fibonacci Averages Trend Oscillator offers a unique approach to trend analysis by incorporating Fibonacci numbers into its calculation. Its adjustable settings allow for customization to fit various trading styles and market conditions, making it a versatile tool for traders seeking to enhance their technical analysis capabilities.

MTF Moving AveragesThe MTF Moving Averages indicator allows users to plot multiple moving averages on different timeframes within the same chart on TradingView. This indicator supports four different timeframes: daily, weekly, monthly, and intraday.
For each timeframe, users can choose up to four moving averages to plot. They can also select the type of moving average (SMA, EMA, or WMA), the source (e.g., close price), and the length of each moving average. Additionally, users have the option to enable a "Trend Suite" for the second moving average on the daily timeframe. The Trend Suite adds 2 moving averages with source low and high.
In the intraday timeframe, the second moving average is calculated and plotted based on the daily timeframe.
The indicator provides customization options for colors, allowing users to define the colors for each moving average line.
The settings in the indicator are designed in a clear and organized manner.
Have fun

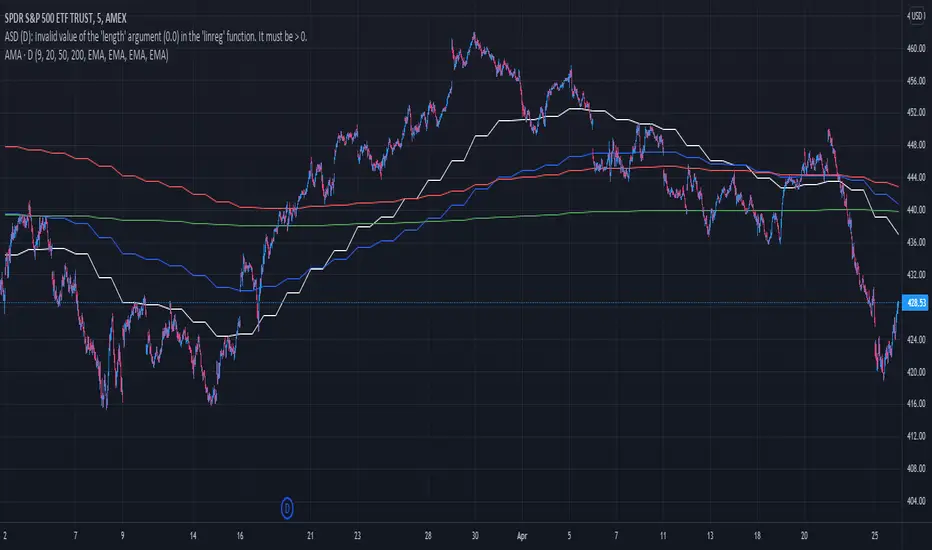
Multiple Exponential Moving AveragesThe "Multiple Exponential Moving Averages" indicator is a custom technical analysis tool created for TradingView. It combines five different Exponential Moving Averages (EMAs) into a single indicator. Each EMA has a user-defined length, and they are plotted on the chart with different colors to differentiate them.
Exponential Moving Averages are commonly used in technical analysis to smooth out price data and identify trends. They give more weight to recent price data, making them more responsive to recent price changes than Simple Moving Averages (SMAs). By combining multiple EMAs with different lengths, TradingView users will no longer have to worry that they will run out of slots when wanting to add new indicators to their chart.

Fibonacci Moving Averages Input(FibMAI) Fibonacci Moving Averages Input is a strategy based on moving averages cross-over or cross-under signals. The bullish golden cross appears on a chart when a stock's short-term moving average crosses above its long-term moving average. The bearish death cross appears on a chart when a stock’s short-term moving average, crosses below its long-term moving average. The general market consensus values used are the 50-day moving average and the 200-day moving average.
With the (FibMAI) Fibonacci Moving Averages Input strategy you can use any value you choose for your bullish or bearish cross. For visual display purposes I have a lot of the Fib Moving Averages 1, 2, 3, 5, 8, 13, 21, 34, 55, 89, 144, 233, 377, 610, 987 shown while hiding the chart candlesticks. But to use this indicator I click on only a couple of MA's to see if there's a notable cross-over or cross-under pattern signal. Then, most importantly, I back test those values into the FibMAI strategy Long or Short settings input.
For example, this NQ1! day chart has it's Long or Short settings input as follows:
Bullish =
FibEMA34
cross-over
FibEMA144
Bearish =
FibEMA55
cross-under
FibSMA144
As you can see you can mix or match 4 different MA's values either Exponential or Simple.
Default color settings:
Rising value = green color
Falling value = red color
Default Visual FibMA settings:
FibEMA's 1, 2, 3, 5, 8, 13, 21, 34, 55, 89, 144, 233, 377, 610, 987, 1597, 2584, 4181
Default Visual MA settings:
SMA's 50, 100, 150, 200
Default Long or Short settings:
Bullish =
FibEMA34
cross-over
FibEMA144
Bearish =
FibEMA55
cross-under
FibSMA144

Moving Averages based on higher TimeframesOVERVIEW
This indicator gives you the possibility to plot up to 10 individually adjustable moving averages on to one chart. You can individualize them based on several criteria.
FEATURES
Type : You can define which type of moving average you want to use. Possible options are EMA, SMA, WMA, HMA, and RMA.
Source : By default, moving averages use the closing price as source, but you can use all OHCL values as source.
Length : Set the length of the moving average.
Timeframe : Select any timeframe the moving average should be based on.
Smooth line : Plot the moving average as a smooth or a stepped line.
Important : This indicator was designed to request values from moving averages of a timeframe higher than the current chart timeframe. It is not recommended to request values from moving averages of a timeframe lower than the current chart timeframe.
If you find errors of any kind or have suggestions to improve this indicator or just want to give some feedback, please feel free to post a comment below.

STD-Stepped, Variety N-Tuple Moving Averages [Loxx]STD-Stepped, Variety N-Tuple Moving Averages is the standard deviation stepped/filtered indicator of the following indicator
Variety N-Tuple Moving Averages is a moving average indicator that allows you to create 1- 30 tuple moving average types; i.e., Double-MA, Triple-MA, Quadruple-MA, Quintuple-MA, ... N-tuple-MA. This version contains 5 different moving average types including T3. A list of tuples can be found here if you'd like to name the order of the moving average by depth: Tuples extrapolated
STD-Stepped, You'll notice that this is a lot of code and could normally be packed into a single loop in order to extract the N-tuple MA, however due to Pine Script limitations and processing paradigm this is not possible ... yet.
If you choose the EMA option and select a depth of 2, this is the classic DEMA ; EMA with a depth of 3 is the classic TEMA , and so on and so forth this is to help you understand how this indicator works. This version of NTMA is restricted to a maximum depth of 30 or less. Normally this indicator would include 50 depths but I've cut this down to 30 to reduce indicator load time. In the future, I'll create an updated NTMA that allows for more depth levels.
This is considered one of the top ten indicators in forex. You can read more about it here: forex-station.com
How this works
Step 1: Run factorial calculation on the depth value,
Step 2: Calculate weights of nested moving averages
factorial(nemadepth) / (factorial(nemadepth - k) * factorial(k); where nemadepth is the depth and k is the weight position
Examples of coefficient outputs:
6 Depth: 6 15 20 15 6
7 Depth: 7 21 35 35 21 7
8 Depth: 8 28 56 70 56 28 8
9 Depth: 9 36 34 84 126 126 84 36 9
10 Depth: 10 45 120 210 252 210 120 45 10
11 Depth: 11 55 165 330 462 462 330 165 55 11
12 Depth: 12 66 220 495 792 924 792 495 220 66 12
13 Depth: 13 78 286 715 1287 1716 1716 1287 715 286 78 13
Step 3: Apply coefficient to each moving average
For QEMA, which is 5 depth EMA , the caculation is as follows
ema1 = ta. ema ( src , length)
ema2 = ta. ema (ema1, length)
ema3 = ta. ema (ema2, length)
ema4 = ta. ema (ema3, length)
ema5 = ta. ema (ema4, length)
qema = 5 * ema1 - 10 * ema2 + 10 * ema3 - 5 * ema4 + ema5
Included:
Alerts
Loxx's Expanded Source Types
Bar coloring
Signals
Standard deviation stepping

STD-Filtered Variety RSI of Double Averages w/ DSL [Loxx]STD-Filtered Variety RSI of Double Averages w/ DSL is a standard deviation step filtered RSI indicator that is calculated using double smoothing. The user can choose from 8 different RSI types and 38 different double smoothing types. This indicator uses Discontinued Signal Lines instead of regular signals and levels. This allows the signals to be more precise in catching early trend breakouts and breakdowns.
Things to note
Double smoothing of the source does not function like DEMA, for example. This double smoothing is just smoothing of smoothing of source
There are two types of smoothing for Discontinued Signals Lines: Regular EMA and Fast EMA
T3 RSI has been added on top of Loxx's Variety RSI library
Contained inside this indicator
Loxx's Moving Averages
Loxx's Variety RSI
Related indicators
Corrected RSI w/ Floating Levels
Adaptive, Jurik-Filtered, Floating RSI
Variety RSI w/ Dynamic Zones
Included
Bar coloring
Alerts
2 types of signals with precision adjustment
Loxx's Variety RSI
Loxx's Moving Averages

Aggregated Moving AveragesUsers can display moving averages from higher time frame charts and display them on their current chart. This script supports up to 4 moving averages aggregated from a selected time frame. Each plot can be toggled if the user does not wish to have all 4 plots displayed.
Inputs allow user to edit:
Moving average length
Average type
Color
Timeframe input allows user to select which timeframe the moving averages are calculated from.
If you wish to have multiple timeframes across different moving averages, it is recommended you add a separate copies of the indicator for each timeframe you wish to display. Toggle visibility of which plots which you don't need.
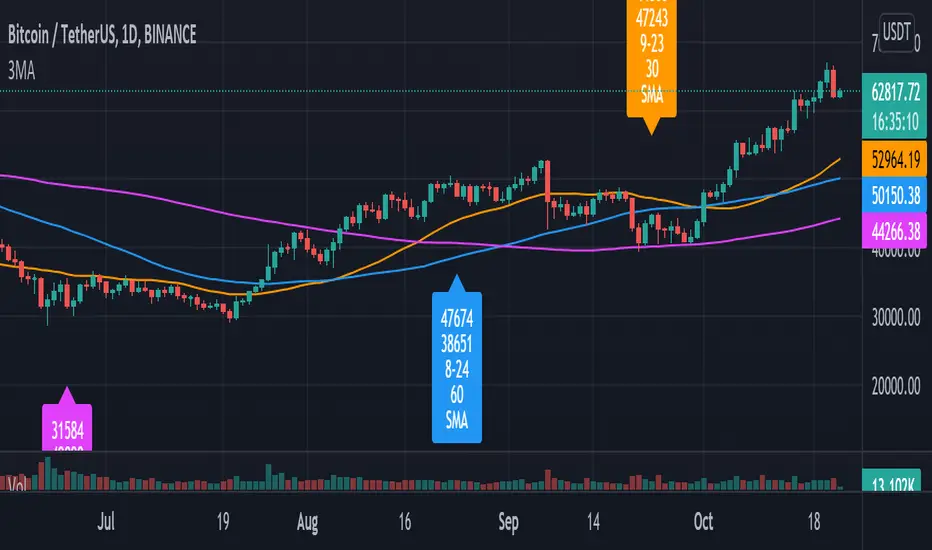
Pulu's 3 Moving Averages
Pulu's 3 Moving Averages
Release version 1, date 2021-09-28
This script allows you to customize three sets of moving averages, turn on/off, set color and parameters. It also tags the start date of the last set of moving average if there is. This, release version 1, supports eight moving average algorithms:
ALMA, Arnaud Legoux Moving Average
EMA, Exponential Moving Average
RMA, Adjusted exponential moving average (aka Wilder’s EMA)
SMA, Simple Moving Average
SWMA, Symmetrically-Weighted Moving Average
VWAP, Volume-Weighted Average Price
VWMA, Volume-Weighted Moving Average
WMA, Weighted Moving Average
The availability and function parameters
Func. Availability Parameters
ALMA
MA1, MA2, MA3
source
length
offset
sigma
EMA
RMA
SMA
VWMA
WMA
MA1, MA2, MA3
source
length
SWMA
VWAP
MA1
source
Parameters
Parameter Description
source the series of values to process. The default is to use the closing price to calculate the moving average.
length an integer value that defines the number of bars to calculate the moving average on. The SWMA and VWAP do not use this parameter.
ALMA offset a floating-point value that controls the tradeoff between smoothness (with a value closer to 1) and responsiveness (with a value closer to 0). This parameter is only used by ALMA.
ALMA sigma a floating-point value that specifies the ALMA’s smoothness. The larger this value, the smoother the moving average is. This parameter is only used by ALMA.
I'm not sure if it is needed, so I do not let the three Moving Averages of the script to have indivial algorithm setting. Because that will involve much complicated condition testing and use up more TradingView script lines limit. If you need to combine different algorithms in the three sets of moving averages, or have other ideas, leave a message to let me know; maybe I will try it in the next update.
我不確定是否需要,所以我沒有讓腳本的三組移動平均線有各別的算法設置。因為這將涉及更多複雜的條件測試,並使用更多 TradingView 腳本列數限制。如果您需要在三組均線中組合不同的算法,或者有其他想法,請留言告訴我;也許我會在下一次更新中嘗試。
Trend System Multiple Moving Averages RatingThis is a trend system made with multiple moving averages designed especially for trending markets such as stocks or crypto.
It can be used with any timeframe.
Its made of multiple moving averages such as
Simple
Weighted
Volume Weighted
Exponential
Double EMA
Arnaud Legoux
Hull MA
Smoothed
Least Squares
Kaufman Adaptive
Triple EMA
Zero Lag
Fractal Adaptive
Variable Index Dynamic Average
Jurik Moving Average
Tillson
Triangular
Avg of all moving averages
It has also a rating, making an avg from all of the moving averages , going from -100 (all ma's are telling to go short ) to 100 ( all ma are telling to go long).
If you have any questions let me know !

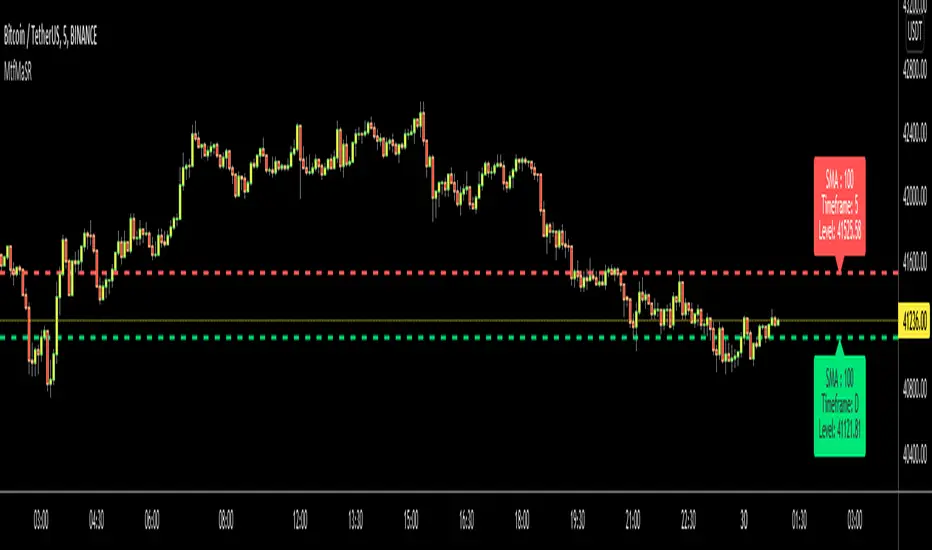
Moving Averages as Support Resistance MTFHello Traders!
As most of you know that Moving Averages with the lengths 50, 100, 150 and 200 are very important. We should use these this moving averages to figure out S/R levels, the possible reversals points, trend direction etc. we should check these moving averages on Higher Time Frames as well. for example if you look at the chart with 5mins time frame, you should also check it in 1hour and 4hour time frames to see to big picture and main trend. this is important as trend is your friend and you should not take positions against the trend.
I developed this script to show them clearly and make the chart understandable. 1 resistance line above the price and 1 support line below the price, it shows the moving average type, length, time frame and S/R level.
You have option to show SMA or EMA and to include/exclude current time frame, because you may want to see only MAs from higher time frames. you should set higher time frames accordingly.
if you add all moving averages for current and higher time frame the chart looks very crowded as following example:
The script makes it clear to understand the chart better, here an example:
It can show when S/R was broken and you get alert. here an example:
You have coloring and style options, you can change line style and colors as you wish:
Enjoy!
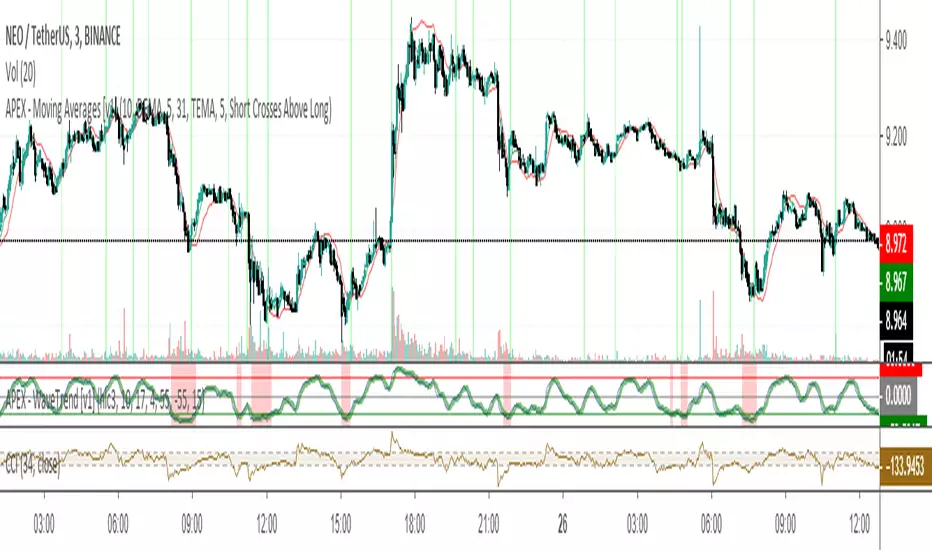
APEX - Moving Averages [v1]A moving average is the most known indicator that takes into consideration price from the last several periods of the price and calculates a smoothed line also known as a Moving average. This way you will cut out a lot of the noise and have a different view.
The most common usage is the moving average crossover system when you buy and sell when a crossover happens. This system is in general not very profitable but can be used effectively in trending markets.
There is really no general rule to what length should be used. The most well-known and respected lengths are 20 / 50 / 100 / 200 for almost all average. These values are respected as strong resistance and support levels. but if you plan to use a crossover Systems the most profitable settings tend to be when the averages are close together 14 and 28 etc. But this is an area I would appeal to for you to really try out what works and what does not.
Other uses of moving averages are the following:
Crossover system
Moving averages are pointing up and price crosses below (Buy Pullback)
The slow-moving average is Below the fast moving average to help to identify possible bullishness
Can be used as support and resistance lines
If you are an advanced user you may want to try out the following techniques:
Create your own moving average by combining several of those together with the source function
Using the Average True Range to create Keltner Channels
Using Standard deviation to create Bollinger bands (Bollinger bands are also accessible on their own)
You can use Moving averages to smooth the noise on other indicators such as RSI / CCI / MFI
Chanpreet Moving AveragesChanpreet Moving Averages
by Chanpreet Singh
This script plots up to four customizable moving averages (SMA, EMA, SMMA/RMA, WMA, VWMA).
You can adjust:
Moving average type
Source (close, open, hl2, etc.)
Length
Color
An optional input lets you select a higher or custom timeframe for the moving averages (e.g., daily MA on a 1-hour chart). If left empty, the script calculates them on the current chart timeframe, so the lines scale and move naturally when zooming or panning.
This tool is designed for educational and visualization purposes, helping traders see trend direction and potential areas of dynamic support/resistance.
⚠️ Disclaimer: This script does not provide financial advice or trading signals. Use it at your own risk. Always do your own research before making trading decisions.
Multiple Colored Moving AveragesMULTIPLE COLORED MOVING AVERAGES - USER GUIDE
DISCLAIMER
----------
Both the code and this documentation were created heavily using artificial intelligence. I'm lazy...
This indicator was inspired by repo32's "Moving Average Colored EMA/SMA" indicator. *
What is this indicator?
-----------------------
This is a TradingView indicator that displays up to 4 different moving averages on your chart simultaneously. Each moving average can be customized with different calculation methods, colors, and filtering options.
Why would I use multiple moving averages?
-----------------------------------------
- See trend direction across different timeframes at once
- Identify support and resistance levels
- Spot crossover signals between fast and slow MAs
- Reduce false signals with filtering options
- Compare how different MA types react to price action
What moving average types are available?
----------------------------------------
11 different types:
- SMA: Simple average, equal weight to all periods
- EMA: Exponential, more weight to recent prices
- WMA: Weighted, linear weighting toward recent data
- RMA: Running average, smooth like EMA
- DEMA: Double exponential, reduced lag
- TEMA: Triple exponential, even less lag
- HMA: Hull, fast and smooth combination
- VWMA: Volume weighted, includes volume data
- LSMA: Least squares, based on linear regression
- TMA: Triangular, double-smoothed
- ZLEMA: Zero lag exponential, compensated for lag
How do I set up the indicator?
------------------------------
Each MA has these settings:
- Enable/Disable: Turn each MA on or off
- Type: Choose from the 11 calculation methods
- Length: Number of periods (21, 50, 100, 200 are common)
- Smoothing: 0-10 levels of extra smoothing
- Noise Filter: 0-5% to ignore small changes
- Colors: Bullish (rising) and bearish (falling) colors
- Line Width: 1-5 pixels thickness
What does the smoothing feature do?
-----------------------------------
Smoothing applies extra calculations to make the moving average line smoother. Higher levels reduce noise but make the MA respond slower to price changes. Use higher smoothing in choppy markets, lower smoothing in trending markets.
What is the noise filter?
--------------------------
The noise filter ignores small percentage changes in the moving average. For example, a 0.3% filter will ignore any MA movement smaller than 0.3%. This helps eliminate false signals from minor price fluctuations.
When should I use this indicator?
---------------------------------
- Trend analysis: See if market is going up, down, or sideways
- Entry timing: Look for price bounces off MA levels
- Exit signals: Watch for MA slope changes or crossovers
- Support/resistance: MAs often act as dynamic levels
- Multi-timeframe analysis: Use different lengths for different perspectives
What are some good settings to start with?
-------------------------------------------
Conservative approach:
- MA 1: EMA 21 (short-term trend)
- MA 2: SMA 50 (medium-term trend)
- MA 3: SMA 200 (long-term trend)
- Low noise filtering (0.1-0.3%)
Active trading:
- MA 1: HMA 9 (very responsive)
- MA 2: EMA 21 (short-term)
- MA 3: EMA 50 (medium-term)
- Minimal or no smoothing
How do I interpret the colors?
------------------------------
Each MA changes color based on its direction:
- Bullish color: MA is rising (upward trend)
- Bearish color: MA is falling (downward trend)
- Gray: MA is flat or unchanged
What should I look for in crossovers?
-------------------------------------
- Golden Cross: Fast MA crosses above slow MA (bullish signal)
- Death Cross: Fast MA crosses below slow MA (bearish signal)
- Multiple crossovers in same direction can confirm trend changes
- Wait for clear separation between MAs after crossover
How do I use MAs for support and resistance?
---------------------------------------------
- In uptrends: MAs often provide support when price pulls back
- In downtrends: MAs may act as resistance on rallies
- Multiple MAs create support/resistance zones
- Stronger levels where multiple MAs cluster together
Can I use this with other indicators?
-------------------------------------
Yes, it works well with:
- Volume indicators for confirmation
- RSI or MACD for timing entries
- Bollinger Bands for volatility context
- Price action patterns for setup confirmation
What if I get too many signals?
-------------------------------
- Increase smoothing levels
- Raise noise filter percentages
- Use longer MA periods
- Focus on major crossovers only
- Wait for multiple MA confirmation
What if signals are too slow?
-----------------------------
- Reduce smoothing to 0
- Lower noise filter values
- Switch to faster MA types (HMA, ZLEMA, DEMA)
- Use shorter periods
- Focus on the fastest MA only
Which MA types work best in different markets?
----------------------------------------------
Trending markets: EMA, DEMA, TEMA (responsive to trends)
Choppy markets: SMA, TMA, HMA with smoothing (less whipsaws)
High volatility: Use higher smoothing and noise filtering
Low volatility: Use minimal filtering for better responsiveness
Do I need all the advanced features?
------------------------------------
No. Start with basic settings:
- Choose MA type and length
- Set colors you prefer
- Leave smoothing at 0
- Leave noise filter at 0
Add complexity only if needed to improve signal quality.
How do I know if my settings are working?
-----------------------------------------
- Backtest on historical data
- Paper trade the signals first
- Adjust based on market conditions
- Keep a trading journal to track performance
- Be willing to modify settings as markets change
Can I save different configurations?
------------------------------------
Yes, save different indicator templates in TradingView for:
- Different trading styles (scalping, swing trading)
- Different market conditions (trending, ranging)
- Different instruments (stocks, forex, crypto)

Adaptive Moving AveragesThe Adaptive Moving Averages indicator stands out with several unique features that set it apart from traditional moving average indicators. Its most remarkable characteristic is the ability to automatically adjust the length of moving averages based on the chosen timeframe. This ensures consistency in analysis regardless of the time scale used, eliminating the need for manual recalculation of appropriate periods for each timeframe. It allows for a more fluid and accurate multi-temporal analysis.
Another innovative aspect is the indicator's consideration of different market types (stocks, forex, crypto). This approach recognizes the fundamental differences between these markets in terms of trading hours, allowing for more precise and representative calculations for each asset class. It offers increased flexibility for traders operating across various markets.
The method for calculating periods for different moving averages (week, month, quarter, semester, year) is particularly sophisticated. It takes into account the specifics of each market, such as trading days and opening hours, automatically adapting to timeframe changes. This ensures a more accurate representation of actual trading periods rather than arbitrary approximations.
The indicator offers a wide choice of moving average types, allowing traders to use their preferred method or compare different approaches. This flexibility adapts to various trading styles and technical analysis strategies, offering the possibility to experiment and find the most effective combination for each market or asset.
In conclusion, this indicator distinguishes itself through its ability to intelligently adapt to different trading contexts, offering a versatile and sophisticated solution for technical analysis. Its flexibility and adaptive approach make it a particularly interesting tool for traders seeking consistent analysis across different markets and time scales.

Dual SMA/EMA BandsThe Dual SMA/EMA Bands indicator provides a clear view of market trends, combining Simple Moving Averages (SMA) and Exponential Moving Averages (EMA) in one customizable tool. Designed for any timeframe, it features Aqua and Purple Bands for 50-period and 200-period averages , respectively, aiding in trend analysis and volatility insights.
Features:
Adaptive Timeframes : Automatically aligns with the chart’s timeframe or can be manually set for cross-timeframe analysis.
Customization : Offers easy adjustments for colors, line thickness, and opacity to suit personal preferences and enhance readability.
Insights : Facilitates trend confirmation and volatility assessment, essential for informed trading decisions.
Usage Tips:
Use the bands to gauge market direction; above the bands suggests bullish conditions, below them indicates bearish trends.
The gap between EMA and SMA within each band can signal market volatility.
Apply customizable timeframes for a comprehensive market overview.
Conclusion:
With its straightforward setup and versatile application, the Dual SMA/EMA Bands indicator is a valuable tool for traders looking to deepen their market analysis and uncover trading opportunities.

Triple Moving Averages + RSI Divergence + Trade Creator [CSJ7]This indicator uses triple moving averages to identify the prevailing trend, and calculates the linear regression of the closing price, and of the RSI, to either confirm the current trend direction, or to identify a potential trade reversal. Additionally, it includes a trade management tool that allows you to rate your trade setup according to your selected entry minimums and preferences, plus you obtain an estimated P&L with profitability metrics of your trade.
The key features are:
Dashboard : Includes entry/exit amounts, prices, quantities, estimated Profit & Loss, ROI, ROE, RRR, insights into market trends, entry conditions, and operational logs.
Trade Setup : Allows you to design your trade in detail. Select entry/exit levels, and let the tool suggest optimal target levels based on your ROI and RRR preferences. Specify your desired stop-loss type, and the tool will present the corresponding price.
Entry Conditions Management : Customize your trade entry prerequisites within the settings. The system evaluates these, offering a Trade Rating and displaying current values and entry statuses in the Entry Conditions table.
Trade Box : Visualize your trade strategy with a trade box that shows in alongside your chart, highlighting potential profit/loss zones and entry price points.
RSI & Close Price Linear Regressions : Calculates the linear regression of RSI and the close prices, since the beginning of the current trend, and presents them directly in the chart and alongside the active trend, to allow you to spot a potential trend continuation or reversal.
Adaptive price levels : The tool calculates the viability, trade rating and P&L based on contextual levels, like moving averages and highest or lowest prices, instead of using fixed prices; this allows for the results to adapt dynamically to market fluctuations, eliminating the need for manual recalibrations and adjustments.
Automatic Trade Side Detection : While manual input is available, the tool can intuitively determine the optimal trade side based on current data.
Market Outlook Events : By using the crossings of the three averages, the tool keeps track of the evolution of the current trend, providing points of interest like when the initial momentum is observed, when the trend initiates, when a potential entry zone starts, when a buy or sell opportunity arises and when the trend ends.
Alerts : You can set up two distinct alerts – one notifies on trend milestones and another for trade initiation conditions. Note: Manual activation is required in the Tradingview dashboard.
Logs : The tool provides a log section where you can find relevant information regarding the operation and any encountered errors via the dashboard's log section.
Usage
Choose your desired ticker and timeframe. If a tradable trend is detected and levels are set correctly, the trade box appears. Incorrect levels will trigger a warning in the error logs.
The tool will suggest the logical trade side, but manual adjustments are possible.
Customize ROI, maximum loss, and RRR in the settings. When in 'Auto', the tool will calculate the target price accordingly.
Adjust leverage to align with your risk and reward parameters.
View linear regressions for trend analysis and spotting RSI divergences.
Manage position sizing and risk in the settings, accounting for broker/exchange fees.
Activate alerts for trade notifications.
Enable 'Show Trade Levels' in settings to get the details of the necessary limit orders for the trade.
In the image below, you can view the expanded Trade Creator Dashboard, the Trade Box, and the Linear Regression Lines:
The linear regression lines are colored red when trending downward and green when trending upward.
The labels displaying information related to the entry and exit prices can be hidden, as demonstrated in the image above.

VWAP + 2 Moving Averages + RSI + Buy and SellIndicator: VWAP + 2 Moving Averages + RSI + Buy and Sell
Buy and Sell Arrows (Great for use alone or in conjunction with other scripts on the chart)
This indicator displays BUY (BUY) and SELL (SELL) arrows on the chart based on a combination of moving averages, VWAP and RSI. Arrows are a visual way to identify trading opportunities and can be useful for traders who want to follow a strategy based on these conditions.
The indicator uses two moving averages (20 and 50 periods) to identify upward crosses (buy) and downward crosses (sell). In addition, it takes into account VWAP (Volume Weighted Average Price) and RSI (Relative Strength Index) as additional filters to confirm buy and sell signals.
This script is great for use both independently and in conjunction with other indicators and strategies. You can combine it with other indicators and customize it to your preferences to create a more comprehensive trading strategy.
Please remember that this indicator is provided for educational purposes only and does not constitute financial advice. It is always recommended to carry out a thorough analysis before making any trading decisions.
Give this indicator a try and enjoy clear visualization of buy and sell arrows on your chart. Happy trading!

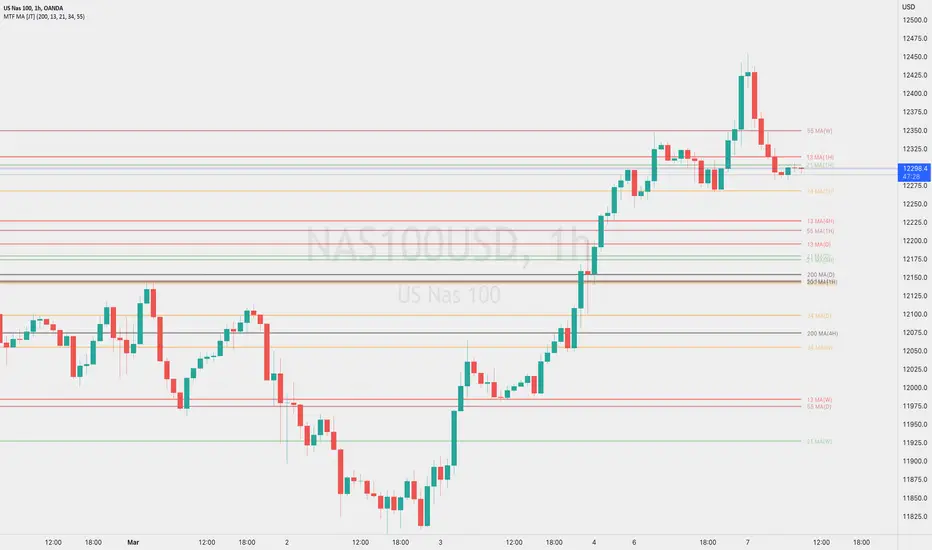
Multi Timeframe Moving AveragesThis indicator is designed to help traders analyze market trends by displaying five exponential moving averages (EMA) of their choice across four fixed intervals: weekly, daily, 4-hourly, and hourly.
The user can choose which moving averages and intervals to display, and can enable or disable these options as needed. The moving averages are drawn as lines and are updated in real-time based on the current EMA values in the respective intervals.
This indicator can help traders identify potential areas of support and resistance, as well as identify trends in the market. By displaying multiple EMAs across multiple time intervals, traders can get a more complete picture of the market and make more informed trading decisions.
[E5 Trading] Moving AveragesMoving Averages
Plot up to 12 moving averages and customize colors directly on the inputs tab.
Select from any of one of eight (8) moving averages types from the drop-down menu including 'EMA', 'HMA', 'LINREG', 'SWMA', 'SINE', 'SMA', 'VWMA', and 'WMA'.
Default 'SMA' for Plots 1 through 6, and default 'EMA' for plots 7 through 12.
Use this indicator to quickly transition between your favorite moving average combinations.
This indicator can also be used to create the Guppy Multiple Moving Average: www.investopedia.com
Definitions
'EMA' = Exponential Moving Average
'HMA' = Hull Moving Average
'LINREG' = Linear Regression Curve
'SWMA' = Symmetrically Weighted Moving Average
'SINE' = Sine Weighted Moving Average
'SMA' = Simple Moving Average
'VWMA' = Volume Weighted Moving Average
'WMA' = Weighted Moving Average

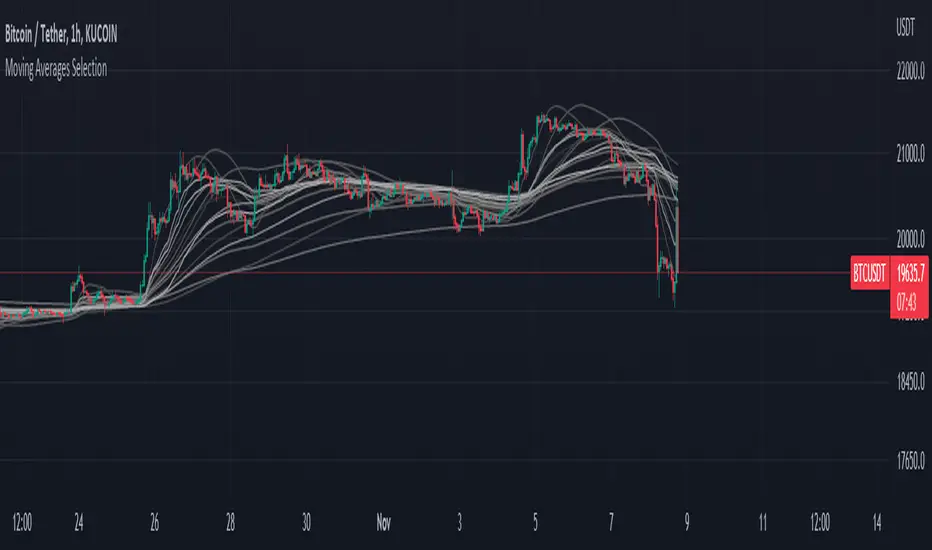
Moving Averages SelectionHello everyone, I present my first script. In it I collect a group of fully configurable moving averages, both in color, value and selection of the ones we want to observe.
The moving averages I collect are 3 of each of the following types:
EMA: An exponential moving average ( EMA ) is a type of moving average (MA) that places a greater weight and significance on the most recent data points.
SMA: It is simply the average price over the specified period. The average is called "moving" because it is plotted on the chart bar by bar, forming a line that moves along the chart as the average value changes.
HMA: The Hull Moving Average ( HMA ) attempts to minimize the lag of a traditional moving average while retaining the smoothness of the moving average line. Developed by Alan Hull in 2005, this indicator makes use of weighted moving averages to prioritize more recent values and greatly reduce lag.
RMA: The Rolling Moving Average, sometimes referred to as "Smoothed Moving Average", gives the recent prices most weighting, though the historic prices are also weighted, each given less weighting further back in time.
WMA: The weighted moving average ( WMA ) is a technical indicator that traders use to generate trade direction and make a buy or sell decision. It assigns greater weighting to recent data points and less weighting on past data points.
I am open to any opinion and advice for improvement, greetings, I hope you find it useful :)