2/20 Exponential Moving Average Backtest Strategy
This indicator plots 2/20 exponential moving average. For the Mov
Avg X 2/20 Indicator, the EMA bar will be painted when the Alert criteria is met.
You can use in the xPrice any series: Open, High, Low, Close, HL2, HLC3, OHLC4 and ect...
You can change long to short in the Input Settings
Please, use it only for learning or paper trading. Do not for real trading.
Cari dalam skrip untuk "backtest"

Historical Volatility Strategy Backtest Strategy buy when HVol above BuyBand and close position when HVol below CloseBand.
Markets oscillate from periods of low volatility to high volatility
and back. The author`s research indicates that after periods of
extremely low volatility, volatility tends to increase and price
may move sharply. This increase in volatility tends to correlate
with the beginning of short- to intermediate-term moves in price.
They have found that we can identify which markets are about to make
such a move by measuring the historical volatility and the application
of pattern recognition.
The indicator is calculating as the standard deviation of day-to-day
logarithmic closing price changes expressed as an annualized percentage.
Please, use it only for learning or paper trading. Do not for real trading.

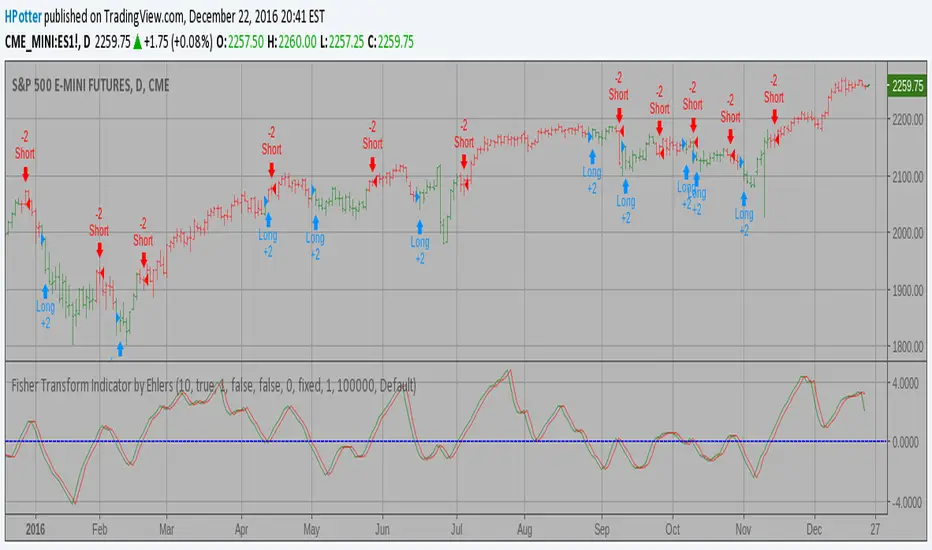
Fisher Transform Indicator by Ehlers Backtest v 2.0 Market prices do not have a Gaussian probability density function
as many traders think. Their probability curve is not bell-shaped.
But trader can create a nearly Gaussian PDF for prices by normalizing
them or creating a normalized indicator such as the relative strength
index and applying the Fisher transform. Such a transformed output
creates the peak swings as relatively rare events.
Fisher transform formula is: y = 0.5 * ln ((1+x)/(1-x))
The sharp turning points of these peak swings clearly and unambiguously
identify price reversals in a timely manner.
For signal used zero.
You can change long to short in the Input Settings
Please, use it only for learning or paper trading. Do not for real trading.
High - EMA Strategy Backtest This indicator plots the difference between the High (of the previous period)
and an exponential moving average (13 period) of the Close (of the previous period).
You can use in the xPrice any series: Open, High, Low, Close, HL2, HLC3, OHLC4 and ect...
It buy if indicator above 0 and sell if below.
You can change long to short in the Input Settings
Please, use it only for learning or paper trading. Do not for real trading.

FX Sniper: T3-CCI Strategy Backtest This simple indicator gives you a lot of useful information - when to enter, when to exit
and how to reduce risks by entering a trade on a double confirmed signal.
You can use in the xPrice any series: Open, High, Low, Close, HL2, HLC3, OHLC4 and ect...
You can change long to short in the Input Settings
Please, use it only for learning or paper trading. Do not for real trading.

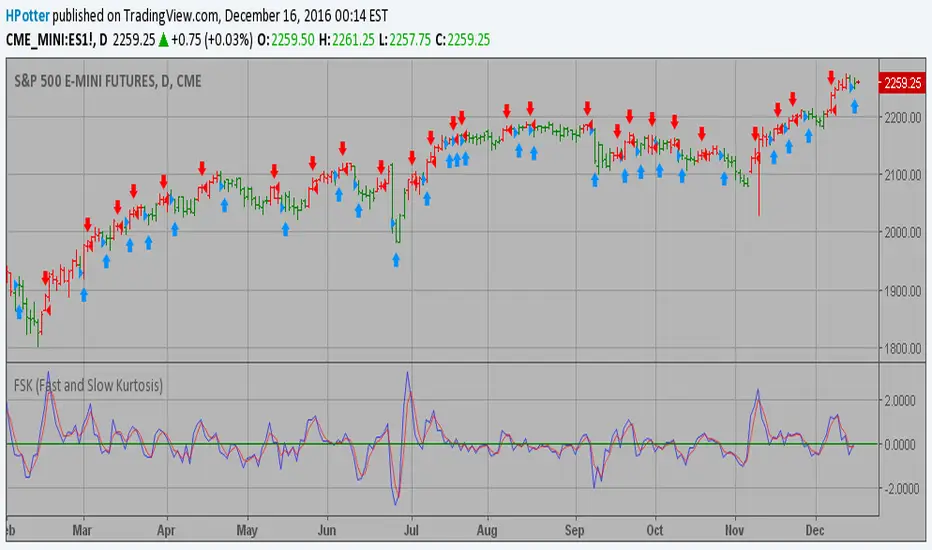
FSK (Fast and Slow Kurtosis) Backtest This indicator plots the Fast & Slow Kurtosis. The Kurtosis is a market
sentiment indicator. The Kurtosis is constructed from three different parts.
The Kurtosis, the Fast Kurtosis(FK), and the Fast/Slow Kurtosis(FSK).
You can change long to short in the Input Settings
Please, use it only for learning or paper trading. Do not for real trading.
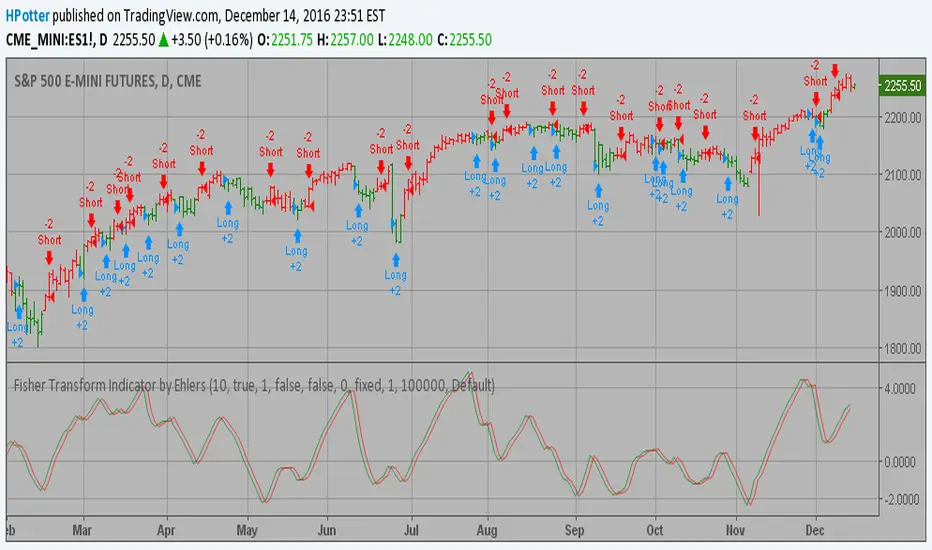
Fisher Transform Indicator by Ehlers Backtest Market prices do not have a Gaussian probability density function
as many traders think. Their probability curve is not bell-shaped.
But trader can create a nearly Gaussian PDF for prices by normalizing
them or creating a normalized indicator such as the relative strength
index and applying the Fisher transform. Such a transformed output
creates the peak swings as relatively rare events.
Fisher transform formula is: y = 0.5 * ln ((1+x)/(1-x))
The sharp turning points of these peak swings clearly and unambiguously
identify price reversals in a timely manner.
You can change long to short in the Input Settings
Please, use it only for learning or paper trading. Do not for real trading.
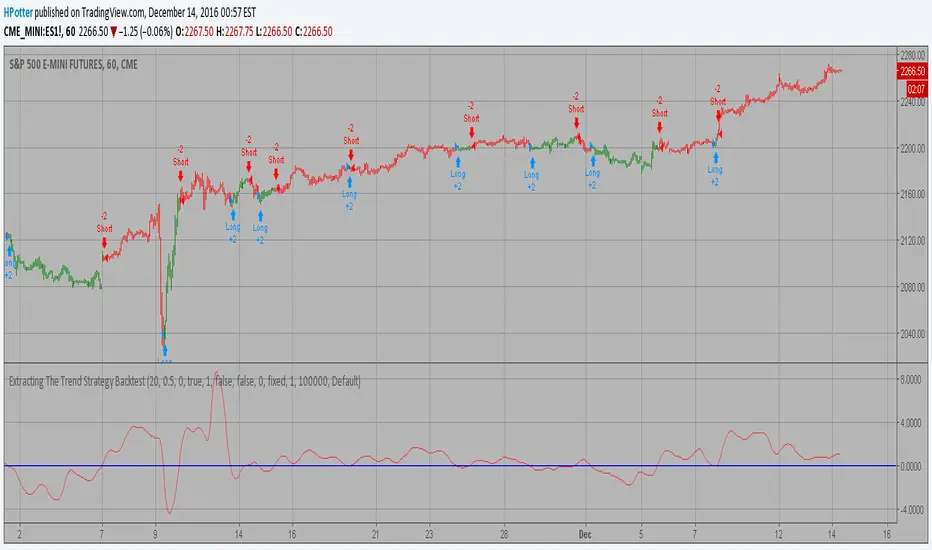
Extracting The Trend Strategy Backtest The related article is copyrighted material from Stocks & Commodities Mar 2010
You can use in the xPrice any series: Open, High, Low, Close, HL2, HLC3, OHLC4 and ect...
You can change long to short in the Input Settings
Please, use it only for learning or paper trading. Do not for real trading.
Ergotic TSI Strategy Backtest r - Length of first EMA smoothing of 1 day momentum 4
s - Length of second EMA smoothing of 1 day smoothing 8
u- Length of third EMA smoothing of 1 day momentum 6
Length of EMA signal line 3
Source of Ergotic TSI Close
This is one of the techniques described by William Blau in his book "Momentum,
Direction and Divergence" (1995). If you like to learn more, we advise you to
read this book. His book focuses on three key aspects of trading: momentum,
direction and divergence. Blau, who was an electrical engineer before becoming
a trader, thoroughly examines the relationship between price and momentum in
step-by-step examples. From this grounding, he then looks at the deficiencies
in other oscillators and introduces some innovative techniques, including a
fresh twist on Stochastics. On directional issues, he analyzes the intricacies
of ADX and offers a unique approach to help define trending and non-trending periods.
You can use in the xPrice any series: Open, High, Low, Close, HL2, HLC3, OHLC4 and ect...
You can change long to short in the Input Settings
Please, use it only for learning or paper trading. Do not for real trading.

Ergotic MACD Strategy Backtest This is one of the techniques described by William Blau in his book
"Momentum, Direction and Divergence" (1995). If you like to learn more,
we advise you to read this book. His book focuses on three key aspects
of trading: momentum, direction and divergence. Blau, who was an electrical
engineer before becoming a trader, thoroughly examines the relationship
between price and momentum in step-by-step examples. From this grounding,
he then looks at the deficiencies in other oscillators and introduces some
innovative techniques, including a fresh twist on Stochastics. On directional
issues, he analyzes the intricacies of ADX and offers a unique approach to help
define trending and non-trending periods.
Blau`s indicator is like usual MACD, but it plots opposite of meaningof
stndard MACD indicator.
You can change long to short in the Input Settings
Please, use it only for learning or paper trading. Do not for real trading.

Elder Ray (Bull Power) Strategy Backtest Developed by Dr Alexander Elder, the Elder-ray indicator measures buying
and selling pressure in the market. The Elder-ray is often used as part
of the Triple Screen trading system but may also be used on its own.
Dr Elder uses a 13-day exponential moving average (EMA) to indicate the
market consensus of value. Bull Power measures the ability of buyers to
drive prices above the consensus of value. Bear Power reflects the ability
of sellers to drive prices below the average consensus of value.
Bull Power is calculated by subtracting the 13-day EMA from the day's High.
Bear power subtracts the 13-day EMA from the day's Low.
You can use in the xPrice any series: Open, High, Low, Close, HL2, HLC3, OHLC4 and ect...
You can change long to short in the Input Settings
Please, use it only for learning or paper trading. Do not for real trading.

ECO Strategy Backtest We call this one the ECO for short, but it will be listed on the indicator list
at W. Blau’s Ergodic Candlestick Oscillator. The ECO is a momentum indicator.
It is based on candlestick bars, and takes into account the size and direction
of the candlestick "body". We have found it to be a very good momentum indicator,
and especially smooth, because it is unaffected by gaps in price, unlike many other
momentum indicators.
We like to use this indicator as an additional trend confirmation tool, or as an
alternate trend definition tool, in place of a weekly indicator. The simplest way
of using the indicator is simply to define the trend based on which side of the "0"
line the indicator is located on. If the indicator is above "0", then the trend is up.
If the indicator is below "0" then the trend is down. You can add an additional
qualifier by noting the "slope" of the indicator, and the crossing points of the slow
and fast lines. Some like to use the slope alone to define trend direction. If the
lines are sloping upward, the trend is up. Alternately, if the lines are sloping
downward, the trend is down. In this view, the point where the lines "cross" is the
point where the trend changes.
When the ECO is below the "0" line, the trend is down, and we are qualified only to
sell on new short signals from the Hi-Lo Activator. In other words, when the ECO is
above 0, we are not allowed to take short signals, and when the ECO is below 0, we
are not allowed to take long signals.
You can change long to short in the Input Settings
Please, use it only for learning or paper trading. Do not for real trading.

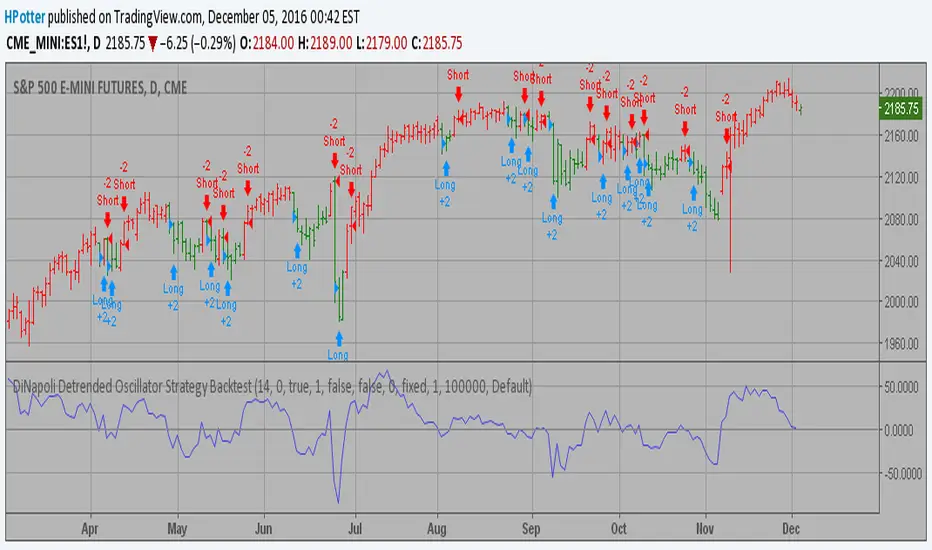
DiNapoli Detrended Oscillator Strategy Backtest DiNapoli Detrended Oscillator Strategy
You can change long to short in the Input Settings
Please, use it only for learning or paper trading. Do not for real trading.
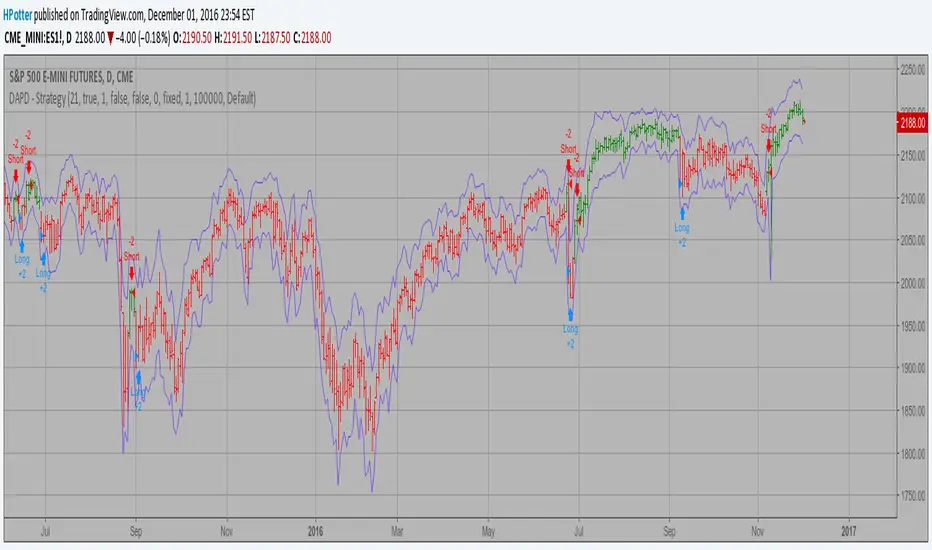
DAPD - Strategy Backtest This indicator is similar to Bollinger Bands. It based on DAPD - Daily
Average Price Delta. DAPD is based upon a summation for each of the
highs (hod) for the 21 days prior to today minus the summation for
each of the lows (lod) for the last 21 days prior to today. The result
of this calculation would then be divided by 21.
It will be buy when high above previos DAPD high and sell if low below previos DAPD low
You can change long to short in the Input Settings
Please, use it only for learning or paper trading. Do not for real trading.
Chaikin Volatility Strategy Backtest Chaikin's Volatility indicator compares the spread between a security's
high and low prices. It quantifies volatility as a widening of the range
between the high and the low price.
You can use in the xPrice1 and xPrice2 any series: Open, High, Low, Close, HL2,
HLC3, OHLC4 and ect...
You can change long to short in the Input Settings
Please, use it only for learning or paper trading. Do not for real trading.

CCI Strategy Reversed Backtest The Commodity Channel Index (CCI) is best used with markets that display cyclical or
seasonal characteristics, and is formulated to detect the beginning and ending of these
cycles by incorporating a moving average together with a divisor that reflects both possible
and actual trading ranges. The final index measures the deviation from normal, which indicates
major changes in market trend.
To put it simply, the Commodity Channel Index (CCI) value shows how the instrument is trading
relative to its mean (average) price. When the CCI value is high, it means that the prices are
high compared to the average price; when the CCI value is down, it means that the prices are low
compared to the average price. The CCI value usually does not fall outside the -300 to 300 range
and, in fact, is usually in the -100 to 100 range.
You can change long to short in the Input Settings
Please, use it only for learning or paper trading. Do not for real trading.

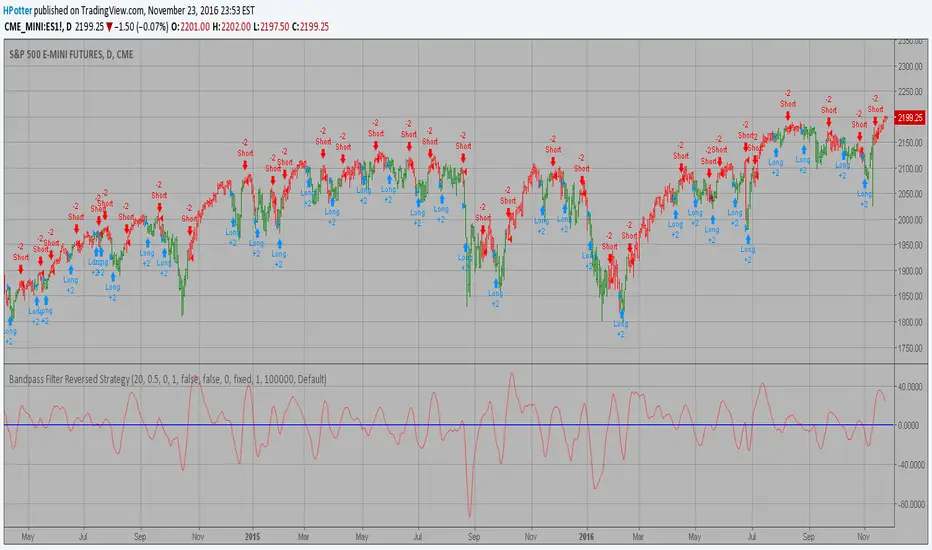
Bandpass Filter Reversed Strategy BacktestThe related article is copyrighted material from
Stocks & Commodities Mar 2010
You can use in the xPrice any series: Open, High, Low, Close, HL2, HLC3, OHLC4 and ect...
Please, use it only for learning or paper trading. Do not for real trading.
3-Bar-Reversal-Pattern Strategy Backtest This startegy based on 3-day pattern reversal described in "Are Three-Bar
Patterns Reliable For Stocks" article by Thomas Bulkowski, presented in
January, 2000 issue of Stocks&Commodities magazine.
That pattern conforms to the following rules:
- It uses daily prices, not intraday or weekly prices;
- The middle day of the three-day pattern has the lowest low of the three days, with no ties allowed;
- The last day must have a close above the prior day's high, with no ties allowed;
- Each day must have a nonzero trading range.
Please, use it only for learning or paper trading. Do not for real trading.

BLANK Strategy + TSL + Backtestrange- I often see ppl struggeling do the first own strategy
- this is an example, for a smooth start
- EDIT it to your needs ( DELET my EXAMPELS and add your INPUTS/CONDITIONS)
- i added also a Backtestrange, so you can test your Strategy in different marketphases
- also added a trailing-stop-loss

ORB Strategy + Backtesting (fixed timestamp) - Lines Adjusted⚡ ORB Strategy + Backtesting (Pine Script v5)
This script implements a complete Opening Range Breakout (ORB) strategy, featuring built-in backtesting, advanced TP/SL visualization, full style customization, and a performance dashboard. It is designed for traders who want to clearly evaluate breakout performance directly on the chart.
🕑 ORB Window Configuration
🔹 Session selection: choose between Market Timezone or Custom Session.
🔹 Timezone support: configurable from UTC-8 to UTC+12.
🔹 Daily limit: option to allow only one trade per day.
🔹 Risk/Reward (RR) settings:
Configurable TP1, TP2, and TP3 levels.
Stop Loss calculated dynamically from the ORB range.
📊 Backtesting Engine
🔹 Interactive dashboard showing trades, wins, losses, and win rate.
🔹 Adjustable partial exits for each TP (TP1, TP2, TP3).
🔹 Automatic calculation of percentage-based profit and loss.
🔹 Tracks total trades, total profit, and average profit per trade.
🎨 Visual Customization
🔹 Fully customizable colors:
ORB high/low lines and range fill.
Buy/Sell entry labels.
TP and SL lines with background zones.
🔹 Line style and thickness options (solid, dotted, dashed).
🔹 Visibility controls for each TP/SL level.
🔹 Clear profit and loss zones drawn directly on the chart.
🚀 Trading Logic
🔹 LONG entries: triggered when price breaks above the ORB high.
🔹 SHORT entries: triggered when price breaks below the ORB low.
🔹 Automatic calculation of Stop Loss and TP1, TP2, TP3 based on ORB range and RR.
🔹 Customizable BUY / SELL labels displayed at entry.
✅ TP / SL Detection
🔹 Real-time detection of TP1, TP2, TP3, and SL hits.
🔹 Prevents double counting of the same level.
🔹 Extended TP/SL lines with shaded zones for better clarity.
📈 Backtesting Dashboard
🔹 Displayed in the top-right corner of the chart.
🔹 Shows:
Total trades
Wins / Losses
Win rate (%)
Total profit (%)
Average profit per trade
🔹 Fully customizable panel color.
✨ Summary
This script combines:
Opening Range detection
Breakout trading logic with advanced risk management
Professional-grade visualizations
Integrated historical performance tracking
High customization for sessions, styles, and colors
💡 Ideal for traders who want to trade ORB setups with clarity, structure, and measurable results.

Custom XABCD Validation and Backtesting ToolOverview:
We hear a lot about Gartleys, bats, crabs and the rest of the barnyard crew, but have you ever wondered what other creatures might be lurking out there yet to be discovered? Well wonder no longer, it's time to find out for yourself! The Custom XABCD Validation and Backtesting Tool allows you to define retracement ratios and targets for your very own patterns.
Tips:
(1) Adjust the patterns entry/stop/target configuration and see how it affects the pattern's backtesting results.
(2) Adjust the weights of pattern score components (% error, PRZ confluence, Point D/PRZ confluence), along with the entry minimum score requirements ('If score is above'), and see how it affects the patterns' results.
Pattern Scoring:
The pattern's score is an attempt to represent the quality of a pattern with a single metric. This is one of the most powerful aspects of the tool because it can quickly tell you whether a trade is worth entering. The score is based on 3 components:
(1) Retracement % Accuracy - this measures how closely a pattern's retracement ratios match your defined theoretical values. You can change the "Allowed ratio error %" in Settings to be more or less inclusive.
(2) PRZ Level Confluence - Potential Reversal Zone levels are retracements of the XA, BC, and/or XC legs. These levels indicate where a potential reversal might occur (i.e. pivot point D). The PRZ Level Confluence component measures the closeness of the two closest PRZ levels, relative to the height of the of the XA leg.
(3) Point D / PRZ Confluence - this measures the closeness of point D to either of the two closest PRZ levels (identified in the PRZ Level Confluence component above), relative to the height of the XA leg. In theory, the closer together these levels are, the higher the probability of a reversal.
While the score is percentage-based, it should not be confused with a probability. A score of 96% does not imply a 96% chance of success. It simply represents the average of the three components mentioned above, weighted according to the defined weight parameters. A score of 100% would mean that (1) all leg retracements match the defined theoretical retracement ratios exactly, (2) all PRZ retracement levels are exactly the same value, and (3) pivot point D occurred exactly at the confluent PRZ level.
Pattern scoring research has been ongoing since I introduced the concept with my Harmonic Pattern Detection, Prediction and Backtesting Tool (see below). So the way that the score is calculated is subject to change based on the results of that research.

TEMA Cross +HTF BacktestThis is a follow up to a previous script release called " TEMA Cross Backtest ".
This new strategy uses two TEMA crosses, one for trend direction, one for entry and exit. The entry and exit parameters are the same as the previous script. The trend direction is based on a user configurable higher timeframe TEMA cross which determines when to take longs or shorts. When the indicator is purple, it is looking for shorts, and when it is yellow, it is looking for longs. The background of the chart is colored accordingly to see the trend direction at a glance.
The default settings are the ones I have found produce the highest backtest results. The backtest is set by default to use a $500 account, and use $500 for every entry and exit, no matter the direction or overall profit/loss.
Parts of script borrowed from other public scripts.

Strategy Stats [presentTrading]Hello! it's another weekend. This tool is a strategy performance analysis tool. Looking at the TradingView community, it seems few creators focus on this aspect. I've intentionally created a shared version. Welcome to share your idea or question on this.
█ Introduction and How it is Different
Strategy Stats is a comprehensive performance analytics framework designed specifically for trading strategies. Unlike standard strategy backtesting tools that simply show cumulative profits, this analytics suite provides real-time, multi-timeframe statistical analysis of your trading performance.
Multi-timeframe analysis: Automatically tracks performance metrics across the most recent time periods (last 7 days, 30 days, 90 days, 1 year, and 4 years)
Advanced statistical measures: Goes beyond basic metrics to include Information Coefficient (IC) and Sortino Ratio
Real-time feedback: Updates performance statistics with each new trade
Visual analytics: Color-coded performance table provides instant visual feedback on strategy health
Integrated risk management: Implements sophisticated take profit mechanisms with 3-step ATR and percentage-based exits
BTCUSD Performance
The table in the upper right corner is a comprehensive performance dashboard showing trading strategy statistics.
Note: While this presentation uses Vegas SuperTrend as the underlying strategy, this is merely an example. The Stats framework can be applied to any trading strategy. The Vegas SuperTrend implementation is included solely to demonstrate how the analytics module integrates with a trading strategy.
⚠️ Timeframe Limitations
Important: TradingView's backtesting engine has a maximum storage limit of 10,000 bars. When using this strategy stats framework on smaller timeframes such as 1-hour or 2-hour charts, you may encounter errors if your backtesting period is too long.
Recommended Timeframe Usage:
Ideal for: 4H, 6H, 8H, Daily charts and above
May cause errors on: 1H, 2H charts spanning multiple years
Not recommended for: Timeframes below 1H with long history
█ Strategy, How it Works: Detailed Explanation
The Strategy Stats framework consists of three primary components: statistical data collection, performance analysis, and visualization.
🔶 Statistical Data Collection
The system maintains several critical data arrays:
equityHistory: Tracks equity curve over time
tradeHistory: Records profit/loss of each trade
predictionSignals: Stores trade direction signals (1 for long, -1 for short)
actualReturns: Records corresponding actual returns from each trade
For each closed trade, the system captures:
float tradePnL = strategy.closedtrades.profit(tradeIndex)
float tradeReturn = strategy.closedtrades.profit_percent(tradeIndex)
int tradeType = entryPrice < exitPrice ? 1 : -1 // Direction
🔶 Performance Metrics Calculation
The framework calculates several key performance metrics:
Information Coefficient (IC):
The correlation between prediction signals and actual returns, measuring forecast skill.
IC = Correlation(predictionSignals, actualReturns)
Where Correlation is the Pearson correlation coefficient:
Correlation(X,Y) = (nΣXY - ΣXY) / √
Sortino Ratio:
Measures risk-adjusted return focusing only on downside risk:
Sortino = (Avg_Return - Risk_Free_Rate) / Downside_Deviation
Where Downside Deviation is:
Downside_Deviation = √
R_i represents individual returns, T is the target return (typically the risk-free rate), and n is the number of observations.
Maximum Drawdown:
Tracks the largest percentage drop from peak to trough:
DD = (Peak_Equity - Trough_Equity) / Peak_Equity * 100
🔶 Time Period Calculation
The system automatically determines the appropriate number of bars to analyze for each timeframe based on the current chart timeframe:
bars_7d = math.max(1, math.round(7 * barsPerDay))
bars_30d = math.max(1, math.round(30 * barsPerDay))
bars_90d = math.max(1, math.round(90 * barsPerDay))
bars_365d = math.max(1, math.round(365 * barsPerDay))
bars_4y = math.max(1, math.round(365 * 4 * barsPerDay))
Where barsPerDay is calculated based on the chart timeframe:
barsPerDay = timeframe.isintraday ?
24 * 60 / math.max(1, (timeframe.in_seconds() / 60)) :
timeframe.isdaily ? 1 :
timeframe.isweekly ? 1/7 :
timeframe.ismonthly ? 1/30 : 0.01
🔶 Visual Representation
The system presents performance data in a color-coded table with intuitive visual indicators:
Green: Excellent performance
Lime: Good performance
Gray: Neutral performance
Orange: Mediocre performance
Red: Poor performance
█ Trade Direction
The Strategy Stats framework supports three trading directions:
Long Only: Only takes long positions when entry conditions are met
Short Only: Only takes short positions when entry conditions are met
Both: Takes both long and short positions depending on market conditions
█ Usage
To effectively use the Strategy Stats framework:
Apply to existing strategies: Add the performance tracking code to any strategy to gain advanced analytics
Monitor multiple timeframes: Use the multi-timeframe analysis to identify performance trends
Evaluate strategy health: Review IC and Sortino ratios to assess predictive power and risk-adjusted returns
Optimize parameters: Use performance data to refine strategy parameters
Compare strategies: Apply the framework to multiple strategies to identify the most effective approach
For best results, allow the strategy to generate sufficient trade history for meaningful statistical analysis (at least 20-30 trades).
█ Default Settings
The default settings have been carefully calibrated for cryptocurrency markets:
Performance Tracking:
Time periods: 7D, 30D, 90D, 1Y, 4Y
Statistical measures: Return, Win%, MaxDD, IC, Sortino Ratio
IC color thresholds: >0.3 (green), >0.1 (lime), <-0.1 (orange), <-0.3 (red)
Sortino color thresholds: >1.0 (green), >0.5 (lime), <0 (red)
Multi-Step Take Profit:
ATR multipliers: 2.618, 5.0, 10.0
Percentage levels: 3%, 8%, 17%
Short multiplier: 1.5x (makes short take profits more aggressive)
Stop loss: 20%
