ETH Signal 15m
This strategy uses the Supertrend indicator combined with RSI to generate buy and sell signals, with stop loss (SL) and take profit (TP) conditions based on ATR (Average True Range). Below is a detailed explanation of each part:
1. General Information BINANCE:ETHUSDT.P
Strategy Name: "ETH Signal 15m"
Designed for use on the 15-minute time frame for the ETH pair.
Default capital allocation is 15% of total equity for each trade.
2. Backtest Period
start_time and end_time: Define the start and end time of the backtest period.
start_time = 2024-08-01: Start date of the backtest.
end_time = 2054-01-01: End date of the backtest.
The strategy will only run when the current time falls within this specified range.
3. Supertrend Indicator
Supertrend is a trend-following indicator that provides buy or sell signals based on the direction of price changes.
factor = 2.76: The multiplier used in the Supertrend calculation (increasing this value makes the Supertrend less sensitive to price movements).
atrPeriod = 12: Number of periods used to calculate ATR.
Output:
direction: Determines the buy/sell direction based on Supertrend.
If direction decreases, it signals a buy (Long).
If direction increases, it signals a sell (Short).
4. RSI Indicator
RSI (Relative Strength Index) is a momentum indicator, often used to identify overbought or oversold conditions.
rsiLength = 12: Number of periods used to calculate RSI.
rsiOverbought = 70: RSI level considered overbought.
rsiOversold = 30: RSI level considered oversold.
5. Entry Conditions
Long Entry:
Supertrend gives a buy signal (ta.change(direction) < 0).
RSI must be below the overbought level (rsi < rsiOverbought).
Short Entry:
Supertrend gives a sell signal (ta.change(direction) > 0).
RSI must be above the oversold level (rsi > rsiOversold).
The strategy will only execute trades if the current time is within the backtest period (in_date_range).
6. Stop Loss (SL) and Take Profit (TP) Conditions
ATR (Average True Range) is used to calculate the distance for Stop Loss and Take Profit based on price volatility.
atr = ta.atr(atrPeriod): ATR is calculated using 12 periods.
Stop Loss and Take Profit are calculated as follows:
Long Trade:
Stop Loss: Set at close - 4 * atr (current price minus 4 times the ATR).
Take Profit: Set at close + 2 * atr (current price plus 2 times the ATR).
Short Trade:
Stop Loss: Set at close + 4 * atr (current price plus 4 times the ATR).
Take Profit: Set at close - 2.237 * atr (current price minus 2.237 times the ATR).
Summary:
This strategy enters a Long trade when the Supertrend indicates an upward trend and RSI is not in the overbought region. Conversely, a Short trade is entered when Supertrend signals a downtrend, and RSI is not oversold.
The trade is exited when the price reaches the Stop Loss or Take Profit levels, which are determined based on price volatility (ATR).
Disclaimer:
The content provided in this strategy is for informational and educational purposes only. It is not intended as financial, investment, or trading advice. Trading in cryptocurrency, stocks, or any financial markets involves significant risk, and you may lose more than your initial investment. Past performance is not indicative of future results, and no guarantee of profit can be made. You should consult with a professional financial advisor before making any investment decisions. The creator of this strategy is not responsible for any financial losses or damages incurred as a result of following this strategy. All trades are executed at your own risk.
Cari dalam skrip untuk "backtest"

Advanced Trend Strategy [BITsPIP]The BITsPIP team is super excited to share our latest trading gem with you all. We're all about diving deep and ensuring our strategies can stand the test of time. So, we invite you to join us in exploring the awesome potential of this new strategy and really put it through its pace with some deep backtesting. This isn't just another strategy; it boasts a profit factor hovering around 1.5 across over 1000 trades, which is quite an achievement. Consider integrating it with your trading bots to further enhance your trading efficiency and profit generation. Curious? Ask for trial access or drop by our website for more details.
I. Deep Backtesting
We're all in on transparency and solid results, which is why we didn't stop at 100... or even 500 trades. We went over 1000, making sure this strategy is as robust as they come. No flimsy forecasts or sneaky repainting here. Just good, solid strategy that's ready for the real deal. Curious about the details? Check out our detailed backtesting screenshot for the BINANCE:BTCUSDT in a 5-minute timeframe. It's all about giving you the clear picture.
#No Overfitting
#No Repainting
Backtesting Screenshot
II. Algorithmic Trading
Thinking of trading as a manual game? Think again! Manual trading is a bit like rolling the dice - fun, but kind of risky if you're aiming for consistent wins. Instead, why not lean into the future with algorithmic trading? It's all about trusting the market's rhythm over the long term. By integrating your strategy with a trading bot, you can enjoy peace of mind, rest easy, and keep those emotional trades at bay.
III) Applications
Dive into the Advanced Trend Strategy, your versatile tool for navigating the market's waters. This strategy shines in under an hour timeframes, offering adaptability across stocks, commodities, forex, and cryptocurrencies. Initially fine-tuned for low-volatility cryptos like BINANCE:BTCUSDT , its default settings are a solid starting point.
But here's where your expertise comes into play. Each market beats to its own drum, necessitating nuanced adjustments to stop loss and take profit settings. This customization is key to maximizing the strategy's effectiveness in your chosen arena.
IV) Strategy's Logic
The Advanced Trend Strategy is a powerhouse, blending the precision of Hull Suite, RSI, and our unique trend detector technique. At its core, it’s designed for savvy risk management, aiming to lock in substantial profits while steering clear of minor market ripples. It utilizes stop-loss and take-profit thresholds to form a profit channel, providing a safety net for each trade. This is a trend-following strategy at heart, where these profit channels play a critical role in maximizing returns by securing positions within these "warranty channels."
1. Trend-Following
The market's complexity, influenced by countless factors, makes small movements seem almost chaotic. Yet, the principle of #Trend-Following shines in less volatile markets in long term. The strategy excels by pinpointing the ideal moments to enter the market, coupled with refined risk management to secure profits. It’s tailored for you, the individual trader, enabling you to ride the waves of market trends upwards or downwards.
2. Risk Management
A key facet of the strategy is its emphasis on pragmatic risk management. Traders are empowered to establish practical stop-loss and take-profit levels, tailoring these crucial parameters to the specific market they are engaging in. This customization is instrumental in optimizing long-term profitability, ensuring that the strategy adapts fluidly to the unique characteristics and volatility patterns of different trading environments.
V) Strategy's Input Settings and Default Values
1. Alerts
The strategy comes equipped with a flexible alert system designed to keep you informed and ready to act. Within the settings, you’ll find options to configure order/exit and comment/alert messages to your preference. This feature is particularly useful for staying on top of the strategy’s activities without constant manual oversight.
2. Hull Suite
i. Hull Suite Length: Designed for capturing long-term trends, the Hull Suite Length is configured at 1000. Functioning comparably to moving averages, the Hull Suite features upper and lower bands. Currently, it is set to 1000.
ii. Length Multiplier: It's advisable to maintain a minimal value for the Length Multiplier, prioritizing the optimization of the Hull Suite Length. Presently, it is set to 1.
3. RSI Indicator
i. The RSI is a widely recognized tool in trading. Adapt the oversold and overbought thresholds to better match the specifics of your market for optimal results.
4. StopLoss and TakeProfit
i. StopLoss and TakeProfit Settings: Two distinct approaches are available. Semi-Automatic StopLoss/TakeProfit Setting and Manual StopLoss/TakeProfit Setting. The Semi-Automatic mode streamlines the process by allowing you to input values for a 5-minute timeframe, subsequently auto-adjusting these values across various timeframes, both lower and higher. Conversely, the Manual mode offers full control, enabling you to meticulously define TakeProfit values for each individual timeframe.
ii. TakeProfit Threshold # and TakeProfit Value #: Imagine this mechanism as an ascending staircase. Each step represents a range, with the lower boundary (TakeProfit Value) designed to close the trade upon being reached, and the upper boundary (TakeProfit Threshold) upon being hit, propelling the trade to the next level, and forming a new range. This stair-stepping approach enhances risk management and increases profitability. The pre-set configurations are tailored for $BINANCE:BTCUSDT. It's advisable to devote time to tailoring these settings to your specific market, aiming to achieve optimal results based on backtesting.
iii. StopLoss Value: In line with its name, this value marks the limit of loss you're prepared to accept should the market trend go against your expectations. It's crucial to note that once your asset reaches the first TakeProfit range, the initial StopLoss value becomes obsolete, supplanted by the first TakeProfit Value. The default StopLoss value is pegged at 1.6(%), a figure worth considering in your trading strategy.
VI) Entry Conditions
The primary signal for entry is generated by our custom trend detection mechanism and hull suite values (ascending/descending). This is supported by additional indicators acting as confirmation.
VII) Exit Conditions
The strategy stipulates exit conditions primarily governed by stop loss and take profit parameters. On infrequent occasions, if the trend lacks confirmation post-entry, the strategy mandates an exit upon the issuance of a reverse signal (whether confirmed or unconfirmed) by the strategy itself.
BITsPIP

Trend Confirmation StrategyThe profitability and uniqueness of a trading strategy depend on various factors including market conditions, risk management, and the strategy's ability to capitalize on price movements. I'll describe the strategy provided and highlight its potential benefits and differences compared to other strategies:
Strategy Overview:
The provided strategy combines three technical indicators: Supertrend, MACD, and VWAP. It aims to identify potential entry and exit points by confirming trend direction and considering the proximity to the VWAP level. The strategy also incorporates stop-loss and take-profit mechanisms, as well as a trailing stop.
Unique Aspects and Potential Benefits:
Trend Confirmation: The strategy uses both Supertrend and MACD to confirm the trend direction. This dual confirmation can increase the likelihood of accurate trend identification and filter out false signals.
VWAP Confirmation: The strategy considers the proximity of the price to the VWAP level. This dynamic level can act as a support or resistance and provide additional context for entry decisions.
Adaptive Stop Loss: The strategy sets a stop-loss range, which helps provide some tolerance for minor price fluctuations. This adaptive approach considers market volatility and helps prevent premature stop-loss triggers.
Trailing Stop: The strategy incorporates a trailing stop mechanism to lock in profits as the trade moves in the desired direction. This can potentially enhance profitability during strong trends.
Partial Profit Booking: While not explicitly implemented in the provided code, you could consider booking partial profits when the MACD shows a crossover in the opposite direction. This aspect could help secure gains while still keeping exposure to potential further price movements.
Key Differences from Other Strategies:
Dual Indicator Confirmation: The combination of Supertrend and MACD for trend confirmation is a unique aspect of this strategy. It adds an extra layer of filtering to enhance the accuracy of entry signals.
Dynamic VWAP: Incorporating the VWAP level into the decision-making process adds a dynamic element to the strategy. VWAP is often used by institutional traders, and its inclusion can provide insights into the market sentiment.
Adaptive Stop Loss and Trailing: The strategy's use of an adaptive stop-loss range and a trailing stop can help manage risk and protect profits more effectively during changing market conditions.
Partial Profit Booking: The suggestion to consider partial profit booking upon MACD crossovers in the opposite direction is a practical approach to secure gains while staying in the trade.
Caution and Considerations:
Backtesting: Before deploying any strategy in real trading, it's crucial to thoroughly backtest it on historical data to understand its performance under various market conditions.
Risk Management: While the strategy has built-in risk management mechanisms, it's essential to carefully manage position sizes and overall portfolio risk.
Market Conditions: No strategy works well in all market conditions. It's important to be flexible and adjust the strategy or refrain from trading during particularly volatile or unpredictable periods.
Continuous Monitoring: Even though the strategy includes automated components, continuous monitoring of the trades and market conditions is necessary.
Adaptability: Markets can change over time. Traders need to be prepared to adapt the strategy as necessary to stay aligned with evolving market dynamics.

Price action: Trendline Break StrategyThis strategy use trendline to entry. Trendline be drawed from Pivots High/Low.
Entry Long: When price break up trendline.
Entry Short: When price break down trendline.
Risk:Reward setup is 1:1.
You can backtest with whichever pair and whichever timeframe.
I backtested:
- If scalping: should use timeframe 5m, set up SL, TP is 2%.
- If swing trade: should use timeframe 1H, set up SL 2%, TP is 3%.
Should use with other indicator to increase winrate.

Bias Master SystemName: Bias Master System
Category: Bias (Template/Master).
Operating mode: enters and exits at specific times of the day
Trades duration: a few hours, usually intra-day.
Timeframe: 1H.
Suggested usage: in markets where hourly biases are present.
Entry: enters long and short in predefined times, with possibility to manage trend or volatility filters.
Exit: exits in predefined times.
Usage: It can be used in a variety of ways:
- Together with the Bias Analyzer to quickly check the Bias found by the tool. This allows you to create profitable strategies in less than an hour, as an example the starting point with the Analyzer
- The strategy itself can be used to study the market for interesting biases.
- The strategy can be used as a starting code for the development of one's own strategies.
A tutorial with working examples on BTC and ETH is also available and will be provided with the access.
Configuration:
- Long Trades: possibility to specify two long trades configuration and filter them by day of the week, trend or volatility.
- Short Trades: possibility to specify two short trades configuration and filter then by day of the week, trend or volatility.
- Backtest dates: for splitting the available data in develop, test and validation.
- Results table: possibility to specify decimal precision and Dark Mode
Credits:
- QuantNomad for Results Table
Backtesting:
⁃ Exchange: BINANCE
⁃ Pair: ETHUSDTPERP
⁃ Timeframe: 1H
⁃ Fee 0.025%

ATR Trailing Stop advanceHello Traders,
The average true range (ATR) is a technical analysis indicator that measures market volatility . The ATR indicator is easy to use and gives an accurate reading about an ongoing trend that very effective.
I. Signals are used for entry
- Entry your long position (buy) when price crosses above the ATR trailing stop line.
- Entry your short position (sell) when price crosses below the ATR trailing stop line.
II. ATR Trailing Stops Setup
- The ATR period is used to adjust the sensitivity of the ATR trailing stop line. With larger period, the ATR will "smoother" but will signal slower than the price.
- ATR multiplier is a multiple of ATR trailing stop.
- If you want to backtest with trailing take profit, you can tick the box “test with trailing?”. It will affect 2 parameters which are: Trailing point and trailing offset. Where: Trailing Point is the trigger point, the distance from the entry price. Trailing Offset is the take-profit price, which is the distance from the Trailing Point.
III. A few ATR trailing stop configurations, you can use for backtesting:
1. BTC /USDT (M15):
- ATR period: 80
- ATR multiple: 1.91
- Trailing point: 63
- Trailing offset: 10
2. BTC /USDT (M30):
- ATR period: 71
- ATR multiple: 1.63
- Trailing point: 60
- Trailing offset: 10
3. ETH/USDT (M30):
- ATR period: 90
- ATR multiple: 1.81
- Trailing point: 1.12
- Trailing offset: 0.15
4. XRP/USDT (M30):
- ATR period: 125
- ATR multiple: 1.61
- Trailing point: 0.0016
- Trailing offset: 0.0003
IMPORTANT:
Generally, ATR trailing stop still fails in a sideways-moving market. Be Careful and research the strategy before making a buy/sell order.
Hope you enjoy it. We look forward to hearing from you so we can improve this strategy.
Thank you,
CongTrader Strategy V1📈 CongTrader Strategy V1 — Official Overview
CongTrader Strategy V1 is a precision-built algorithm designed for intraday and swing traders who want a structured, rules-driven approach to capturing directional momentum while avoiding low-quality market conditions.
This strategy combines volatility-based logic, trend confirmation filters, and a market-conditioning engine to produce high-probability long and short signals with strictly candle-close confirmed entries (no intrabar repainting).
🔍 Core Philosophy
Modern markets move in bursts of volatility that are often preceded by subtle shifts in momentum and structure.
CongTrader V1 is engineered to:
identify emerging directional pressure early
filter out noise, consolidation, and choppy environments
only execute when multiple conditions align
maintain consistent, disciplined trade management
The result is a strategy that aims to trade quality over quantity, focusing on clear, structured setups rather than impulsive, intrabar signals.
🧠 Key Components (High-Level Explanation)
1️⃣ Directional Signal Engine (Trigger System)
The strategy uses a custom momentum-oscillation model to detect potential turning points and trend continuations.
This engine smooths price action, measures pressure extremes, and generates trigger crossovers that signal potential long or short opportunities.
(The exact formula and coefficients are proprietary and not displayed.)
2️⃣ ATR-Based Risk Management
Each trade is automatically paired with:
a volatility-adaptive stop loss, and
a volatility-adaptive profit target
This allows the strategy to adjust position management dynamically based on current market movement rather than fixed pip or dollar distances.
3️⃣ Trend Confirmation Filter (EMA)
A long-term EMA trend filter prevents counter-trend entries by ensuring:
Long positions trade only above trend
Short positions trade only below trend
This keeps signals aligned with higher-timeframe momentum.
4️⃣ VWAP Institutional Bias Filter
VWAP is used as a dynamic market fair-value reference.
The strategy only trades when price action shows favorable positioning relative to VWAP—helping avoid false moves and mean-reversion traps.
5️⃣ Range & Volatility Filter
A volatility/range filter avoids entering during tight consolidations.
If the market is not moving or lacks range expansion, the strategy waits patiently.
This significantly reduces chop and whipsaw trades.
6️⃣ RTH (Regular Trading Hours) Protection
Optionally limits trades to regular exchange hours for traders who avoid low-liquidity overnight sessions.
⏳ Candle-Close Entry Confirmation (No Repainting)
All entries are strictly confirmed after the bar closes, which means:
No intrabar fakeouts
No signal disappearance
No repainting
Cleaner, more realistic backtesting
This ensures the strategy behaves the same in backtests and in live charts.
🎯 Trade Logic Summary
A trade is only taken when:
✔ A directional trigger signal occurs
✔ Price meets VWAP bias conditions
✔ Price aligns with the long-term trend
✔ Sufficient volatility/range is present
✔ (Optional) Within regular trading hours
✔ The candle has fully confirmed
Every trade is managed automatically with ATR-based stop loss and take profit placement.
📊 Who This Strategy Is For
CongTrader V1 works well for:
Intraday traders (1–15m)
Swing traders (30m–4h)
Momentum and trend-followers
Algorithmic traders looking for disciplined, rules-based entries
Traders who want cleaner signals and less noise
Anyone who wants to avoid low-quality, choppy markets
🔔 Alerts Included
Built-in alerts notify you instantly when conditions for long or short entries are met, making it suitable for:
Manual execution
Automated trading systems
Signal services
🧩 Important Note
This strategy is designed for educational purposes and is not financial advice. Performance may vary depending on market conditions, broker feed, and instrument volatility. Always backtest thoroughly and use risk management.

KST Strategy [Skyrexio]Overview
KST Strategy leverages Know Sure Thing (KST) indicator in conjunction with the Williams Alligator and Moving average to obtain the high probability setups. KST is used for for having the high probability to enter in the direction of a current trend when momentum is rising, Alligator is used as a short term trend filter, while Moving average approximates the long term trend and allows trades only in its direction. Also strategy has the additional optional filter on Choppiness Index which does not allow trades if market is choppy, above the user-specified threshold. Strategy has the user specified take profit and stop-loss numbers, but multiplied by Average True Range (ATR) value on the moment when trade is open. The strategy opens only long trades.
Unique Features
ATR based stop-loss and take profit. Instead of fixed take profit and stop-loss percentage strategy utilizes user chosen numbers multiplied by ATR for its calculation.
Configurable Trading Periods. Users can tailor the strategy to specific market windows, adapting to different market conditions.
Optional Choppiness Index filter. Strategy allows to choose if it will use the filter trades with Choppiness Index and set up its threshold.
Methodology
The strategy opens long trade when the following price met the conditions:
Close price is above the Alligator's jaw line
Close price is above the filtering Moving average
KST line of Know Sure Thing indicator shall cross over its signal line (details in justification of methodology)
If the Choppiness Index filter is enabled its value shall be less than user defined threshold
When the long trade is executed algorithm defines the stop-loss level as the low minus user defined number, multiplied by ATR at the trade open candle. Also it defines take profit with close price plus user defined number, multiplied by ATR at the trade open candle. While trade is in progress, if high price on any candle above the calculated take profit level or low price is below the calculated stop loss level, trade is closed.
Strategy settings
In the inputs window user can setup the following strategy settings:
ATR Stop Loss (by default = 1.5, number of ATRs to calculate stop-loss level)
ATR Take Profit (by default = 3.5, number of ATRs to calculate take profit level)
Filter MA Type (by default = Least Squares MA, type of moving average which is used for filter MA)
Filter MA Length (by default = 200, length for filter MA calculation)
Enable Choppiness Index Filter (by default = true, setting to choose the optional filtering using Choppiness index)
Choppiness Index Threshold (by default = 50, Choppiness Index threshold, its value shall be below it to allow trades execution)
Choppiness Index Length (by default = 14, length used in Choppiness index calculation)
KST ROC Length #1 (by default = 10, value used in KST indicator calculation, more information in Justification of Methodology)
KST ROC Length #2 (by default = 15, value used in KST indicator calculation, more information in Justification of Methodology)
KST ROC Length #3 (by default = 20, value used in KST indicator calculation, more information in Justification of Methodology)
KST ROC Length #4 (by default = 30, value used in KST indicator calculation, more information in Justification of Methodology)
KST SMA Length #1 (by default = 10, value used in KST indicator calculation, more information in Justification of Methodology)
KST SMA Length #2 (by default = 10, value used in KST indicator calculation, more information in Justification of Methodology)
KST SMA Length #3 (by default = 10, value used in KST indicator calculation, more information in Justification of Methodology)
KST SMA Length #4 (by default = 15, value used in KST indicator calculation, more information in Justification of Methodology)
KST Signal Line Length (by default = 10, value used in KST indicator calculation, more information in Justification of Methodology)
User can choose the optimal parameters during backtesting on certain price chart.
Justification of Methodology
Before understanding why this particular combination of indicator has been chosen let's briefly explain what is KST, Williams Alligator, Moving Average, ATR and Choppiness Index.
The KST (Know Sure Thing) is a momentum oscillator developed by Martin Pring. It combines multiple Rate of Change (ROC) values, smoothed over different timeframes, to identify trend direction and momentum strength. First of all, what is ROC? ROC (Rate of Change) is a momentum indicator that measures the percentage change in price between the current price and the price a set number of periods ago.
ROC = 100 * (Current Price - Price N Periods Ago) / Price N Periods Ago
In our case N is the KST ROC Length inputs from settings, here we will calculate 4 different ROCs to obtain KST value:
KST = ROC1_smooth × 1 + ROC2_smooth × 2 + ROC3_smooth × 3 + ROC4_smooth × 4
ROC1 = ROC(close, KST ROC Length #1), smoothed by KST SMA Length #1,
ROC2 = ROC(close, KST ROC Length #2), smoothed by KST SMA Length #2,
ROC3 = ROC(close, KST ROC Length #3), smoothed by KST SMA Length #3,
ROC4 = ROC(close, KST ROC Length #4), smoothed by KST SMA Length #4
Also for this indicator the signal line is calculated:
Signal = SMA(KST, KST Signal Line Length)
When the KST line rises, it indicates increasing momentum and suggests that an upward trend may be developing. Conversely, when the KST line declines, it reflects weakening momentum and a potential downward trend. A crossover of the KST line above its signal line is considered a buy signal, while a crossover below the signal line is viewed as a sell signal. If the KST stays above zero, it indicates overall bullish momentum; if it remains below zero, it points to bearish momentum. The KST indicator smooths momentum across multiple timeframes, helping to reduce noise and provide clearer signals for medium- to long-term trends.
Next, let’s discuss the short-term trend filter, which combines the Williams Alligator and Williams Fractals. Williams Alligator
Developed by Bill Williams, the Alligator is a technical indicator that identifies trends and potential market reversals. It consists of three smoothed moving averages:
Jaw (Blue Line): The slowest of the three, based on a 13-period smoothed moving average shifted 8 bars ahead.
Teeth (Red Line): The medium-speed line, derived from an 8-period smoothed moving average shifted 5 bars forward.
Lips (Green Line): The fastest line, calculated using a 5-period smoothed moving average shifted 3 bars forward.
When the lines diverge and align in order, the "Alligator" is "awake," signaling a strong trend. When the lines overlap or intertwine, the "Alligator" is "asleep," indicating a range-bound or sideways market. This indicator helps traders determine when to enter or avoid trades.
The next indicator is Moving Average. It has a lot of different types which can be chosen to filter trades and the Least Squares MA is used by default settings. Let's briefly explain what is it.
The Least Squares Moving Average (LSMA) — also known as Linear Regression Moving Average — is a trend-following indicator that uses the least squares method to fit a straight line to the price data over a given period, then plots the value of that line at the most recent point. It draws the best-fitting straight line through the past N prices (using linear regression), and then takes the endpoint of that line as the value of the moving average for that bar. The LSMA aims to reduce lag and highlight the current trend more accurately than traditional moving averages like SMA or EMA.
Key Features:
It reacts faster to price changes than most moving averages.
It is smoother and less noisy than short-term EMAs.
It can be used to identify trend direction, momentum, and potential reversal points.
ATR (Average True Range) is a volatility indicator that measures how much an asset typically moves during a given period. It was introduced by J. Welles Wilder and is widely used to assess market volatility, not direction.
To calculate it first of all we need to get True Range (TR), this is the greatest value among:
High - Low
abs(High - Previous Close)
abs(Low - Previous Close)
ATR = MA(TR, n) , where n is number of periods for moving average, in our case equals 14.
ATR shows how much an asset moves on average per candle/bar. A higher ATR means more volatility; a lower ATR means a calmer market.
The Choppiness Index is a technical indicator that quantifies whether the market is trending or choppy (sideways). It doesn't indicate trend direction — only the strength or weakness of a trend. Higher Choppiness Index usually approximates the sideways market, while its low value tells us that there is a high probability of a trend.
Choppiness Index = 100 × log10(ΣATR(n) / (MaxHigh(n) - MinLow(n))) / log10(n)
where:
ΣATR(n) = sum of the Average True Range over n periods
MaxHigh(n) = highest high over n periods
MinLow(n) = lowest low over n periods
log10 = base-10 logarithm
Now let's understand how these indicators work in conjunction and why they were chosen for this strategy. KST indicator approximates current momentum, when it is rising and KST line crosses over the signal line there is high probability that short term trend is reversing to the upside and strategy allows to take part in this potential move. Alligator's jaw (blue) line is used as an approximation of a short term trend, taking trades only above it we want to avoid trading against trend to increase probability that long trade is going to be winning.
Almost the same for Moving Average, but it approximates the long term trend, this is just the additional filter. If we trade in the direction of the long term trend we increase probability that higher risk to reward trade will hit the take profit. Choppiness index is the optional filter, but if it turned on it is used for approximating if now market is in sideways or in trend. On the range bounded market the potential moves are restricted. We want to decrease probability opening trades in such condition avoiding trades if this index is above threshold value.
When trade is open script sets the stop loss and take profit targets. ATR approximates the current volatility, so we can make a decision when to exit a trade based on current market condition, it can increase the probability that strategy will avoid the excessive stop loss hits, but anyway user can setup how many ATRs to use as a stop loss and take profit target. As was said in the Methodology stop loss level is obtained by subtracting number of ATRs from trade opening candle low, while take profit by adding to this candle's close.
Backtest Results
Operating window: Date range of backtests is 2023.01.01 - 2025.05.01. It is chosen to let the strategy to close all opened positions.
Commission and Slippage: Includes a standard Binance commission of 0.1% and accounts for possible slippage over 5 ticks.
Initial capital: 10000 USDT
Percent of capital used in every trade: 60%
Maximum Single Position Loss: -5.53%
Maximum Single Profit: +8.35%
Net Profit: +5175.20 USDT (+51.75%)
Total Trades: 120 (56.67% win rate)
Profit Factor: 1.747
Maximum Accumulated Loss: 1039.89 USDT (-9.1%)
Average Profit per Trade: 43.13 USDT (+0.6%)
Average Trade Duration: 27 hours
These results are obtained with realistic parameters representing trading conditions observed at major exchanges such as Binance and with realistic trading portfolio usage parameters.
How to Use
Add the script to favorites for easy access.
Apply to the desired timeframe and chart (optimal performance observed on 1h BTC/USDT).
Configure settings using the dropdown choice list in the built-in menu.
Set up alerts to automate strategy positions through web hook with the text: {{strategy.order.alert_message}}
Disclaimer:
Educational and informational tool reflecting Skyrexio commitment to informed trading. Past performance does not guarantee future results. Test strategies in a simulated environment before live implementation.

DVPOOverview
The DVPO (Dynamic Volume Profile Oscillator) Strategy is a comprehensive and highly customizable trading tool designed for precision and control. It is built around a unique, volume-driven oscillator that identifies potential market entries by analyzing the relationship between price, volume, and volatility.
This strategy is not just another signal generator; it's a complete framework that includes dynamic entry logic, adaptive risk management (ATR Stop Loss and R:R-based Take Profit), and a powerful dashboard of 10+ optional confirmation filters to help you tailor the strategy to your specific instrument, timeframe, and trading style.
The Core Concept: The DVPO Oscillator
The heart of this strategy is the DVPO oscillator. Unlike standard oscillators like RSI or Stochastics, the DVPO's primary goal is to quantify how far the current price has deviated from its recent volume-weighted "fair value."
Here’s how it works conceptually:
Micro Volume Profile: The indicator first analyzes a recent period of bars (defined by Lookback Period) to build a mini-profile of price and volume.
Volume-Weighted Mean: From this profile, it calculates a volume-weighted average price (VWAP) and the average deviation from that mean. This establishes the central point of value for the recent period.
Deviation Measurement: The oscillator's value is derived from how far the current price is from this calculated mean, scaled by the observed price deviation and a user-defined Sensitivity. A value above the midline suggests the price is trading at a premium, while a value below suggests it's at a discount.
Adaptive Volatility Zones: Instead of using fixed overbought/oversold levels (e.g., 70/30), the DVPO calculates dynamic upper and lower zones using the standard deviation of the oscillator itself. These zones expand and contract based on recent market volatility.
An entry signal is triggered not just when the oscillator is "overbought" or "oversold," but when it breaks out of these adaptive volatility zones, signaling that a statistically significant price movement is underway.
📈 Long Entry Condition : The oscillator crosses above the dynamic upper zone.
📉 Short Entry Condition : The oscillator crosses below the dynamic lower zone.
Integrated Risk & Trade Management
A signal is useless without proper risk management. This strategy has professional-grade risk management built directly into its logic.
Stop Loss (ATR-Based): The Stop Loss is not a fixed percentage. It is calculated using the Average True Range (ATR), allowing it to adapt automatically to the market's current volatility. In volatile periods, the stop will be wider; in quiet periods, it will be tighter.
Take Profit (Risk/Reward Ratio): The Take Profit level is calculated based on a user-defined Risk/Reward Ratio. If you set a ratio of 2.0, the Take Profit target will be placed at twice the distance of the Stop Loss from your entry price.
Dynamic Position Sizing: The strategy can automatically calculate the trade quantity for you. It determines the position size based on your specified Capital Size and the % Risk Per Trade you are willing to accept, ensuring disciplined risk control on every trade.
The Filter Dashboard : Enhance Your Signal Quality
To help reduce false signals and adapt to different market conditions, the strategy includes a comprehensive dashboard of optional confirmation filters. An entry signal will only be executed if it aligns with all the filters you have activated.
Trend & Momentum Filters :
T3, VMA, & VWAP Trend Filters: Utilize a suite of advanced moving averages (T3, Variable Moving Average, and a session-based VWAP) to ensure your trades are aligned with the dominant trend.
ADX Filter: Confirms that the market has sufficient directional strength for a trend-following trade, helping to avoid entries during choppy conditions.
Kaufman Efficiency Filter: Uses the Kaufman Efficiency Ratio to measure market noise. It only allows trades when the market is trending efficiently.
Volume & Market State Filters :
Volume Flow (VFI): A sophisticated volume-based filter that confirms whether volume is supporting the price move.
TDFI (Trader's Dynamic Index): A market state indicator designed to identify when the market is primed for a strong, directional move.
Flat Market Detector: A unique filter that identifies and avoids trading in sideways or ranging markets where trend strategies typically underperform.
Trade Condition Filters :
Min TP / Max SL %: Filter out trades where the risk/reward profile doesn't meet your minimum requirements (e.g., ignore a trade if the ATR-based stop loss is more than 10% away from the price).
Session Filters: Allows you to enable or disable trading on specific days of the week and to set a Cooldown Period (a set number of bars to wait after a trade closes before looking for a new entry).
How To Use This Strategy
Start with the Core: Begin by configuring the DVPO Oscillator settings (Lookback Period, Sensitivity, Zone Width) and your Risk Management parameters (ATR Multiplier, RR Ratio, % Risk Per Trade). These form the foundation of the strategy.
Backtest and Observe: Use TradingView's Strategy Tester to see how the core signals perform on your chosen asset and timeframe.
Layer Filters Intelligently: Enable the confirmation filters one by one and re-run your backtest. Observe how each filter impacts performance (e.g., does the T3 filter increase profitability but reduce the number of trades?). The goal is to find the optimal balance between signal quality and frequency.
Visualize and Analyze: Use the Show Risk/Reward Area option to plot your entry, stop loss, and take profit levels directly on the chart for every trade, providing a clear visual representation of your trade plan.
Disclaimer: This strategy is provided for educational and analytical purposes only. Past performance is not indicative of future results. All trading involves risk, and you should conduct your own thorough backtesting and analysis before deploying any strategy in a live market.

Momentum Long + Short Strategy (BTC 3H)Momentum Long + Short Strategy (BTC 3H)
🔍 How It Works, Step by Step
Detect the Trend (📈/📉)
Calculate two moving averages (100-period and 500-period), either EMA or SMA.
For longs, we require MA100 > MA500 (uptrend).
For shorts, we block entries if MA100 exceeds MA500 by more than a set percentage (to avoid fading a powerful uptrend).
Apply Momentum Filters (⚡️)
RSI Filter: Measures recent strength—only allow longs when RSI crosses above its smoothed average, and shorts when RSI dips below the oversold threshold.
ADX Filter: Gauges trend strength—ensures we only enter when a meaningful trend exists (optional).
ATR Filter: Confirms volatility—avoids choppy, low-volatility conditions by requiring ATR to exceed its smoothed value (optional).
Confirm Entry Conditions (✅)
Long Entry:
Price is above both MAs
Trend alignment & optional filters pass ✅
Short Entry:
Price is below both MAs and below the lower Bollinger Band
RSI is sufficiently oversold
Trend-blocker & ATR filter pass ✅
Position Sizing & Risk (💰)
Each trade uses 100 % of account equity by default.
One pyramid addition allowed, so you can scale in if the move continues.
Commission and slippage assumptions built in for realistic backtests.
Stops & Exits (🛑)
Long Stop-Loss: e.g. 3 % below entry.
Long Auto-Exit: If price falls back under the 500-period MA.
Short Stop-Loss: e.g. 3 % above entry.
Short Take-Profit: e.g. 4 % below entry.
🎨 Why It’s Powerful & Customizable
Modular Filters: Turn on/off RSI, ADX, ATR filters to suit different market regimes.
Adjustable Thresholds: Fine-tune stop-loss %, take-profit %, RSI lengths, MA gaps and more.
Multi-Timeframe Potential: Although coded for 3 h BTC, you can adapt it to stocks, forex or other cryptos—just recalibrate!
Backtest Fine-Tuned: Default settings were optimized via backtesting on historical BTC data—but they’re not guarantees of future performance.
⚠️ Warning & Disclaimer
This strategy is for educational purposes only and designed for a toy fund. Crypto markets are highly volatile—you can lose 100 % of your capital. It is not a predictive “holy grail” but a rules-based framework using past data. The parameters have been fine-tuned on historical data and are not valid for future trades without fresh calibration. Always practice with paper-trading first, use proper risk management, and do your own research before risking real money. 🚨🔒
Good luck exploring and experimenting! 🚀📊

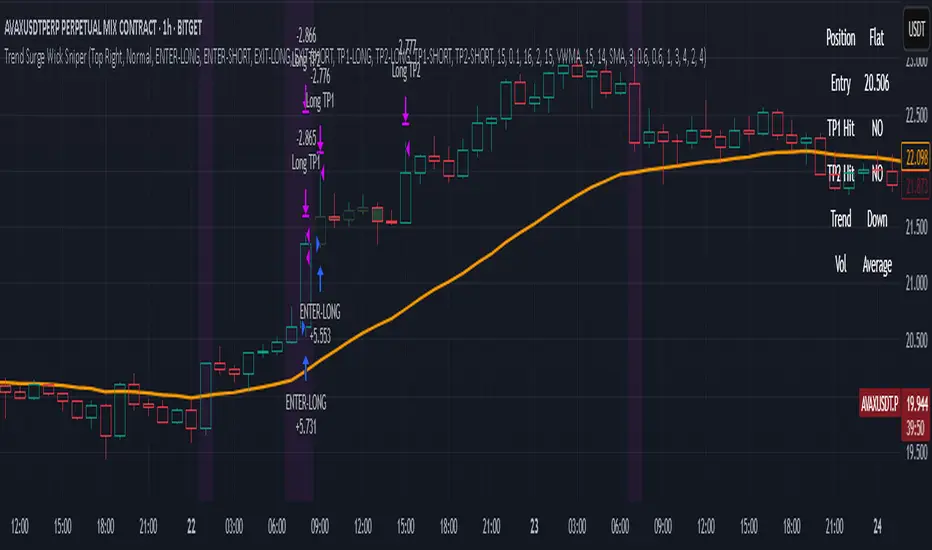
Trend Surge Wick SniperTrend Surge Wick Sniper | Non-Repainting Trend + Momentum Strategy with TP1/TP2 & Dashboard
Trend Surge Wick Sniper is a complete crypto trading strategy designed for high-precision entries, smart exits, and non-repainting execution. It combines trend slope, wick rejection, volume confirmation, and CCI momentum filters into a seamless system that works in real-time conditions — whether you're manual trading or sending alerts to multi-exchange bots.
🧩 System Architecture Overview
This is not just a mashup of indicators — each layer is tightly integrated to filter for confirmed, high-quality setups. Here’s a detailed breakdown:
📈 Trend Logic
1. McGinley Dynamic Baseline
A responsive moving average that adapts to market speed better than EMA or SMA.
Smooths price while staying close to real action, making it ideal for basing alignment or trend context.
2. Gradient Slope Filter (ATR-normalized)
Calculates the difference between current and past McGinley values, divided by ATR for normalization.
If the slope exceeds a configurable threshold, it confirms an active uptrend or downtrend.
Optional loosened sensitivity allows for more frequent but still valid trades.
🚀 Momentum Timing
3. Smoothed CCI (ZLEMA / Hull / VWMA options)
Traditional CCI is enhanced with smoothing for stability.
Signals trades only when momentum is strong and accelerating.
Optional settings let users tune how responsive or smooth they want the CCI behavior to be.
🔒 Entry Filtering & Rejection Logic
4. Wick Trap Detection
Prevents entry during manipulated candles (e.g. stop hunts, wick traps).
Measures wick-to-body ratio against a minimum body size normalized by ATR.
Only trades when the candle shows a clean body and no manipulation.
5. Price Action Filters (Optional)
Long trades require price to break above previous high (or skip this with a toggle).
Short trades require price to break below previous low (or skip this with a toggle).
Ensures you're trading only when price structure confirms the breakout.
6. McGinley Alignment (Optional)
Price must be on the correct side of the McGinley line (above for longs, below for shorts).
Ensures that trades align with baseline trend, preventing early or fading entries.
📊 Volume Logic
7. Volume Spike Detection
Confirms that a real move is underway by requiring volume to exceed a moving average by a user-defined multiplier.
Uses SMA / EMA / VWMA for customizable behavior.
Optional relative volume mode compares volume against typical volume at that same time of day.
8. Volume Trend Filter
Compares fast vs. slow EMA of the volume spike ratio.
Ensures volume is not just spiking, but also increasing overall.
Prevents trades during volume exhaustion or fading participation.
9. Volume Strength Label
Classifies each bar’s volume as: Low, Average, High, or Very High
Shown in the dashboard for context before entries.
🎯 Entry Conditions
An entry occurs when all of the following align:
✅ Trend confirmed via gradient slope
✅ Momentum confirmed via smoothed CCI
✅ No wick trap pattern
✅ Price structure & McGinley alignment (if toggled on)
✅ Volume confirms participation
✅ 1-bar cooldown since last exit
💰 TP1 & TP2 Exit System
TP1 = 50% of position closed using a limit order at a % profit (e.g., 2%)
TP2 = remaining 50% closed at a second profit level (e.g., 4%)
These are set as limit orders at the time of entry and work even on backtest.
Alerts are sent separately for TP1 and TP2 to allow bot handling of staggered exits.
🧠 Trade Logic Controls
✅ process_orders_on_close=true ensures non-repainting behavior
✅ 1-bar cooldown after any exit prevents same-bar reversals
✅ Built-in canEnter condition ensures trades are separated and clean
✅ Alerts use customizable strings for entry/exit/TP1/TP2 — ready for webhook automation
📊 Real-Time On-Chart Dashboard
Toggleable, movable dashboard shows live trading stats:
🔵 Current Position: Long / Short / Flat
🎯 Entry Price
✅ TP1 / TP2 Hit Status
📈 Trend Direction: Up / Down / Flat
🔊 Volume Strength: Low / Average / High / Very High
🎛 Size and corner are adjustable via input settings
⚠️ Designed For:
1H / 4H Crypto Trading
Manual Traders & Webhook-Connected Bots
Scalability across volatile market conditions
Full TradingView backtest compatibility (no repainting / no fake signals)
📌 Notes
You can switch CCI smoothing type, volume MA type, and other filters via the settings panel.
Default TP1/TP2 levels are set to 2% and 4%, but fully customizable.
🛡 Disclaimer
This script is for educational purposes only and not financial advice. Use with backtesting and risk management before live deployment.
Multi-Timeframe Parabolic SAR Strategy ver 1.0Multi-Timeframe Parabolic SAR Strategy (MTF PSAR) - Enhanced Trend Trading
This strategy leverages the power of the Parabolic SAR (Stop and Reverse) indicator across multiple timeframes to provide robust trend identification, precise entry/exit signals, and dynamic trailing stop management. By combining the insights of both the current chart's timeframe and a user-defined higher timeframe, this strategy aims to improve trading accuracy, reduce risk, and capture more significant market moves.
Key Features:
Dual Timeframe Analysis: Simultaneously analyzes the Parabolic SAR on the current chart and a higher timeframe (e.g., Daily PSAR on a 1-hour chart). This allows you to align your trades with the dominant trend and filter out noise from lower timeframes.
Configurable PSAR: Fine-tune the PSAR calculation with adjustable Start, Increment, and Maximum values to optimize sensitivity for your trading style and the asset's volatility.
Independent Timeframe Control: Choose to display and trade based on either or both the current timeframe PSAR and the higher timeframe PSAR. Focus on the most relevant information for your analysis.
Clear Visual Signals: Distinct colors for the current and higher timeframe PSAR dots provide a clear visual representation of potential entry and exit points.
Multiple Entry Strategies: The strategy offers flexible entry conditions, allowing you to trade based on:
Confirmation: Both current and higher timeframe PSAR signals agree and the current timeframe PSAR has just flipped direction. (Most conservative)
Current Timeframe Only: Trades based solely on the current timeframe PSAR, ideal for when the higher timeframe is less relevant or disabled.
Higher Timeframe Only: Trades based solely on the higher timeframe PSAR.
Dynamic Trailing Stop (PSAR-Based): Implements a trailing stop-loss based on the current timeframe's Parabolic SAR. This helps protect profits by automatically adjusting the stop-loss as the price moves in your favor. Exits are triggered when either the current or HTF PSAR flips.
No Repainting: Uses lookahead=barmerge.lookahead_off in the security() function to ensure that the higher timeframe data is accessed without any data leakage, preventing repainting issues.
Fully Configurable: All parameters (PSAR settings, higher timeframe, visibility, colors) are adjustable through the strategy's settings panel, allowing for extensive customization and optimization.
Suitable for Various Trading Styles: Applicable to swing trading, day trading, and trend-following strategies across various markets (stocks, forex, cryptocurrencies, etc.).
How it Works:
PSAR Calculation: The strategy calculates the standard Parabolic SAR for both the current chart's timeframe and the selected higher timeframe.
Trend Identification: The direction of the PSAR (dots below price = uptrend, dots above price = downtrend) determines the current trend for each timeframe.
Entry Signals: The strategy generates buy/sell signals based on the chosen entry strategy (Confirmation, Current Timeframe Only, or Higher Timeframe Only). The Confirmation strategy offers the highest probability signals by requiring agreement between both timeframes.
Trailing Stop Exit: Once a position is entered, the strategy uses the current timeframe PSAR as a dynamic trailing stop. The stop-loss is automatically adjusted as the PSAR dots move, helping to lock in profits and limit losses. The strategy exits when either the Current or HTF PSAR changes direction.
Backtesting and Optimization: The strategy automatically backtests on the chart's historical data, allowing you to evaluate its performance and optimize the settings for different assets and timeframes.
Example Use Cases:
Trend Confirmation: A trader on a 1-hour chart observes a bullish PSAR flip on the current timeframe. They check the MTF PSAR strategy and see that the Daily PSAR is also bullish, confirming the strength of the uptrend and providing a high-probability long entry signal.
Filtering Noise: A trader on a 5-minute chart wants to avoid whipsaws caused by short-term price fluctuations. They use the strategy with a 1-hour higher timeframe to filter out noise and only trade in the direction of the dominant trend.
Dynamic Risk Management: A trader enters a long position and uses the current timeframe PSAR as a trailing stop. As the price rises, the PSAR dots move upwards, automatically raising the stop-loss and protecting profits. The trade is exited when the current (or HTF) PSAR flips to bearish.
Disclaimer:
The Parabolic SAR is a lagging indicator and can produce false signals, particularly in ranging or choppy markets. This strategy is intended for educational and informational purposes only and should not be considered financial advice. It is essential to backtest and optimize the strategy thoroughly, use it in conjunction with other technical analysis tools, and implement sound risk management practices before using it with real capital. Past performance is not indicative of future results. Always conduct your own due diligence and consider your risk tolerance before making any trading decisions.

AO/AC Trading Zones Strategy [Skyrexio] Overview
AO/AC Trading Zones Strategy leverages the combination of Awesome Oscillator (AO), Acceleration/Deceleration Indicator (AC), Williams Fractals, Williams Alligator and Exponential Moving Average (EMA) to obtain the high probability long setups. Moreover, strategy uses multi trades system, adding funds to long position if it considered that current trend has likely became stronger. Combination of AO and AC is used for creating so-called trading zones to create the signals, while Alligator and Fractal are used in conjunction as an approximation of short-term trend to filter them. At the same time EMA (default EMA's period = 100) is used as high probability long-term trend filter to open long trades only if it considers current price action as an uptrend. More information in "Methodology" and "Justification of Methodology" paragraphs. The strategy opens only long trades.
Unique Features
No fixed stop-loss and take profit: Instead of fixed stop-loss level strategy utilizes technical condition obtained by Fractals and Alligator to identify when current uptrend is likely to be over. In some special cases strategy uses AO and AC combination to trail profit (more information in "Methodology" and "Justification of Methodology" paragraphs)
Configurable Trading Periods: Users can tailor the strategy to specific market windows, adapting to different market conditions.
Multilayer trades opening system: strategy uses only 10% of capital in every trade and open up to 5 trades at the same time if script consider current trend as strong one.
Short and long term trend trade filters: strategy uses EMA as high probability long-term trend filter and Alligator and Fractal combination as a short-term one.
Methodology
The strategy opens long trade when the following price met the conditions:
1. Price closed above EMA (by default, period = 100). Crossover is not obligatory.
2. Combination of Alligator and Williams Fractals shall consider current trend as an upward (all details in "Justification of Methodology" paragraph)
3. Both AC and AO shall print two consecutive increasing values. At the price candle close which corresponds to this condition algorithm opens the first long trade with 10% of capital.
4. If combination of Alligator and Williams Fractals shall consider current trend has been changed from up to downtrend, all long trades will be closed, no matter how many trades has been opened.
5. If AO and AC both continue printing the rising values strategy opens the long trade on each candle close with 10% of capital while number of opened trades reaches 5.
6. If AO and AC both has printed 5 rising values in a row algorithm close all trades if candle's low below the low of the 5-th candle with rising AO and AC values in a row.
Script also has additional visuals. If second long trade has been opened simultaneously the Alligator's teeth line is plotted with the green color. Also for every trade in a row from 2 to 5 the label "Buy More" is also plotted just below the teeth line. With every next simultaneously opened trade the green color of the space between teeth and price became less transparent.
Strategy settings
In the inputs window user can setup strategy setting:
EMA Length (by default = 100, period of EMA, used for long-term trend filtering EMA calculation).
User can choose the optimal parameters during backtesting on certain price chart.
Justification of Methodology
Let's explore the key concepts of this strategy and understand how they work together. We'll begin with the simplest: the EMA.
The Exponential Moving Average (EMA) is a type of moving average that assigns greater weight to recent price data, making it more responsive to current market changes compared to the Simple Moving Average (SMA). This tool is widely used in technical analysis to identify trends and generate buy or sell signals. The EMA is calculated as follows:
1.Calculate the Smoothing Multiplier:
Multiplier = 2 / (n + 1), Where n is the number of periods.
2. EMA Calculation
EMA = (Current Price) × Multiplier + (Previous EMA) × (1 − Multiplier)
In this strategy, the EMA acts as a long-term trend filter. For instance, long trades are considered only when the price closes above the EMA (default: 100-period). This increases the likelihood of entering trades aligned with the prevailing trend.
Next, let’s discuss the short-term trend filter, which combines the Williams Alligator and Williams Fractals. Williams Alligator
Developed by Bill Williams, the Alligator is a technical indicator that identifies trends and potential market reversals. It consists of three smoothed moving averages:
Jaw (Blue Line): The slowest of the three, based on a 13-period smoothed moving average shifted 8 bars ahead.
Teeth (Red Line): The medium-speed line, derived from an 8-period smoothed moving average shifted 5 bars forward.
Lips (Green Line): The fastest line, calculated using a 5-period smoothed moving average shifted 3 bars forward.
When the lines diverge and align in order, the "Alligator" is "awake," signaling a strong trend. When the lines overlap or intertwine, the "Alligator" is "asleep," indicating a range-bound or sideways market. This indicator helps traders determine when to enter or avoid trades.
Fractals, another tool by Bill Williams, help identify potential reversal points on a price chart. A fractal forms over at least five consecutive bars, with the middle bar showing either:
Up Fractal: Occurs when the middle bar has a higher high than the two preceding and two following bars, suggesting a potential downward reversal.
Down Fractal: Happens when the middle bar shows a lower low than the surrounding two bars, hinting at a possible upward reversal.
Traders often use fractals alongside other indicators to confirm trends or reversals, enhancing decision-making accuracy.
How do these tools work together in this strategy? Let’s consider an example of an uptrend.
When the price breaks above an up fractal, it signals a potential bullish trend. This occurs because the up fractal represents a shift in market behavior, where a temporary high was formed due to selling pressure. If the price revisits this level and breaks through, it suggests the market sentiment has turned bullish.
The breakout must occur above the Alligator’s teeth line to confirm the trend. A breakout below the teeth is considered invalid, and the downtrend might still persist. Conversely, in a downtrend, the same logic applies with down fractals.
In this strategy if the most recent up fractal breakout occurs above the Alligator's teeth and follows the last down fractal breakout below the teeth, the algorithm identifies an uptrend. Long trades can be opened during this phase if a signal aligns. If the price breaks a down fractal below the teeth line during an uptrend, the strategy assumes the uptrend has ended and closes all open long trades.
By combining the EMA as a long-term trend filter with the Alligator and fractals as short-term filters, this approach increases the likelihood of opening profitable trades while staying aligned with market dynamics.
Now let's talk about the trading zones concept and its signals. To understand this we need to briefly introduce what is AO and AC. The Awesome Oscillator (AO), developed by Bill Williams, is a momentum indicator designed to measure market momentum by contrasting recent price movements with a longer-term historical perspective. It helps traders detect potential trend reversals and assess the strength of ongoing trends.
The formula for AO is as follows:
AO = SMA5(Median Price) − SMA34(Median Price)
where:
Median Price = (High + Low) / 2
SMA5 = 5-period Simple Moving Average of the Median Price
SMA 34 = 34-period Simple Moving Average of the Median Price
The Acceleration/Deceleration (AC) Indicator, introduced by Bill Williams, measures the rate of change in market momentum. It highlights shifts in the driving force of price movements and helps traders spot early signs of trend changes. The AC Indicator is particularly useful for identifying whether the current momentum is accelerating or decelerating, which can indicate potential reversals or continuations. For AC calculation we shall use the AO calculated above is the following formula:
AC = AO − SMA5(AO) , where SMA5(AO)is the 5-period Simple Moving Average of the Awesome Oscillator
When the AC is above the zero line and rising, it suggests accelerating upward momentum.
When the AC is below the zero line and falling, it indicates accelerating downward momentum.
When the AC is below zero line and rising it suggests the decelerating the downtrend momentum. When AC is above the zero line and falling, it suggests the decelerating the uptrend momentum.
Now let's discuss the trading zones concept and how it can create the signal. Zones are created by the combination of AO and AC. We can divide three zone types:
Greed zone: when the AO and AC both are rising
Red zone: when the AO and AC both are decreasing
Gray zone: when one of AO or AC is rising, the other is falling
Gray zone is considered as uncertainty. AC and AO are moving in the opposite direction. Strategy skip such price action to decrease the chance to stuck in the losing trade during potential sideways. Red zone is also not interesting for the algorithm because both indicators consider the trend as bearish, but strategy opens only long trades. It is waiting for the green zone to increase the chance to open trade in the direction of the potential uptrend. When we have 2 candles in a row in the green zone script executes a long trade with 10% of capital.
Two green zone candles in a row is considered by algorithm as a bullish trend, but now so strong, that's the reason why trade is going to be closed when the combination of Alligator and Fractals will consider the the trend change from bullish to bearish. If id did not happens, algorithm starts to count the green zone candles in a row. When we have 5 in a row script change the trade closing condition. Such situation is considered is a high probability strong bull market and all trades will be closed if candle's low will be lower than fifth green zone candle's low. This is used to increase probability to secure the profit. If long trades are initiated, the strategy continues utilizing subsequent signals until the total number of trades reaches a maximum of 5. Each trade uses 10% of capital.
Why we use trading zones signals? If currently strategy algorithm considers the high probability of the short-term uptrend with the Alligator and Fractals combination pointed out above and the long-term trend is also suggested by the EMA filter as bullish. Rising AC and AO values in the direction of the most likely main trend signaling that we have the high probability of the fastest bullish phase on the market. The main idea is to take part in such rapid moves and add trades if this move continues its acceleration according to indicators.
Backtest Results
Operating window: Date range of backtests is 2023.01.01 - 2024.12.31. It is chosen to let the strategy to close all opened positions.
Commission and Slippage: Includes a standard Binance commission of 0.1% and accounts for possible slippage over 5 ticks.
Initial capital: 10000 USDT
Percent of capital used in every trade: 10%
Maximum Single Position Loss: -9.49%
Maximum Single Profit: +24.33%
Net Profit: +4374.70 USDT (+43.75%)
Total Trades: 278 (39.57% win rate)
Profit Factor: 2.203
Maximum Accumulated Loss: 668.16 USDT (-5.43%)
Average Profit per Trade: 15.74 USDT (+1.37%)
Average Trade Duration: 60 hours
How to Use
Add the script to favorites for easy access.
Apply to the desired timeframe and chart (optimal performance observed on 4h BTC/USDT).
Configure settings using the dropdown choice list in the built-in menu.
Set up alerts to automate strategy positions through web hook with the text: {{strategy.order.alert_message}}
Disclaimer:
Educational and informational tool reflecting Skyrex commitment to informed trading. Past performance does not guarantee future results. Test strategies in a simulated environment before live implementation
These results are obtained with realistic parameters representing trading conditions observed at major exchanges such as Binance and with realistic trading portfolio usage parameters.

MultiLayer Acceleration/Deceleration Strategy [Skyrexio]Overview
MultiLayer Acceleration/Deceleration Strategy leverages the combination of Acceleration/Deceleration Indicator(AC), Williams Alligator, Williams Fractals and Exponential Moving Average (EMA) to obtain the high probability long setups. Moreover, strategy uses multi trades system, adding funds to long position if it considered that current trend has likely became stronger. Acceleration/Deceleration Indicator is used for creating signals, while Alligator and Fractal are used in conjunction as an approximation of short-term trend to filter them. At the same time EMA (default EMA's period = 100) is used as high probability long-term trend filter to open long trades only if it considers current price action as an uptrend. More information in "Methodology" and "Justification of Methodology" paragraphs. The strategy opens only long trades.
Unique Features
No fixed stop-loss and take profit: Instead of fixed stop-loss level strategy utilizes technical condition obtained by Fractals and Alligator to identify when current uptrend is likely to be over (more information in "Methodology" and "Justification of Methodology" paragraphs)
Configurable Trading Periods: Users can tailor the strategy to specific market windows, adapting to different market conditions.
Multilayer trades opening system: strategy uses only 10% of capital in every trade and open up to 5 trades at the same time if script consider current trend as strong one.
Short and long term trend trade filters: strategy uses EMA as high probability long-term trend filter and Alligator and Fractal combination as a short-term one.
Methodology
The strategy opens long trade when the following price met the conditions:
1. Price closed above EMA (by default, period = 100). Crossover is not obligatory.
2. Combination of Alligator and Williams Fractals shall consider current trend as an upward (all details in "Justification of Methodology" paragraph)
3. Acceleration/Deceleration shall create one of two types of long signals (all details in "Justification of Methodology" paragraph). Buy stop order is placed one tick above the candle's high of last created long signal.
4. If price reaches the order price, long position is opened with 10% of capital.
5. If currently we have opened position and price creates and hit the order price of another one long signal, another one long position will be added to the previous with another one 10% of capital. Strategy allows to open up to 5 long trades simultaneously.
6. If combination of Alligator and Williams Fractals shall consider current trend has been changed from up to downtrend, all long trades will be closed, no matter how many trades has been opened.
Script also has additional visuals. If second long trade has been opened simultaneously the Alligator's teeth line is plotted with the green color. Also for every trade in a row from 2 to 5 the label "Buy More" is also plotted just below the teeth line. With every next simultaneously opened trade the green color of the space between teeth and price became less transparent.
Strategy settings
In the inputs window user can setup strategy setting: EMA Length (by default = 100, period of EMA, used for long-term trend filtering EMA calculation). User can choose the optimal parameters during backtesting on certain price chart.
Justification of Methodology
Let's explore the key concepts of this strategy and understand how they work together. We'll begin with the simplest: the EMA.
The Exponential Moving Average (EMA) is a type of moving average that assigns greater weight to recent price data, making it more responsive to current market changes compared to the Simple Moving Average (SMA). This tool is widely used in technical analysis to identify trends and generate buy or sell signals. The EMA is calculated as follows:
1.Calculate the Smoothing Multiplier:
Multiplier = 2 / (n + 1), Where n is the number of periods.
2. EMA Calculation
EMA = (Current Price) × Multiplier + (Previous EMA) × (1 − Multiplier)
In this strategy, the EMA acts as a long-term trend filter. For instance, long trades are considered only when the price closes above the EMA (default: 100-period). This increases the likelihood of entering trades aligned with the prevailing trend.
Next, let’s discuss the short-term trend filter, which combines the Williams Alligator and Williams Fractals. Williams Alligator
Developed by Bill Williams, the Alligator is a technical indicator that identifies trends and potential market reversals. It consists of three smoothed moving averages:
Jaw (Blue Line): The slowest of the three, based on a 13-period smoothed moving average shifted 8 bars ahead.
Teeth (Red Line): The medium-speed line, derived from an 8-period smoothed moving average shifted 5 bars forward.
Lips (Green Line): The fastest line, calculated using a 5-period smoothed moving average shifted 3 bars forward.
When the lines diverge and align in order, the "Alligator" is "awake," signaling a strong trend. When the lines overlap or intertwine, the "Alligator" is "asleep," indicating a range-bound or sideways market. This indicator helps traders determine when to enter or avoid trades.
Fractals, another tool by Bill Williams, help identify potential reversal points on a price chart. A fractal forms over at least five consecutive bars, with the middle bar showing either:
Up Fractal: Occurs when the middle bar has a higher high than the two preceding and two following bars, suggesting a potential downward reversal.
Down Fractal: Happens when the middle bar shows a lower low than the surrounding two bars, hinting at a possible upward reversal.
Traders often use fractals alongside other indicators to confirm trends or reversals, enhancing decision-making accuracy.
How do these tools work together in this strategy? Let’s consider an example of an uptrend.
When the price breaks above an up fractal, it signals a potential bullish trend. This occurs because the up fractal represents a shift in market behavior, where a temporary high was formed due to selling pressure. If the price revisits this level and breaks through, it suggests the market sentiment has turned bullish.
The breakout must occur above the Alligator’s teeth line to confirm the trend. A breakout below the teeth is considered invalid, and the downtrend might still persist. Conversely, in a downtrend, the same logic applies with down fractals.
In this strategy if the most recent up fractal breakout occurs above the Alligator's teeth and follows the last down fractal breakout below the teeth, the algorithm identifies an uptrend. Long trades can be opened during this phase if a signal aligns. If the price breaks a down fractal below the teeth line during an uptrend, the strategy assumes the uptrend has ended and closes all open long trades.
By combining the EMA as a long-term trend filter with the Alligator and fractals as short-term filters, this approach increases the likelihood of opening profitable trades while staying aligned with market dynamics.
Now let's talk about Acceleration/Deceleration signals. AC indicator is calculated using the Awesome Oscillator, so let's first of all briefly explain what is Awesome Oscillator and how it can be calculated. The Awesome Oscillator (AO), developed by Bill Williams, is a momentum indicator designed to measure market momentum by contrasting recent price movements with a longer-term historical perspective. It helps traders detect potential trend reversals and assess the strength of ongoing trends.
The formula for AO is as follows:
AO = SMA5(Median Price) − SMA34(Median Price)
where:
Median Price = (High + Low) / 2
SMA5 = 5-period Simple Moving Average of the Median Price
SMA 34 = 34-period Simple Moving Average of the Median Price
The Acceleration/Deceleration (AC) Indicator, introduced by Bill Williams, measures the rate of change in market momentum. It highlights shifts in the driving force of price movements and helps traders spot early signs of trend changes. The AC Indicator is particularly useful for identifying whether the current momentum is accelerating or decelerating, which can indicate potential reversals or continuations. For AC calculation we shall use the AO calculated above is the following formula:
AC = AO − SMA5(AO), where SMA5(AO)is the 5-period Simple Moving Average of the Awesome Oscillator
When the AC is above the zero line and rising, it suggests accelerating upward momentum.
When the AC is below the zero line and falling, it indicates accelerating downward momentum.
When the AC is below zero line and rising it suggests the decelerating the downtrend momentum. When AC is above the zero line and falling, it suggests the decelerating the uptrend momentum.
Now we can explain which AC signal types are used in this strategy. The first type of long signal is when AC value is below zero line. In this cases we need to see three rising bars on the histogram in a row after the falling one. The second type of signals occurs above the zero line. There we need only two rising AC bars in a row after the falling one to create the signal. The signal bar is the last green bar in this sequence. The strategy places the buy stop order one tick above the candle's high, which corresponds to the signal bar on AC indicator.
After that we can have the following scenarios:
Price hit the order on the next candle in this case strategy opened long with this price.
Price doesn't hit the order price, the next candle set lower high. If current AC bar is increasing buy stop order changes by the script to the high of this new bar plus one tick. This procedure repeats until price finally hit buy order or current AC bar become decreasing. In the second case buy order cancelled and strategy wait for the next AC signal.
If long trades are initiated, the strategy continues utilizing subsequent signals until the total number of trades reaches a maximum of 5. All open trades are closed when the trend shifts to a downtrend, as determined by the combination of the Alligator and Fractals described earlier.
Why we use AC signals? If currently strategy algorithm considers the high probability of the short-term uptrend with the Alligator and Fractals combination pointed out above and the long-term trend is also suggested by the EMA filter as bullish. Rising AC bars after period of falling AC bars indicates the high probability of local pull back end and there is a high chance to open long trade in the direction of the most likely main uptrend. The numbers of rising bars are different for the different AC values (below or above zero line). This is needed because if AC below zero line the local downtrend is likely to be stronger and needs more rising bars to confirm that it has been changed than if AC is above zero.
Why strategy use only 10% per signal? Sometimes we can see the false signals which appears on sideways. Not risking that much script use only 10% per signal. If the first long trade has been open and price continue going up and our trend approximation by Alligator and Fractals is uptrend, strategy add another one 10% of capital to every next AC signal while number of active trades no more than 5. This capital allocation allows to take part in long trades when current uptrend is likely to be strong and use only 10% of capital when there is a high probability of sideways.
Backtest Results
Operating window: Date range of backtests is 2023.01.01 - 2024.11.01. It is chosen to let the strategy to close all opened positions.
Commission and Slippage: Includes a standard Binance commission of 0.1% and accounts for possible slippage over 5 ticks.
Initial capital: 10000 USDT
Percent of capital used in every trade: 10%
Maximum Single Position Loss: -5.15%
Maximum Single Profit: +24.57%
Net Profit: +2108.85 USDT (+21.09%)
Total Trades: 111 (36.94% win rate)
Profit Factor: 2.391
Maximum Accumulated Loss: 367.61 USDT (-2.97%)
Average Profit per Trade: 19.00 USDT (+1.78%)
Average Trade Duration: 75 hours
How to Use
Add the script to favorites for easy access.
Apply to the desired timeframe and chart (optimal performance observed on 3h BTC/USDT).
Configure settings using the dropdown choice list in the built-in menu.
Set up alerts to automate strategy positions through web hook with the text: {{strategy.order.alert_message}}
Disclaimer:
Educational and informational tool reflecting Skyrex commitment to informed trading. Past performance does not guarantee future results. Test strategies in a simulated environment before live implementation
These results are obtained with realistic parameters representing trading conditions observed at major exchanges such as Binance and with realistic trading portfolio usage parameters.

MultiLayer Awesome Oscillator Saucer Strategy [Skyrexio]Overview
MultiLayer Awesome Oscillator Saucer Strategy leverages the combination of Awesome Oscillator (AO), Williams Alligator, Williams Fractals and Exponential Moving Average (EMA) to obtain the high probability long setups. Moreover, strategy uses multi trades system, adding funds to long position if it considered that current trend has likely became stronger. Awesome Oscillator is used for creating signals, while Alligator and Fractal are used in conjunction as an approximation of short-term trend to filter them. At the same time EMA (default EMA's period = 100) is used as high probability long-term trend filter to open long trades only if it considers current price action as an uptrend. More information in "Methodology" and "Justification of Methodology" paragraphs. The strategy opens only long trades.
Unique Features
No fixed stop-loss and take profit: Instead of fixed stop-loss level strategy utilizes technical condition obtained by Fractals and Alligator to identify when current uptrend is likely to be over (more information in "Methodology" and "Justification of Methodology" paragraphs)
Configurable Trading Periods: Users can tailor the strategy to specific market windows, adapting to different market conditions.
Multilayer trades opening system: strategy uses only 10% of capital in every trade and open up to 5 trades at the same time if script consider current trend as strong one.
Short and long term trend trade filters: strategy uses EMA as high probability long-term trend filter and Alligator and Fractal combination as a short-term one.
Methodology
The strategy opens long trade when the following price met the conditions:
1. Price closed above EMA (by default, period = 100). Crossover is not obligatory.
2. Combination of Alligator and Williams Fractals shall consider current trend as an upward (all details in "Justification of Methodology" paragraph)
3. Awesome Oscillator shall create the "Saucer" long signal (all details in "Justification of Methodology" paragraph). Buy stop order is placed one tick above the candle's high of last created "Saucer signal".
4. If price reaches the order price, long position is opened with 10% of capital.
5. If currently we have opened position and price creates and hit the order price of another one "Saucer" signal another one long position will be added to the previous with another one 10% of capital. Strategy allows to open up to 5 long trades simultaneously.
6. If combination of Alligator and Williams Fractals shall consider current trend has been changed from up to downtrend, all long trades will be closed, no matter how many trades has been opened.
Script also has additional visuals. If second long trade has been opened simultaneously the Alligator's teeth line is plotted with the green color. Also for every trade in a row from 2 to 5 the label "Buy More" is also plotted just below the teeth line. With every next simultaneously opened trade the green color of the space between teeth and price became less transparent.
Strategy settings
In the inputs window user can setup strategy setting: EMA Length (by default = 100, period of EMA, used for long-term trend filtering EMA calculation). User can choose the optimal parameters during backtesting on certain price chart.
Justification of Methodology
Let's go through all concepts used in this strategy to understand how they works together. Let's start from the easies one, the EMA. Let's briefly explain what is EMA. The Exponential Moving Average (EMA) is a type of moving average that gives more weight to recent prices, making it more responsive to current price changes compared to the Simple Moving Average (SMA). It is commonly used in technical analysis to identify trends and generate buy or sell signals. It can be calculated with the following steps:
1.Calculate the Smoothing Multiplier:
Multiplier = 2 / (n + 1), Where n is the number of periods.
2. EMA Calculation
EMA = (Current Price) × Multiplier + (Previous EMA) × (1 − Multiplier)
In this strategy uses EMA an initial long term trend filter. It allows to open long trades only if price close above EMA (by default 50 period). It increases the probability of taking long trades only in the direction of the trend.
Let's go to the next, short-term trend filter which consists of Alligator and Fractals. Let's briefly explain what do these indicators means. The Williams Alligator, developed by Bill Williams, is a technical indicator designed to spot trends and potential market reversals. It uses three smoothed moving averages, referred to as the jaw, teeth, and lips:
Jaw (Blue Line): The slowest of the three, based on a 13-period smoothed moving average shifted 8 bars ahead.
Teeth (Red Line): The medium-speed line, derived from an 8-period smoothed moving average shifted 5 bars forward.
Lips (Green Line): The fastest line, calculated using a 5-period smoothed moving average shifted 3 bars forward.
When these lines diverge and are properly aligned, the "alligator" is considered "awake," signaling a strong trend. Conversely, when the lines overlap or intertwine, the "alligator" is "asleep," indicating a range-bound or sideways market. This indicator assists traders in identifying when to act on or avoid trades.
The Williams Fractals, another tool introduced by Bill Williams, are used to pinpoint potential reversal points on a price chart. A fractal forms when there are at least five consecutive bars, with the middle bar displaying the highest high (for an up fractal) or the lowest low (for a down fractal), relative to the two bars on either side.
Key Points:
Up Fractal: Occurs when the middle bar has a higher high than the two preceding and two following bars, suggesting a potential downward reversal.
Down Fractal: Happens when the middle bar shows a lower low than the surrounding two bars, hinting at a possible upward reversal.
Traders often combine fractals with other indicators to confirm trends or reversals, improving the accuracy of trading decisions.
How we use their combination in this strategy? Let’s consider an uptrend example. A breakout above an up fractal can be interpreted as a bullish signal, indicating a high likelihood that an uptrend is beginning. Here's the reasoning: an up fractal represents a potential shift in market behavior. When the fractal forms, it reflects a pullback caused by traders selling, creating a temporary high. However, if the price manages to return to that fractal’s high and break through it, it suggests the market has "changed its mind" and a bullish trend is likely emerging.
The moment of the breakout marks the potential transition to an uptrend. It’s crucial to note that this breakout must occur above the Alligator's teeth line. If it happens below, the breakout isn’t valid, and the downtrend may still persist. The same logic applies inversely for down fractals in a downtrend scenario.
So, if last up fractal breakout was higher, than Alligator's teeth and it happened after last down fractal breakdown below teeth, algorithm considered current trend as an uptrend. During this uptrend long trades can be opened if signal was flashed. If during the uptrend price breaks down the down fractal below teeth line, strategy considered that uptrend is finished with the high probability and strategy closes all current long trades. This combination is used as a short term trend filter increasing the probability of opening profitable long trades in addition to EMA filter, described above.
Now let's talk about Awesome Oscillator's "Sauser" signals. Briefly explain what is the Awesome Oscillator. The Awesome Oscillator (AO), created by Bill Williams, is a momentum-based indicator that evaluates market momentum by comparing recent price activity to a broader historical context. It assists traders in identifying potential trend reversals and gauging trend strength.
AO = SMA5(Median Price) − SMA34(Median Price)
where:
Median Price = (High + Low) / 2
SMA5 = 5-period Simple Moving Average of the Median Price
SMA 34 = 34-period Simple Moving Average of the Median Price
Now we know what is AO, but what is the "Saucer" signal? This concept was introduced by Bill Williams, let's briefly explain it and how it's used by this strategy. Initially, this type of signal is a combination of the following AO bars: we need 3 bars in a row, the first one shall be higher than the second, the third bar also shall be higher, than second. All three bars shall be above the zero line of AO. The price bar, which corresponds to third "saucer's" bar is our signal bar. Strategy places buy stop order one tick above the price bar which corresponds to signal bar.
After that we can have the following scenarios.
Price hit the order on the next candle in this case strategy opened long with this price.
Price doesn't hit the order price, the next candle set lower low. If current AO bar is increasing buy stop order changes by the script to the high of this new bar plus one tick. This procedure repeats until price finally hit buy order or current AO bar become decreasing. In the second case buy order cancelled and strategy wait for the next "Saucer" signal.
If long trades has been opened strategy use all the next signals until number of trades doesn't exceed 5. All trades are closed when the trend changes to downtrend according to combination of Alligator and Fractals described above.
Why we use "Saucer" signals? If AO above the zero line there is a high probability that price now is in uptrend if we take into account our two trend filters. When we see the decreasing bars on AO and it's above zero it's likely can be considered as a pullback on the uptrend. When we see the stop of AO decreasing and the first increasing bar has been printed there is a high probability that this local pull back is finished and strategy open long trade in the likely direction of a main trend.
Why strategy use only 10% per signal? Sometimes we can see the false signals which appears on sideways. Not risking that much script use only 10% per signal. If the first long trade has been open and price continue going up and our trend approximation by Alligator and Fractals is uptrend, strategy add another one 10% of capital to every next saucer signal while number of active trades no more than 5. This capital allocation allows to take part in long trades when current uptrend is likely to be strong and use only 10% of capital when there is a high probability of sideways.
Backtest Results
Operating window: Date range of backtests is 2023.01.01 - 2024.11.25. It is chosen to let the strategy to close all opened positions.
Commission and Slippage: Includes a standard Binance commission of 0.1% and accounts for possible slippage over 5 ticks.
Initial capital: 10000 USDT
Percent of capital used in every trade: 10%
Maximum Single Position Loss: -5.10%
Maximum Single Profit: +22.80%
Net Profit: +2838.58 USDT (+28.39%)
Total Trades: 107 (42.99% win rate)
Profit Factor: 3.364
Maximum Accumulated Loss: 373.43 USDT (-2.98%)
Average Profit per Trade: 26.53 USDT (+2.40%)
Average Trade Duration: 78 hours
These results are obtained with realistic parameters representing trading conditions observed at major exchanges such as Binance and with realistic trading portfolio usage parameters.
How to Use
Add the script to favorites for easy access.
Apply to the desired timeframe and chart (optimal performance observed on 3h BTC/USDT).
Configure settings using the dropdown choice list in the built-in menu.
Set up alerts to automate strategy positions through web hook with the text: {{strategy.order.alert_message}}
Disclaimer:
Educational and informational tool reflecting Skyrex commitment to informed trading. Past performance does not guarantee future results. Test strategies in a simulated environment before live implementation

Triple CCI Strategy MFI Confirmed [Skyrexio]Overview
Triple CCI Strategy MFI Confirmed leverages 3 different periods Commodity Channel Index (CCI) indicator in conjunction Money Flow Index (MFI) and Exponential Moving Average (EMA) to obtain the high probability setups. Fast period CCI is used for having the high probability to enter in the direction of short term trend, middle and slow period CCI are used for confirmation, if market now likely in the mid and long-term uptrend. MFI is used to confirm trade with the money inflow/outflow with the high probability. EMA is used as an additional trend filter. Moreover, strategy uses exponential moving average (EMA) to trail the price when it reaches the specific level. More information in "Methodology" and "Justification of Methodology" paragraphs. The strategy opens only long trades.
Unique Features
Dynamic stop-loss system: Instead of fixed stop-loss level strategy utilizes average true range (ATR) multiplied by user given number subtracted from the position entry price as a dynamic stop loss level.
Configurable Trading Periods: Users can tailor the strategy to specific market windows, adapting to different market conditions.
Four layers trade filtering system: Strategy utilizes two different period CCI indicators, MFI and EMA indicators to confirm the signals produced by fast period CCI.
Trailing take profit level: After reaching the trailing profit activation level scrip activate the trailing of long trade using EMA. More information in methodology.
Methodology
The strategy opens long trade when the following price met the conditions:
Fast period CCI shall crossover the zero-line.
Slow and Middle period CCI shall be above zero-lines.
Price shall close above the EMA. Crossover is not obligatory
MFI shall be above 50
When long trade is executed, strategy set the stop-loss level at the price ATR multiplied by user-given value below the entry price. This level is recalculated on every next candle close, adjusting to the current market volatility.
At the same time strategy set up the trailing stop validation level. When the price crosses the level equals entry price plus ATR multiplied by user-given value script starts to trail the price with EMA. If price closes below EMA long trade is closed. When the trailing starts, script prints the label “Trailing Activated”.
Strategy settings
In the inputs window user can setup the following strategy settings:
ATR Stop Loss (by default = 1.75)
ATR Trailing Profit Activation Level (by default = 2.25)
CCI Fast Length (by default = 14, used for calculation short term period CCI)
CCI Middle Length (by default = 25, used for calculation short term period CCI)
CCI Slow Length (by default = 50, used for calculation long term period CCI)
MFI Length (by default = 14, used for calculation MFI
EMA Length (by default = 50, period of EMA, used for trend filtering EMA calculation)
Trailing EMA Length (by default = 20)
User can choose the optimal parameters during backtesting on certain price chart.
Justification of Methodology
Before understanding why this particular combination of indicator has been chosen let's briefly explain what is CCI, MFI and EMA.
The Commodity Channel Index (CCI) is a momentum-based technical indicator that measures the deviation of a security's price from its average price over a specific period. It helps traders identify overbought or oversold conditions and potential trend reversals.
The CCI formula is:
CCI = (Typical Price − SMA) / (0.015 × Mean Deviation)
Typical Price (TP): This is calculated as the average of the high, low, and closing prices for the period.
Simple Moving Average (SMA): This is the average of the Typical Prices over a specific number of periods.
Mean Deviation: This is the average of the absolute differences between the Typical Price and the SMA.
The result is a value that typically fluctuates between +100 and -100, though it is not bounded and can go higher or lower depending on the price movement.
The Money Flow Index (MFI) is a technical indicator that measures the strength of money flowing into and out of a security. It combines price and volume data to assess buying and selling pressure and is often used to identify overbought or oversold conditions. The formula for MFI involves several steps:
1. Calculate the Typical Price (TP):
TP = (high + low + close) / 3
2. Calculate the Raw Money Flow (RMF):
Raw Money Flow = TP × Volume
3. Determine Positive and Negative Money Flow:
If the current TP is greater than the previous TP, it's Positive Money Flow.
If the current TP is less than the previous TP, it's Negative Money Flow.
4. Calculate the Money Flow Ratio (MFR):
Money Flow Ratio = Sum of Positive Money Flow (over n periods) / Sum of Negative Money Flow (over n periods)
5. Calculate the Money Flow Index (MFI):
MFI = 100 − (100 / (1 + Money Flow Ratio))
MFI above 80 can be considered as overbought, below 20 - oversold.
The Exponential Moving Average (EMA) is a type of moving average that places greater weight and significance on the most recent data points. It is widely used in technical analysis to smooth price data and identify trends more quickly than the Simple Moving Average (SMA).
Formula:
1. Calculate the multiplier
Multiplier = 2 / (n + 1) , Where n is the number of periods.
2. EMA Calculation
EMA = (Current Price) × Multiplier + (Previous EMA) × (1 − Multiplier)
This strategy leverages Fast period CCI, which shall break the zero line to the upside to say that probability of short term trend change to the upside increased. This zero line crossover shall be confirmed by the Middle and Slow periods CCI Indicators. At the moment of breakout these two CCIs shall be above 0, indicating that there is a high probability that price is in middle and long term uptrend. This approach increases chances to have a long trade setup in the direction of mid-term and long-term trends when the short-term trend starts to reverse to the upside.
Additionally strategy uses MFI to have a greater probability that fast CCI breakout is confirmed by this indicator. We consider the values of MFI above 50 as a higher probability that trend change from downtrend to the uptrend is real. Script opens long trades only if MFI is above 50. As you already know from the MFI description, it incorporates volume in its calculation, therefore we have another one confirmation factor.
Finally, strategy uses EMA an additional trend filter. It allows to open long trades only if price close above EMA (by default 50 period). It increases the probability of taking long trades only in the direction of the trend.
ATR is used to adjust the strategy risk management to the current market volatility. If volatility is low, we don’t need the large stop loss to understand the there is a high probability that we made a mistake opening the trade. User can setup the settings ATR Stop Loss and ATR Trailing Profit Activation Level to realize his own risk to reward preferences, but the unique feature of a strategy is that after reaching trailing profit activation level strategy is trying to follow the trend until it is likely to be finished instead of using fixed risk management settings. It allows sometimes to be involved in the large movements. It’s also important to make a note, that script uses another one EMA (by default = 20 period) as a trailing profit level.
Backtest Results
Operating window: Date range of backtests is 2022.04.01 - 2024.11.25. It is chosen to let the strategy to close all opened positions.
Commission and Slippage: Includes a standard Binance commission of 0.1% and accounts for possible slippage over 5 ticks.
Initial capital: 10000 USDT
Percent of capital used in every trade: 50%
Maximum Single Position Loss: -4.13%
Maximum Single Profit: +19.66%
Net Profit: +5421.21 USDT (+54.21%)
Total Trades: 108 (44.44% win rate)
Profit Factor: 2.006
Maximum Accumulated Loss: 777.40 USDT (-7.77%)
Average Profit per Trade: 50.20 USDT (+0.85%)
Average Trade Duration: 44 hours
These results are obtained with realistic parameters representing trading conditions observed at major exchanges such as Binance and with realistic trading portfolio usage parameters.
How to Use
Add the script to favorites for easy access.
Apply to the desired timeframe and chart (optimal performance observed on 2h BTC/USDT).
Configure settings using the dropdown choice list in the built-in menu.
Set up alerts to automate strategy positions through web hook with the text: {{strategy.order.alert_message}}
Disclaimer:
Educational and informational tool reflecting Skyrex commitment to informed trading. Past performance does not guarantee future results. Test strategies in a simulated environment before live implementation
