Kaufman Adaptive BandsIntroduction
Bands are quite efficient in technical analysis, they can provide support and resistance levels, provide breakouts points, trailing stop loss/take profits positions and can show the current market volatility to the user. Most of the time bands are made from a central tendency estimator like a moving average plus/minus a volatility indicator. Therefore bands can be made out of pretty much everything thus allowing for any kind of flavors.
So i propose a band indicator made from a Kaufman adaptive moving average using an estimate of the standard deviation.
Construction
The Kaufman moving average is an exponential averager using the efficiency ratio as smoothing variable, length control the period of kama and in order to provide more smoothness a power parameter has been introduced, higher values of power will return smoother results.
The volatility indicator is made from a biased estimation of the standard deviation by using the square root of the mean of the square minus the square of the mean method, except that we use kama instead of a mean.
The bands are made by adding/subtracting this volatility indicator with kama.
How To Use
The ability of the indicator to adapt to the current market state is what makes him a great tool for avoiding major exposition during ranging market, therefore the indicator will have a greater motion during trending market, or more simply the bands will move during trending markets while staying "flat" during ranging ones. Therefore the indicator might be more suited to breakouts, even if some cases will return what where turning points, this is particularly true during ranging markets.
Of course the efficiency ratio is not an "unbiased" trend metric indicator, it can consider high volatility markets as trending markets. Its one of his downsides.
High values of power will create smoother bands.
When using a low power parameter use an higher mult. In general using a low power value will make the bands move more freely as well as making them closer to each others.
Conclusion
At least the indicator is really nice to the eyes when using high power values, its ability to adapt to the market is a great addition to other more classical bands indicators, i also introduced a volatility estimator based on kama, some might have used the following estimation : kama(abs(price - kama)) which would have created a slower result. A trailing stop might be made from it if i see request about such addition.
If you are curious here are some more images of the indicator performing on different markets. Thanks for reading !
Cari dalam skrip untuk "band"

Triangular Moving Average (TMA) bandsWhat in the world is up folks ??!??
Here's the indicator of the day. Sharing a simple one today because I'm busy coding for a few clients (fun life of a top script author on TradingView)
The TMA bands is an indicator that I discovered on FXCM a few years ago FXCM TMA bands
From the screenshot above, we see that when the price hits the lower band, it's a possible reverse BUY signal. When it hits the upper band, it's a possible SELL signal
Methodology
1) The Take Profit 1 is the middle line, Take Profit 2 is the opposite band.
2) Once the TP1 is hit, set your Stop Loss to breakeven
3) Once the TP2 is hit, if you still want to stay in the trade, set your Stop Loss to the TP1
That's what we call a trailing stop loss which I offered in the Trade Manager : Trade-Manager-Open-Source-Version/
It will be a powerful tool in your arsenal for some scalp/intraday trades
After years of coding for traders, I worked with many brokers/API/languages so I'm very used to convert a script from a broker to another one (shameless self-advertising)
PS
Tomorrow I'll share the Signal version of my Algorithm Builder:
You'll be able to connect it in a single click to a very cool Backtest System made by the Pinescripters community
In other words, I'm selling the scripts to allow you to build your own signals in a few clicks AND to connect it easily to a kick-ass backtesting tool. More to come tomorrow
Hope you'll like it, like me, love it, love me, tip me :)
____________________________________________________________
Feel free to hit the thumbs up as it shows me that I'm not doing this for nothing and will motivate to deliver more quality content in the future. (Meaning... a few likes only = no indicators = Dave enjoying the beach)
- I'm an officially approved PineEditor/LUA/MT4 approved mentor on codementor. You can request a coaching with me if you want and I'll teach you how to build kick-ass indicators and strategies
Jump on a 1 to 1 coaching with me
- You can also hire for a custom dev of your indicator/strategy/bot/chrome extension/python

[JR] Multi Bollinger Heat Bands - EMA/Breakout optionsA little, yet hopefully useful update over my previous "Multi Bollinger Heat Bands". For those who like quick visual cue's.
In short: It's your Basic Bollinger Bands, but 3 of them, and some pointy things.
In full:
Three stacked SMA based Bollinger Bands designed just to give you a quick visual on the "heat" of movement.
Set inner band as you would expect, then set your preferred additional multiplier increments for the outer 2 bands.
Option to use EMA as alternative basis, rather than SMA.
Breakout indication shapes, which have their own multiplier (but still tied to same length/period as the BB's) so you can make them pop on their own separate "band".

Bollinger Bands Breakout StrategyHey guys check out this strategy script.
Chart plotting:
I use a classic plot of Bollinger Bands to define a consolidation zone, I also use a separate Trend Filter (SMA).
Logic:
When the price is above the SMA and above the Bollinger Upper Band the strategy goes Long. When the price is below the SMA and below the Bollinger Lower Band the strategy goes Short. Simple.
Exits:
TP and SL are a percentage of the price.
Notes: This simple strategy can be used at any timeframe (I prefer the 15min for day trading). It avoids consolidation, when the price is inside the Bollinger Bands, and has a good success rate. Adjust the Length of the BB to suit your style of trading (Lower numbers=more volatile, Higher numbers=more restrictive). Also you can adjust the Trend Filter SMA, I presonally chose the 50 SMA. Finally the SL/TP can be also adjusted from the input menu.
Test it for yourself!
Have great trades!

Adaptive Gap Bands - DolphinTradeBot1️⃣ Overview
Adaptive Gap Bands is a momentum indicator that measures the percentage difference between fast and slow moving averages. This helps identify potential overbought or oversold zones.
The goal is to analyze “gap” behaviors within a trend and generate clearer entry–exit signals.
Since the bands are anchored to the slow moving average, they are more sensitive to the trend direction, making signals stronger in line with the prevailing trend.
📌 Signals do not repaint — once confirmed, they remain fixed on the chart.
2️⃣ How It Works ?
The indicator tracks the distance between fast and slow MAs.
The indicator measures the percentage gap between the fast and slow moving averages, relative to the slow MA.
Each time the gap reaches a new extreme during a swing, that value is stored.
When the averages cross, the stored values from the last N swings (defined by Swing Count) are collected.
These gap values are then averaged to create a smoother and more adaptive reference.
The bands are built by multiplying this average gap with the % Multiplier and projecting it around the slow MA.
3️⃣ How to Use It ?
Add the script to your chart.
Green label → potential Long signal.
Red label → potential Short signal.
Signals often appear when price moves outside the adaptive bands, showing extreme momentum.
Can also be used as a reference tool in manual trades to set profit/loss expectations.
By comparing upward vs. downward gaps, it can help analyze and confirm the dominant trend direction.
4️⃣⚙️ Settings
Swing Count → Number of past swings considered.
% Multiplier → Adjusts band width (narrower or wider).
MA Lengths & Types → Choose fast and slow moving averages (EMA, SMA, RMA, etc.).

Ultimate Bands [BigBeluga]Ultimate Bands
The Ultimate Bands indicator is an advanced technical analysis tool that combines elements of volatility bands, oscillators, and trend analysis. It provides traders with a comprehensive view of market conditions, including trend direction, momentum, and potential reversal points.
🔵 KEY FEATURES
● Ultimate Bands
Consists of an upper band, lower band, and a smooth middle line
Based on John Ehler's SuperSmoother algorithm for reduced lag
Bands are calculated using Root Mean Square Deviation (RMSD) for adaptive volatility measurement
Helps identify potential support and resistance levels
● Ultimate Oscillator
Derived from the price position relative to the Ultimate Bands
Oscillates between overbought and oversold levels
Provides insights into potential reversals and trend strength
● Trend Signal Line
Based on a Hull Moving Average (HMA) of the Ultimate Oscillator
Helps identify the overall trend direction
Color-coded for easy trend interpretation
● Heatmap Visualization
Displays the current state of the oscillator and trend signal
Provides an intuitive visual representation of market conditions
Shows overbought/oversold status and trend direction at a glance
● Breakout Signals
Optional feature to detect and display breakouts beyond the Ultimate Bands
Helps identify potential trend reversals or continuations
Visualized with arrows on the chart and color-coded candles
🔵 HOW TO USE
● Trend Identification
Use the color and position of the Trend Signal Line to determine the overall market trend
Refer to the heatmap for a quick visual confirmation of trend direction
● Entry Signals
Look for price touches or breaks of the Ultimate Bands for potential entry points
Use oscillator extremes in conjunction with band touches for stronger signals
Consider breakout signals (if enabled) for trend-following entries
● Exit Signals
Use opposite band touches or breakouts as potential exit points
Monitor the oscillator for divergences or extreme readings as exit signals
● Overbought/Oversold Analysis
Use the Ultimate Oscillator and heatmap to identify overbought/oversold conditions
Look for potential reversals when the oscillator reaches extreme levels
● Confirmation
Combine Ultimate Bands, Oscillator, and Trend Signal for stronger trade confirmation
Use the heatmap for quick visual confirmation of market conditions
🔵 CUSTOMIZATION
The Ultimate Bands indicator offers several customization options:
Adjust the main calculation length for bands and oscillator
Modify the number of standard deviations for band calculation
Change the signal line length for trend analysis
Toggle the display of breakout signals and candle coloring
By fine-tuning these settings, traders can adapt the Ultimate Bands indicator to various market conditions and personal trading strategies.
The Ultimate Bands indicator provides a multi-faceted approach to market analysis, combining volatility-based bands, oscillator analysis, and trend identification in one comprehensive tool. Its adaptive nature and visual cues make it suitable for both novice and experienced traders across various timeframes and markets. The integration of multiple analytical elements offers traders a rich set of data points to inform their trading decisions.

Fibonacci Volatility BandsFibonacci Volatility Bands are just an alternative that allows for more margin than regular Bollinger Bands. They are created based on an average of moving averages that use the Fibonacci sequence as lookback periods.
The use of the Fibonacci Volatility Bands is exactly the same as the Bollinger Bands.

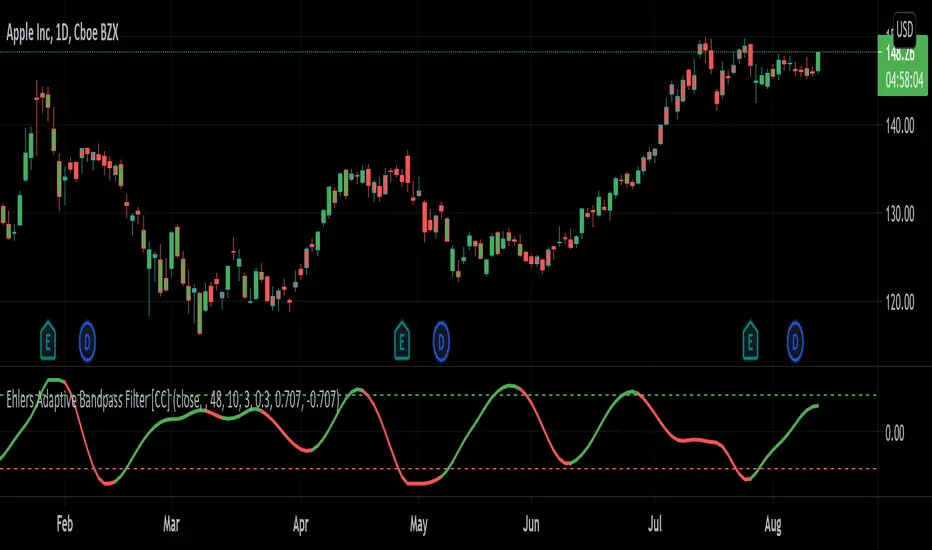
Ehlers Cycle BandPass Filter [CC]The Cycle BandPass Filter was created by John Ehlers (Cycle Modes and Trend Modes) and this is an alternate to the default BandPass Filter by changing some settings. This will be another series I will be introducing showing some indicators created by Ehlers and that didn't get much attention. This identifies the underlying cycle in the price data and these indicators aren't very common so I want to introduce more of these to tv. Buying and selling with these indicators can be a bit tricky but overall what Ehlers recommends is to buy at the lowest point and sell at the highest point to capture the underlying cycle. I have included strong buy and sell signals as darker colors and normal signals as lighter colors. Buy when the line turns green and sell when it turns red.
Let me know if there are any other scripts you would like to see me publish!

Ehlers Adaptive Bandpass Filter [CC]The Adaptive Bandpass Filter was created by John Ehlers (Cycle Analytics For Traders pgs 153-156) and this uses his autocorrelation code to provide the adaptive lengths to use for the underlying bandpass filter. The bandpass filter is a common way in digital signal processing to filter out the underlying noise in the data. It can actually be turned into a leading indicator by changing the bw variable to a smaller amount. Since this indicator is adaptive using the cycle period, the buy and sell signals are different compared to the normal bandpass filter. Buy signals for this indicator according to Ehlers are when the line is red and the line is under the oversold line (also red) then you buy when the indicator line turns green and then you exit when the indicator line turns red and is above the overbought line. This indicator doesn't provide clear buy and sell signals in all circumstances but generally speaking buy when the indicator line turns green and sell when it turns red. Feel free to experiment with this one.
Let me know if there are any other scripts you would like to see me publish!
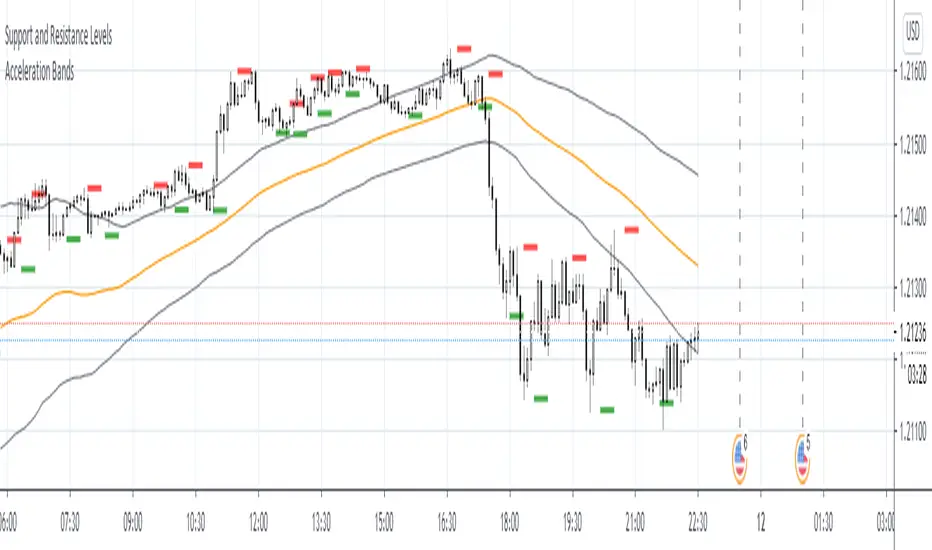
Acceleration BandsAcceleration Bands
Description:
Acceleration Bands serve as a trading envelope that factor in an assets typical volatility over standard settings of 20 or 80 bars. They can be used across any time period, though traders prefer to use them most across weekly and monthly timeframes as breakout indicators outside these bands.
Using the shorter time frames can define likely support and resistance levels at the lower and upper Acceleration Bands.
Entry is usually made at the breakout point. Once the price closes back within the Acceleration Bands, this is taken as a signal that the acceleration period is over and it’s best to close out the trade.
Lane Bandpass Filter OscillatorThis is a bandpass filter oscillator that has an additional tuning parameter
in addition to the Period used by John Ehlers. It is 'quality' which has meaning
in a frequency/magnitude sense (See Q in line 7). The bandpass is slower
according to the inverse of Q.
The concept was developed by John Lane etal in the text 'DSP Filters'
The bandpass filter works better in a trending environment.

Volatility Bands by DGTVolatility represents how large an asset's prices swing around the mean price, the degree of variation of a trading price over time, and is commonly measured with beta (β) coefficients, standard deviations (σ) of returns where tools such as Average True Range, Bollinger Bands, Keltner Channel, Squeeze Indicator, etc presents volatility concept
Volatility often refers to the amount of uncertainty or risk related to the size of changes in a security's value. The higher the volatility, the riskier the security - the price of the security can change dramatically over a short time period in either direction. A lower volatility - security's value does not fluctuate dramatically, and tends to be more steady
This study, Volatility Bands , attempts to present a way to measure and visualize volatility , using standard deviations (σ) and average true range indicator, and aims to point out areas that might indicate potential trading opportunities
I will try to explain the usage with examples,
same setup with different option selected
as you may observe from the examples different setting may have advantages and disadvantages over one another, it is recommended to verify a trading setup with different available options.
Additionally, It is recommended to use this indicator in conjunction with other technical indicators, or verify using chart/candle patterns. Below is an usage example using in conjunction with other indicator, in the given example “Neglected Volume by DGT” is selected
Similarities and Differences
Bollinger Bands depicts two standard deviations above and below a simple moving average, and Keltner Channel depicts two times average true range (ATR) above and below an exponential moving average
Volatility Bands study combines the approach of both Bollinger Bands and Keltner Channel, with different settings and different visualization
Default settings are one standard deviations and one time average true range (ATR) above and below 13 period exponential moving average. Setting can be adjusted by users but let me remind all testes are performed with the default settings.
Mathematically expressed as
Upper band area between “ema + stdev” and “ema + atr”
Lower band area between “ema – stdev” and “ema – atr”
A different display is added with the inspiration I get from one of the @quantgym ‘s study, many thanks @quantgym 😉
When difference band display is selected the study will reflect the area between “ema + stdev – atr” and “ema – stdev + atr”. As shown in the examples above
Note: standard deviation calculation can be adjusted based on price action or its moving average.
Other differentiation between BB and KC is with V-BANDS mostly we look for trade opportunities when price action move out of the bands and in most cases we assume market is consolidating when the price action is within the bands
The other indicator that presents similarities to Volatility Bands is Squeeze Indicator, which measures the relationship between Bollinger Bands and Keltner's Channels to help identify consolidations and signal when prices are likely to break out. Mainly Volatility Bands is different version of Squeeze indicator, in fact the purpose is almost same but visualization is completely different. Additionally Volatility Bands Offers trading opportunities whereas Squeeze indicator only presents market states unless a momentum indicator is adapted to Squeeze indicator.
Disclaimer:
Trading success is all about following your trading strategy and the indicators should fit within your trading strategy, and not to be traded upon solely
The script is for informational and educational purposes only. Use of the script does not constitute professional and/or financial advice. You alone have the sole responsibility of evaluating the script output and risks associated with the use of the script. In exchange for using the script, you agree not to hold dgtrd TradingView user liable for any possible claim for damages arising from any decision you make based on use of the script

Colour Coded Bollinger BandsBollinger Bands coloured to more clearly show periods of contraction and expansion. Green filled bands indicate expansion/increasing bandwidth, and red fill indicates contraction/decreasing bandwidth.
Flagging BandsIntroduction
A pun between the word flag and the adjective flagging (less dynamic) , this indicator have two bands who react faster when in contact to the price. Imagine you are under sheets, if you abruptly rise, the sheets will instantaneously go up, then if you abruptly get down, the sheets will fall slowly until being in contact with a surface, this is because of a type of friction called drag or air resistance , this force is described in fluid dynamics and i inspired myself from that for the creation of the indicator.
The indicator
The indicator is made of two bands, one upper band and one lower band, then a weighted average of each bands, this average is weighted depending on which band the price is closer. The length control the period of the indicator, in general higher lengths will create wider bands, you must consider that this parameter behave differently than other ones and may create slower results in comparison with other bands indicators while having the same length period.
The indicator can use a simple breakout methodology (see trailing stop part) but can sometime provide support and resistance points, in fact i believe that when the average variability/volatility of band A is higher than the average variability/volatility of band B and that the price cross band B then price will reverse its direction, this claim is not justified, research is needed.
Trailing Stop Mod
It is possible to make the indicator act as a trailing stop, in order to do so just tick the trailing stop mod box.
The average/bands will automatically disappear being replaced by the trailing stop.
Conclusion
I was just playing around when making the skeleton of the indicator, i hope the code is easy to understand, if you need some kind of explanation just pm me, i'm always open to help people/receive suggestions.
Best Regards


[JR] Multi Bollinger Heat BandsBollinger Bands, with incremented additional outer bands.
Set as you would normally, but with the addition of an incremental value for the added outer bands.
Defaults with Length 20, base multiplier of 2.0, and an Increment value of 0.5 for additional outer bands at 2.5 and 3.0. Adjust values to suite your needs.
All lines and zones have colour and formatting options available - because why not eh?

[RS][JR]RSI Price BandsRSI Price Bands
By Ricardo Santos and JR
Have you ever wondered what RSI would look like as a Band? Well here it is. First premier Trading View special, RSI Price Band. Red shows overbought and Green shows oversold. You can also adjust what levels you prefer for overbought and oversold, and what additional RSI lengths you would like to see displayed on the chart..

Indicators: Hurst Bands and Hurst OscillatorThese 2 indicators are derivative work from Jim Hurst's book - "The Magic of Stock Transaction Timing".
The bands are % bands around a median that gets calculated according to Hurst's formula. The outer bands (called ExtremeBands) signify extreme overbought/oversold conditions. Inner bands signify potential pullback points. As you can see, they also act as dynamic S/R levels.
The oscillator bands match the bands overlaid on price, so you will get an excellent indication of where the price is gonna do by using the oscillator along with the bands. Note that Hurst Oscillator can be used separately too, there is no technical dependency on Hurst Bands.
More info on Hurst Method:
www.readtheticker.com

Multi Timeframe 7 Bollinger Bands by CSPMulti Timeframe 7 Bollinger Bands by CSP IT SHOW 1MT,5MT,10MT,1HR,D, W,M BOLLINGER BAND IN ASINGLE CHART.
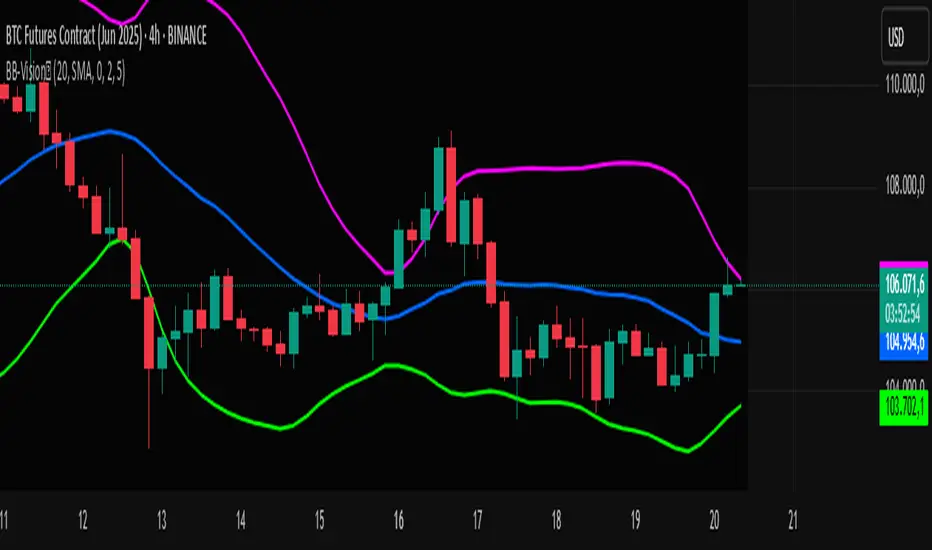
Bands Vision-XBands Vision-X (BB-Vision-X) – Full Description
Description:
Bands Vision-X is an indicator based on dynamic bands constructed from customizable moving averages and standard deviation, allowing you to visualize potential support and resistance zones, volatility, and market conditions. It uses an adjustable moving average (with multiple options such as SMA, EMA, WMA, JMA, LSMA, DEMA, and TEMA) to define the central line, and upper and lower bands calculated by standard deviation multiplied by an adjustable factor. The bands are smoothed by a Hull Moving Average (HMA) to reduce noise and improve clarity.
How to Use
The bands indicate potential support and resistance levels.
The central line serves as a dynamic price reference.
The distance between bands reflects market volatility.
Touches or breakouts of the bands may signal entry or exit opportunities.
Parameters
Parameter Description Default
Standard Error Band Period Period for moving average and standard deviation 20
Moving Average Type Type of moving average (SMA, EMA, etc.) SMA
Standard Deviation Multiplier Multiplier for standard deviation 2.0
Band Lines Smoothing Period Period for smoothing the bands (HMA) 5
Technical Notes
The JMA function used is not the original Jurik version but an approximate and open implementation based on publicly available TradingView community code.
Developed in Pine Script v6 with optimized and clean code.
Recommendations
Ideal for traders seeking a clear view of volatility and dynamic support/resistance levels.
Should not be used in isolation; it is recommended to combine with volume analysis, price action, or other technical indicators.
Adjust the period and multiplier according to the asset and timeframe for better effectiveness.
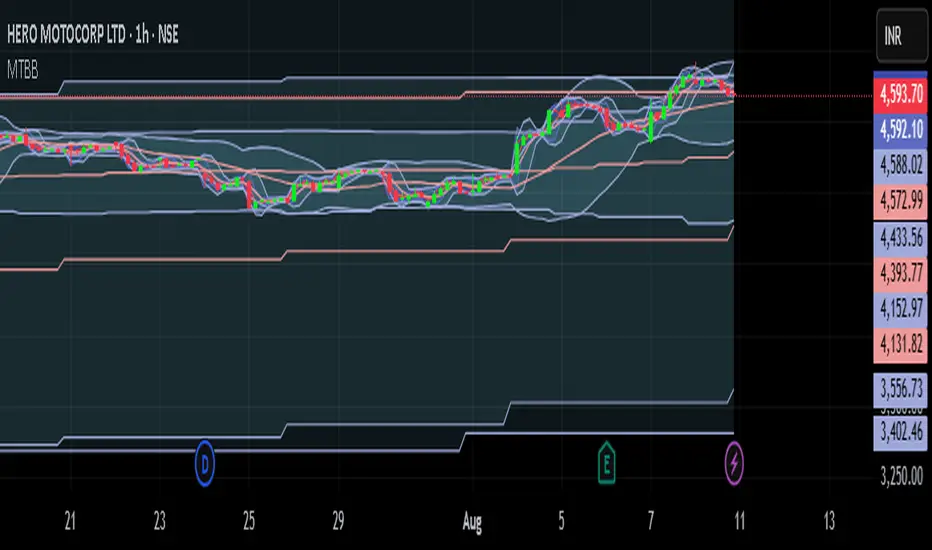
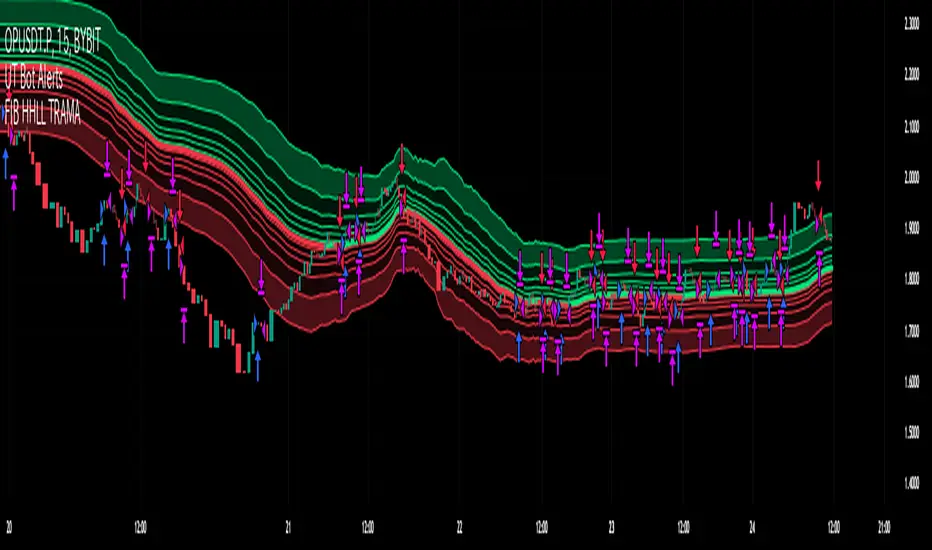
Fibonacci HH LL TRAMA BandLuxAlgo's Trend Moving Adaptive Moving Average was used as a reference to create bands by reading the highest and lowest prices of past bars based on Fibonacci numbers and then multiplying them by the Fibonacci ratio.
LuxAlgo/ LuxAlgo/
In particular, the so-called TRAMA is characterized by its adaptation to the average of the highest and lowest prices over a specific period of time and is used to identify support/resistance.
In order to apply this feature to the maximum extent possible, I used the high or low prices as the source of input, rather than the closing price.
For example,
src = high
not original like
src = close
In addition, I created 6 levels by multiplying the Fibonacci ratio
//Midline
mah = ama1
mal = ama2
m = (mah + mal)/2
//Half Mean Range
dist = (mah - mal)/2
//Levels
h6 = m + dist * 11.089
h5 = m + dist * 6.857
h4 = m + dist * 4.235
h3 = m + dist * 2.618
h2 = m + dist * 1.618
h1 = m + dist * 0.618
l1 = m - dist * 0.618
l2 = m - dist * 1.618
l3 = m - dist * 2.618
l4 = m - dist * 4.235
l5 = m - dist * 6.857
l6 = m - dist * 11.089
If you want to use it for scalping, such as 15 minutes, you can include Fibonacci numbers such as 21,34,55 for a quick reaction type to detect the trend. Also, by including Fibonacci numbers such as 89,144,233, you can see where you stand in the larger trend. Some examples are included below.
For Investors
BTCUSDT 1day Chart Fibonacci number "55"
For Daytraders
BTCUSDT 4hour Chart Fibonacci number "34"
For Scalpers
BTCUSDT 15min Chart Fibonacci number "55"
BTCUSDT 15min Chart Fibonacci number "89"
BTCUSDT 15min Chart Fibonacci number "233"
Fibonacci numbers are 1, 1, 2, 3, 5, 8, 13, 21, 34, 55, 89, 144, 233, 377, 610, etc.,
Fibonacci ratios are 0.618, 1.618, 2.618, 4.236, 6.854, 11.089, etc.,
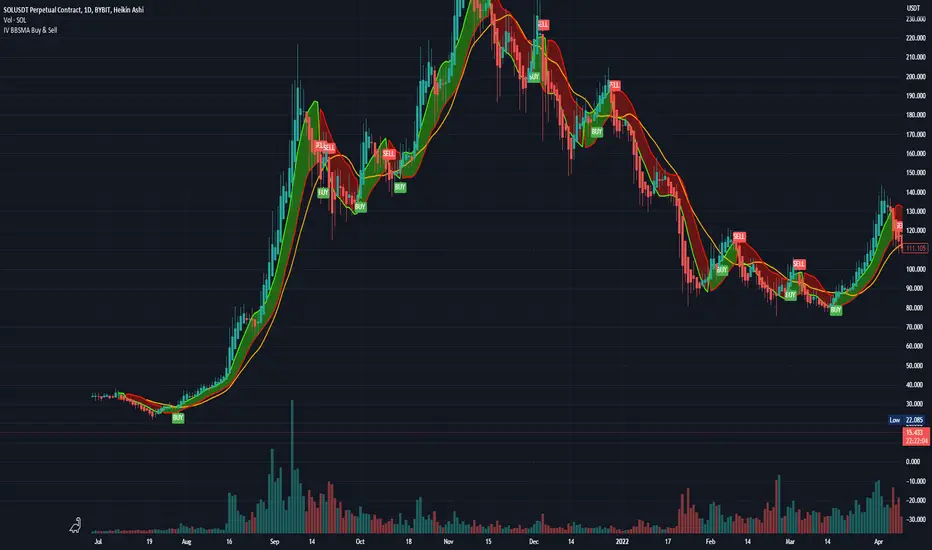
Bollinger Bands and SMA Channel Buy and Sell
This Indicator is a combination of a standard BB indicator incorporated with a SSL Channel by ErwinBeckers which is Simple Moving average with a length of set at 10 (Default) and calculates the high and low set for the default 10 to form a Channel.
The Settings for the Bollinger Band is the standard settings on a normal Bollinger Band - Length 20, source close and Standard dev 2
The setting for the SMA is length 10 and the high and low calculated or that length to form a channel.
The SMA Channel gives a green line for the Up channel and the Red line for the down Channel.
The basis of the indicator is that the Candle close above the Basis line of the BB and the SMA green line will give a buy indicator
and the same for Sell indicator the candle close below the basis BB and the SMA line Red will give a Sell indicator.
Please note that this indicator is a mix of 2 basic indicators found in Trading view, giving Buy and Sell indicators to make things easier to not look for this visually.
This code will be open source for anyone to use or back test or use it for whatever they want.
This code is for my own personal trading and cannot be relied upon. This indicator cannot be used and cannot guarantee anything, and caution should always be taken when trading. Use this with other indicators to give certanty.
Again use this for Paper Trading only.
I want to thank TradingView for its platform that facilitates development and learning.
Ultimate Moving Average Bands [CC+RedK]The Ultimate Moving Average Bands were created by me and @RedKTrader and this converts our Ultimate Moving Average into volatility bands that use the same adaptive logic to create the bands. I have enabled everything to be fully adjustable so please let me know if you find a more useful setting than what I have here by default. I'm sure everyone is familiar with volatility bands but generally speaking if a price goes above the volatility bands then this is either a sign of an extremely strong uptrend or a potential reversal point and vice versa. I have included strong buy and sell signals in addition to normal ones so darker colors are strong signals and lighter colors are normal ones. Buy when the lines turn green and sell when they turn red.
Let me know if there are any other scripts you would like to see me publish!
