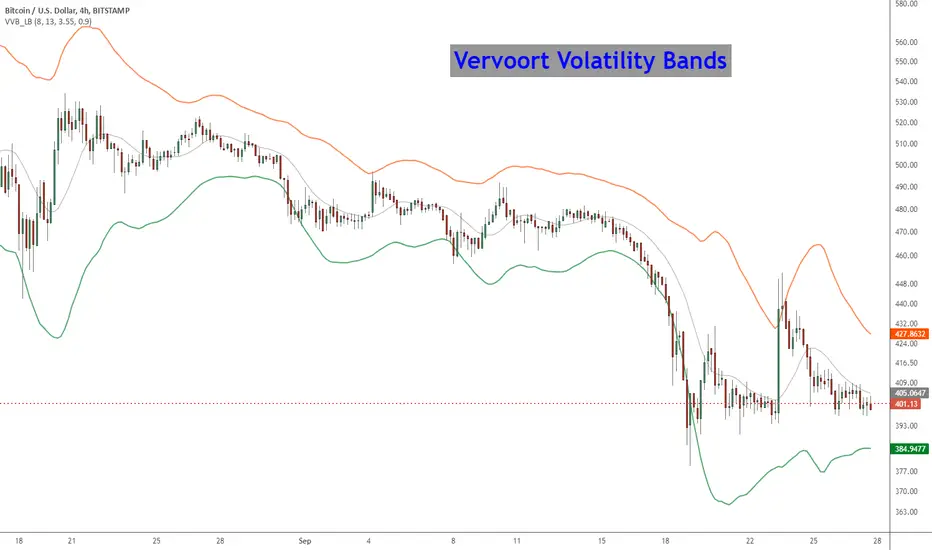
Volatility Adjusted Bands - JD This indicator gives a likely trading range based on the volatility of the past x amount of bars, measured against a certain moving average.
The indicator can be used as an alternative for BBands.
It gives approx. the same "trend-side" lines (upper line in uptrend, lower line in down trend) as the Bollinger Bands, but the opposite line follows closer on price,
Instead of "flying out" to the other direction like in BBands.
As a comparison, the BBands for the same length (50 period) are added on the chart.
JD.
#NotTradingAdvice #DYOR
I build these indicators for myself and provide them open source, to use for free to use and improve upon,
as I believe the best way to learn is toghether.
Cari dalam skrip untuk "bands"
Auto-Dispersion BandsIntroduction
A really old indicator as well, thus i have no much ideas of what is going on with it, but i know that those bands returns good reversals points. The indicator don't use standard deviation, instead its a simple differencing of the price and the price length bars back who will provide a dispersion measurement, thus the name auto-dispersion.
The Indicator
The smooth parameter allow the band to cross the price, if smooth is low the chance of crosses are lower.
smooth = 3
Bollinger Bands MTF [LonesomeTheBlue]With this script you can follow Bollinger Bands for current and higher time frame together. Higher time frame is calculated by script.
if current period
1m => higher period=5m
3m => higher period=5m
5m => higher period=15m
15m => higher period=1h
30m => higher period=1h
45m => higher period=1h
1h => higher period=4h
2h => higher period=4h
3h => higher period=4h
4h => higher period=1day
1day => higher period=1week
Trend Trader Bands Strategy This is plots the indicator developed by Andrew Abraham
in the Trading the Trend article of TASC September 1998
It was modified, result values wass averages.
And draw two bands above and below TT line.
Percentage BandsA different version of bollinger bands, I use percentage difference instead of standard deviation.
Trend Trader Bands This is plots the indicator developed by Andrew Abraham
in the Trading the Trend article of TASC September 1998
It was modified, result values wass averages.
And draw two bands above and below TT line.
Standard Error Bandswith the best settings - this indicator is a better version of the bollinger bands, because it uses a linear regression .
Use this carefully and with other indicators.
Candles + Golden Cross + RSI BANDSThis script combines three scripts for ease of use
RSI Bands LazyBear
Golden Cross MichMexTrading
Candlestick patterns identified repo32
I combined them because they work exceptionally well together in identifying reversals and other potential changes
Prime Number Bands Strategy Determining market trends has become a science even though a high number
or people still believe it’s a gambling game. Mathematicians, technicians,
brokers and investors have worked together in developing quite several
indicators to help them better understand and forecast market movements.
The Prime Number Bands indicator was developed by Modulus Financial Engineering
Inc. This indicator is charted by indentifying the highest and lowest prime number
in the neighborhood and plotting the two series as a band.
WARNING:
- This script to change bars colors.
VWMA Keltner BandsKind of like Keltner Channel/Bands (stockcharts.com) but using VWMA instead so that volume is taken in to account.
Outside the upper band can considered to be 'overbought' and outside the lower band can be considered to be 'oversold'
Has option to highlight signals (i.e. when price closes outside a channel) and also the option to only display signals if the price is on the correct side of VWAP (i.e. no sell signals if price is above VWAP)
Acceleration BandsAcceleration Bands indicator script. This indicator was originally developed by Price Headley.
(YEK) Bollinger Bands & DoubleHMA & MA CrossMy favorite indicators ALL-IN-1: Bollinger Bands, Double Hull Moving Average (21,8), Double Moving Average (200,50)
Volume Weighted Average Range Bands [DW]This is an experimental study designed to identify the underlying trend bias and volatility of an instrument over any custom interval TradingView supports.
First, reset points are established at points where the opening price of the interval changes.
Next, Volume Weighted Average Price (VWAP) is calculated. It is the cumulative sum of typical price times volume divided by the cumulative volume. The cumulation starts over upon each reset point.
After that, Volume Weighted Average Range (VWAR) is calculated. The formula structure is the same as VWAP, except using range rather than typical price.
Lastly, the bands are calculated by multiplying the VWAR by the specified multiplier (approximate Golden Ratio by default) and by 1 through 5, then adding to and subtracting from the VWAP.
Custom Bar Colors are included.
Fractal Chaos Bands Backtest The FCB indicator looks back in time depending on the number of time periods trader selected
to plot the indicator. The upper fractal line is made by plotting stock price highs and the
lower fractal line is made by plotting stock price lows. Essentially, the Fractal Chaos Bands
show an overall panorama of the price movement, as they filter out the insignificant fluctuations
of the stock price.
You can change long to short in the Input Settings
WARNING:
- For purpose educate only
- This script to change bars colors.
Ichimoku And DD Bollinger BandsIchimoku System Plus Double Bolliner Bands
Made in Mexico City with Love.
Kaufman's Adaptive Moving Average BandsKaufman's Adaptive Moving Average with 6 Bands at a time and trend direction.
Fibonacci BandsCreates bands based on Fibonacci numbers and the SMA.
Based on indicator by Big Mike on futures.io
How to trade
- Best to use in ranging market conditions
- Place on two different time frames eg. 15 and 55 min.
- Take trades off either short or long term chart.
- Best trades occur when both charts show same trigger/condition.
- Trades are short term reversals in direction of major trend on longer term chart unless you expect a trend reversal.
- Determine which band is the limiting band for the volatility of the instrument.
- When the market closes outside of the limiting band then returns inside, take a long/short one tick above/below the high/low of the previous bar.
- Place stop below/above the low/high of the the recent swing low/high.
- Set targets at opposite band of chart