KELTNER BREAKOUT STRATEGY FOR CRYPTO ASSETS 1. Philosophy: The "Volatility Breakout"
The core philosophy is that **momentum precedes price**. By waiting for a break above the Keltner Channel, you aren't just betting that the price will go up; you are betting that the price has enough energy (volatility) to move outside its standard deviation.
Asset Class Suitability: This strategy is specifically designed for **Cryptocurrencies**. Because Crypto often moves in parabolic cycles with high volatility, it can sustain the "overextended" moves required to stay outside the Keltner Channels.
Why not FX or Stocks? Traditional markets like Forex are typically mean-reverting, and Stocks often have "gap" risks or lower intraday volatility. In those markets, hitting the upper KC band often signals exhaustion. In Crypto, it’s often the signal that the "real" move is starting.
The "Let Winners Run" Mantra: No fixed Take Profit (TP) allows you to capture "fat-tail" returns—those rare, massive trends that make up the bulk of a trend-follower's profits.
2. Background: The Components
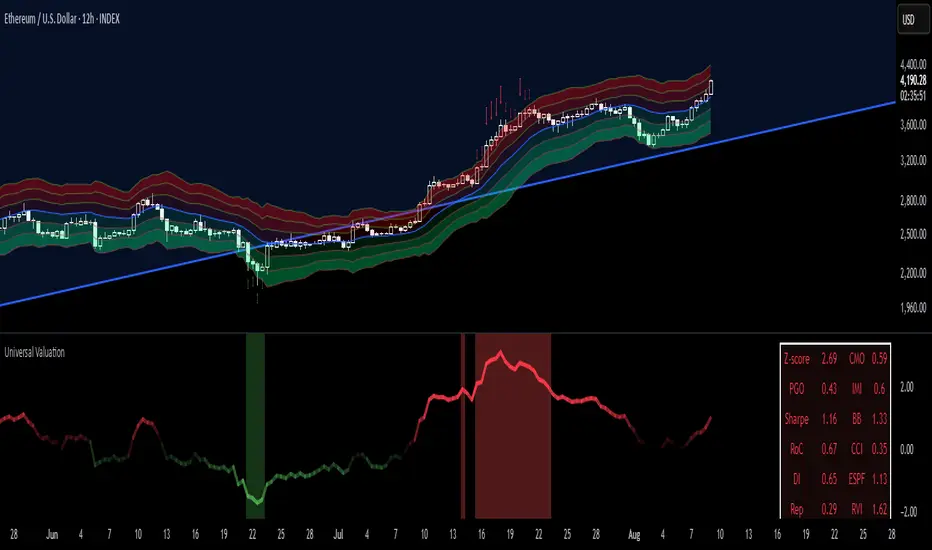
*Keltner Channels: Uses Average True Range (ATR) rather than standard deviation. This makes the bands more representative of actual price action and volatility gaps common in crypto.
The 100 MA Anchor: The 100-period Simple Moving Average acts as the "line in the sand." It filters out noise and provides a trailing exit that only triggers when the macro trend has officially shifted.
3. Trading Cheat Sheet (Copy-Paste Ready)
Market Environment
Asset Focus: Crypto Only (High Volatility assets).
Trend Filter: Price must be outside the KC 100 bands to confirm a macro trend.
Long Setup (Buy)
Macro Requirement: Price must be trading ABOVE the KC 100 Upper Band.
Entry Trigger: Price crosses ABOVE the KC 20 Upper Band.
Mandatory Exit: Price closes BELOW the MA 100.
Short Setup (Sell)
Macro Requirement: Price must be trading BELOW the KC 100 Lower Band.
Entry Trigger: Price crosses BELOW the KC 20 Lower Band.
Mandatory Exit: Price closes ABOVE the MA 100.
Risk Management
Take Profit: None (Trend-following approach).
Stop Loss: Trailing via the MA 100.
Strategi Pine Script®