JOPA Channel (Dual-Volumed) v1 [JopAlgo]JOPA Channel (Dual-Volumed) v1
Short title: JOPAV1 • License: MPL-2.0 • Provider: JopAlgo
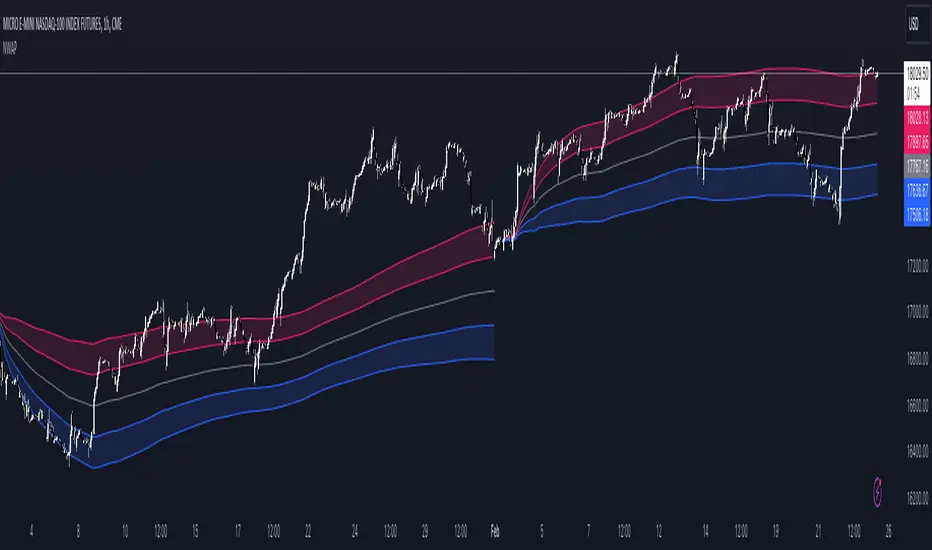
We have developed our own, first channel-based trading indicator and we’re making it available to all traders. The goal was a channel that breathes with the tape—built on a volume-weighted backbone—so the outcome stays lively instead of static. That led to the JOPA Channel.
All important features (at a glance)
In one line: A Rolling-VWAP channel whose width adapts with two volumes (RVOL + dollar-flow), adds order-flow asymmetry (OBV tilt) and regime awareness (Efficiency Ratio), and frames risk with outer containment bands from residual extremes—so you see fair value, momentum, and exhaustion in one view.
Feature list
Rolling VWAP centerline: Tracks where volume traded (fair value).
Dual-volume width: Bands expand/contract with relative volume and value traded (price×volume).
OBV tilt: Upper/lower widths skew toward the side actually pushing.
Regime adapter (ER): Tighter in trend, wider in chop—automatically.
Outer containment rails: Residual-extreme ceilings/floors, smoothed + margin.
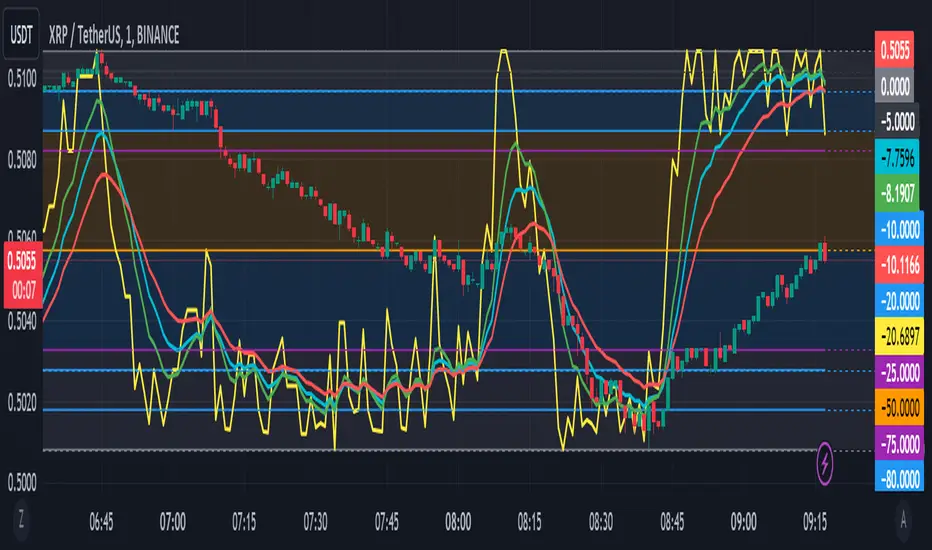
20% / 80% guides: 20% light blue (discount), 80% light red (premium).
Squeeze dots (optional): Orange circles below candles during compression.
Non-repainting: Uses rolling sums and past-only math; no lookahead.
Default visual in this release
Containment rails + fill: ON (stepline, medium).
Inner Value rails + fill: Rails OFF (stepline, thin), fill ON (drawn only if rails are shown).
20% & 80% guides: ON (dashed, thin; 20% light blue, 80% light red).
Squeeze dots: OFF by default (orange circles when enabled).
What you see on the chart
RVWAP (centerline): Your compass for fair value.
Inner Value Bands (optional): Tight rails for breakouts and pullback timing.
Outer Containment Bands (default ON): High-confidence ceilings/floors for targets and fades.
20% / 80% guides: Quick read of “where in the channel” price is sitting.
Squeeze dots (optional): Volatility compression heads-up (no text labels).
Non-repainting note: The indicator does not revise closed bars. Forecast-Lock uses linear regression to extrapolate 1–3 bars ahead without using future data.
How to use it
Core reads (works on any timeframe)
Bias: Above a rising RVWAP → long bias; below a falling RVWAP → short bias.
Breakouts (momentum): Close beyond an Inner Value rail with RVOL ≥ threshold (alert provided).
Reversions (fades): Tag Outer Containment, stall, then close back inside → expect mean reversion toward RVWAP.
20/80 timing:
At/above 80% (light red) → premium/exhaustion risk; trim longs or consider fades if RVOL cools.
At/below 20% (light blue) → discount/exhaustion risk; trim shorts or consider longs if RVOL cools.
Squeeze clusters: When dots bunch up, expect a range break; use the Breakout alert as confirmation.
Playbooks by trading style
Day Trading (1–5m)
Setup: Keep the chart clean (Containment ON, Value rails OFF). Toggle Inner Value ON when hunting a breakout or timing a pullback.
Pullback Long: Dip to RVWAP / Lower Value with sub-threshold RVOL, then a close back above RVWAP → long.
Stop: Just beyond Lower Containment or the pullback swing.
Targets (1:1:1): ⅓ at RVWAP, ⅓ at Upper Value, ⅓ trail toward Upper Containment.
Breakout Long: After a squeeze cluster, take the Breakout Long alert (close > Upper Value, RVOL ≥ min). If no retest, demand the next bar holds outside.
Range Fade: Only when RVWAP is flat and dots cluster; short Upper Containment → RVWAP (mirror for longs at the lower rail).
Intraday (15m–1H)
HTF compass: Take bias from 4H.
Pullback Long: “Touch & reclaim” of RVWAP while RVOL cools; enter on the reclaim close or break of that candle’s high.
Breakout: Run Inner Value ON; act on Breakout alerts (RVOL gate ≈ 1.10–1.15 typical).
Avoid low-probability fades against the 4H slope unless RVWAP is flat.
Swing (4H–1D)
Continuation: In uptrends, buy pullbacks to RVWAP / Lower Value with sub-threshold RVOL; scale at Upper Containment.
Adds: Post-squeeze Breakout Long adds; trail on RVWAP or Lower Value.
Fades: Prefer when RVWAP flattens and price oscillates between containments.
Position (1D+)
Framework: Daily RVWAP slope + position within containment.
Add rule: Each reclaim of RVWAP after a dip is an add; trim into Upper Containment or near 80% light red.
Sizing: Containment distance is larger—size down and trail on RVWAP.
Inputs & Settings (complete)
Core
Source: Price input for RVWAP.
Rolling VWAP Length: Window of the centerline (higher = smoother).
Volume Baseline (RVOL): SMA window for relative volume.
Inner Value Bands (volatility-based width)
k·StdDev(residuals), k·ATR, k·MAD(residuals): Blend three measures into base width.
StdDev / ATR / MAD Lengths: Lookbacks for each.
Two-Volume Fusion
RVOL Exponent: How aggressively width responds to relative volume.
Dollar-Flow Gain: Adds push from price×volume (value traded).
Dollar-Flow Z-Window: Standardization window for dollar-flow.
Asymmetry (Order-Flow Tilt)
Enable Tilt (OBV): Lets flow skew upper/lower widths.
Tilt Strength (0..1): Gain applied to OBV slope z-score.
OBV Slope Z-Window: Window to standardize OBV slope.
Regime Adapter
Efficiency Ratio Lookback: Measures trend vs chop.
ER Width Min/Max: Maps ER into a width factor (tighter in trend, wider in chop).
Band Tracking (inner value rails)
Tracking Mode:
Base: Pure base rails.
Parallel-Lock: Smooth RVWAP & width; track in parallel.
Slope-Lock: Adds a fraction of recent slope (momentum-friendly).
Forecast-Lock: 1–3 bar extrapolation via linreg (non-repainting on closed bars).
Attach Strength (0..1): Blend tracked rails vs base rails.
Tracking Smooth Length: EMA smoothing of RVWAP and width.
Slope Influence / Forecast Lead Bars: Gains for the chosen mode.
Outer Containment Bands
Show Containment Bands: Master toggle (default ON).
Residual Extremes Lookback: Highest/lowest residual window.
Extreme Smoothing (EMA): Stability on extreme lines.
Margin vs inner width: Extra padding relative to smoothed inner width.
Squeeze & Alerts
Squeeze Window / Threshold: Width vs average; at/under threshold = dot (when enabled).
Min RVOL for Breakout: Required RVOL for breakout alerts.
Style (defaults in this release)
Inner Value rails: OFF (stepline, thin).
Inner & Containment fills: ON.
Containment rails: ON (stepline, medium).
20% / 80% guides: ON — 20% light blue, 80% light red, dashed, thin.
Squeeze dots: OFF by default (orange circles below candles when enabled).
Practical templates (copy/paste into a plan)
Momentum Breakout
Context: Squeeze cluster near RVWAP; Inner Value ON.
Trigger: Breakout Long (close > Upper Value & RVOL ≥ min).
Stop: Below Lower Value (tight) or below RVWAP (safer).
Targets (1:1:1): ⅓ Value → ⅓ Containment → ⅓ trail on RVWAP.
Pullback Continuation
Context: Uptrend; dip to RVWAP / Lower Value with cooling RVOL.
Trigger: Close back above RVWAP or break of reclaim candle’s high.
Stop: Just outside Lower Containment or pullback swing.
Targets: RVWAP → Upper Value → Upper Containment.
Containment Reversion (range)
Context: RVWAP flat; repeated containment tags.
Trigger: Stall at containment, then close back inside.
Stop: A step beyond that containment.
Target: RVWAP; runner only if RVOL stays muted.
Alerts included
DVWAP Breakout Long / Short (Value Bands)
Top Zone / Bottom Zone (20% / 80% guides)
Tip: On lower TFs, act on Breakout alerts with higher-TF bias (e.g., trade 5–15m in the direction of 1H/4H RVWAP slope/position).
Best practices
Let RVWAP be the compass; if unsure, wait until price picks a side.
Respect RVOL; low-RVOL breaks are prone to fail.
Use guides for timing, not certainty. Pair 20/80 zones with flow context.
Start with defaults; change one knob at a time.
Common pitfalls
Fading every containment touch → only fade when RVWAP is flat or RVOL cools.
Over-tuning inputs → the defaults are robust; small tweaks go a long way.
Fighting the higher timeframe on low TFs → expensive habit.
Footer — License & Publishing
License: Mozilla Public License 2.0 (MPL-2.0). You may modify and redistribute; keep this file under MPL and provide source for this file.
Originality: © 2025 JopAlgo. No third-party code reused; Pine built-ins and common formulas only.
Publishing: Keep this header/description intact when releasing on TradingView. Avoid promotional links in the public script text.
Penunjuk Pine Script®