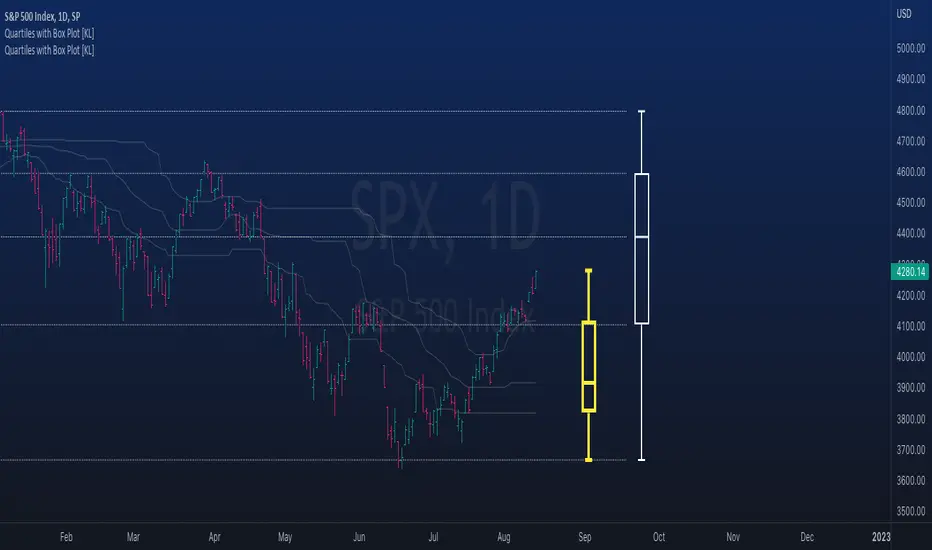
Nadaraya-Watson: Envelope (Non-Repainting)Due to popular request, this is an envelope implementation of my non-repainting Nadaraya-Watson indicator using the Rational Quadratic Kernel. For more information on this implementation, please refer to the original indicator located here:
What is an Envelope?
In technical analysis, an "envelope" typically refers to a pair of upper and lower bounds that surrounds price action to help characterize extreme overbought and oversold conditions. Envelopes are often derived from a simple moving average (SMA) and are placed at a predefined distance above and below the SMA from which they were generated. However, envelopes do not necessarily need to be derived from a moving average; they can be derived from any estimator, including a kernel estimator such as Nadaraya-Watson.
How to use this indicator?
Overall, this indicator offers a high degree of flexibility, and the location of the envelope's bands can be adjusted by (1) tweaking the parameters for the Rational Quadratic Kernel and (2) adjusting the lookback window for the custom ATR calculation. In a trending market, it is often helpful to use the Nadaraya-Watson estimate line as a floating SR and/or reversal zone. In a ranging market, it is often more convenient to use the two Upper Bands and two Lower Bands as reversal zones.
How are the Upper and Lower bounds calculated?
In this indicator, the Rational Quadratic (RQ) Kernel estimates the price value at each bar in a user-defined lookback window. From this estimation, the upper and lower bounds of the envelope are calculated based on a custom ATR calculated from the kernel estimations for the high, low, and close series, respectively. These calculations are then scaled against a user-defined multiplier, which can be used to further customize the Upper and Lower bounds for a given chart.
How to use Kernel Estimations like this for other indicators?
Kernel Functions are highly underrated, and when calibrated correctly, they have the potential to provide more value than any mundane moving average. For those interested in using non-repainting Kernel Estimations for technical analysis, I have written a Kernel Functions library that makes it easy to access various well-known kernel functions quickly. The Rational Quadratic Kernel is used in this implementation, but one can conveniently swap out other kernels from the library by modifying only a single line of code. For more details and usage examples, please refer to the Kernel Functions library located here:
Cari dalam skrip untuk "bands"
[Floride] 4 Layers of Bollinger Shadow
This is the indicator I named 4LBS. That means four layers of bollinger shadow.
This is an indicator that I made to see how far past prices could affect the future prices.
And I found some very interesting and beautiful things about it, and I wanted to share them with you, so I publish this indicator.
*-*-*-*-*-*-*-*-*-*-*-*-*-*-*-*-*-*-*-*-*-*-*-*-*-*-*-*-*-*-*-*-*-*-*-*-*-*-*-*-*-*-*-*-*-*-*-*-*-*-*-*-*-*-*-*-*-*-*-*-*-*-*-*-*-
Hello, nice to meet you all. my name as a trader is Floride.
First of all, I am not good at English, so there may be many grammatically incorrect sentences below.
I ask for your understanding in advance. Thanks for your understanding.
*-*-*-*-*-*-*-*-*-*-*-*-*-*-*-*-*-*-*-*-*-*-*-*-*-*-*-*-*-*-*-*-*-*-*-*-*-*-*-*-*-*-*-*-*-*-*-*-*-*-*-*-*-*-*-*-*-*-*-*-*-*-*-*-*-
What is it?
bollinger Bands usually has one moving average line. And there's two bands that uses same period value of standard deviation as the former MA. And this indicator, by the way, has a 4 shadow bands
that uses twice,three,four,five time the value of the MA's period.
Appearance -
This indicator has four layers, and there are also other layers between them.
You can turn on or off all the shadow layers.
Uses of Indicator and Examples
examples of actual use
1. market strongness diagnosis
-It seems all layers of shadow has some degree resist/support forces.
This indicator has the 4th layer - "L4". (indicated by red lines).
I saw emergence of volatility quite frequently when this last layer breaks through.
When price breaks through this area or line, shade appear on the L4 layer in red. and red cross appear on the that point. This is I called Marlin signal.
If you saw red color shadow in this indicator, then the market may have quite high volatility.
(of course, there's not 100%. Please be careful about this.)
But I've also checked in quite several markets. when this volatility emerges, then also that market seems to started to building quite directional power afterwards.
I mean, after the marlin signal, market tends to have bigger volatility, and tends to go one direction.
again, it's not 100%. but probability is quite high.
But maybe depending on the type of market you need some adjustment.
Recommended values are M2-1.618, M3-2.618
Or M2-1, M3-2. default value is M2-1.618, M3-2.618
and also, if prices breakthrough the channels, or layers, It tends to break through the at once, in first bar. In other words, if price don't break through the first or second candle, it's very likely that the price won't break through channel for the time being.
2. market weakness diagnosis
Usually, without external momentum, the price converges to the average value and does not deviate from the band. And if price fails to break through the most inner first layer-"L1 - the green channel", In that case, the market is usually assumed to be weak, or has low volatility.
- you can set alarms on tuna, marlin signal. and you don't have to watch chart all the time.
3. Signals
I put two signals in this indicator.
One has the name "Tuna," and the second has the name "Marlin."
As you can already tell from the name's feeling, tuna is a weaker signal and marlin is a stronger signal.
Actual example of a signal
1. Tuna signal
- When the tuna signal appears, you can guess that the current market is generally not weak. or has quite good directional force. or medium volatility.
Below is important.
- If a tuna signal appears, there is a possibility that a marlin will appear later.
- In my opinion, it might be wise not to have a position without a tuna signal.
- Almost all of the marlin signal appeared shortly after the tuna signal appeared.
2. Marlin signal
- When marlin signal appears, with a high probability, volatility can increase large.
- In the backtesting of the stock, in some cases, the market moved quite frequently in the direction of the marlin signal.
- The emergence of marlin can be seen as a pretty strong indication of the emergences of direction.
MTF Fair Value Gap Indicator ULTRAFVG Fair Value Gap Indicator
FVG's commonly known as Fair Value Gaps are mostly in use for forex trading, however itโs been widely used in price action trading, even on regular large cap stocks. Think of it as an imbalance area where the price of the stock may actually be under/over valued due to many orders being injected in a short amount of time, ie . a gap caused by an impulse created by the speed of the price movement. In essence, the FVG can become a kind of magnet drawing the price back to that level to attempt to balance out the orders (when? we don't know). Please do research to understand the concept of FVG's.
You can look for an opportunity as price approaches the FVG for entry either long/short because after all, it is an "Area of Interest" so the price will either bounce or blow through the area. No indicator works 100% of the time so take in context as just another indicator. It tends work on larger time frames best.
IMPORTANT TV RELATED LIMITATIONS: You should take the time to understand the following. A MAXIMUM of 500 boxes and labels are allowed, thus if you elect to display many different time frames of FVGs and/or select to not auto delete old Daily FVGs, the oldest FVGs will be deleted and not be seen. Additionally if you are on a smaller chart time frame (1 min), you may not see older FVGs such as Daily ones that occurred and still exist from long ago. This is due to TV limitation of 20,000 candles of history in each chart timeframe. Example: A 1 minute chart supports approximately 14 days worth of data so looking for Daily FVGs would only go back that far, whereas if your chart was set to 5 minutes you'd be able to see 5 times as many, ie . 60 days worth of Daily FVG's. Obviously setting your chart and looking for Daily FVG's would support up to 20,000 days worth.
The Indicator Provides many different features:
*Creation of FVG's for all hours or just during market hours. Currently you can enable FVGโs for the following timeframes: Current chart timeframe, 5Min, 10Min, 15Min, 1Hr, 4Hr, 8Hr, Daily, Weekly, Monthly.
*Text label displays overlaying FVG bands including creation timestamps.
* Bands reflecting FVG's in action (created/deleted) for the current chart time frame, 15min, 1hr, 4hr, 8hr and daily time frames. The FVG's will be overlayed on the chart if enabled.
*Mitigation Action - Normal - When FVG is balanced out by price action, the FVG will disappear. Dynamic - The FVG band will decrease as the price movement eats into it thus only showing the remaining imbalance. None - For those that wish to retain FVG's even if they were mitigated. Half - FVGโs disappear when the price intrudes 50% of the overall FVG band zone.
*Mitigation Type - The elimination or balancing of the FVG is caused by either the candle wick or body passing completely through the FVG.
*Maximum FVGs - A maximum number of FVGs are created for each different enabled time frame (be aware setting a large number could impact system performance).
*All FVG band colors can be customized by the user.
* All FVG bands auto extend to the right.
* Intrusion Alerts - Trading View alerts are supported. You can use the indicator settings to enable an alert if the price intrudes into the FVG zone by a certain percentage. This is not related to mitigation or removal of the FVG, just a warning that price has reached the area of interest.
Refracted EMARefracted EMA is a price based indicator with bands that is built on moving average.
The price range between the bands directly depends on relationship of Average True Range to Moving Average. This gives us very valuable variable constant that changes with the market moves.
So the bands expand and contract due to changes in volatility of the market, which makes this tool very flexible exposing psychological levels.
VWAP Band TrendThis indicator combines two features: VWAP bands for range trading and trends for trend-following.
The white bands offer support/resistance levels ideal for range trading: short when rejecting off the upper band, long when rejecting off the lower. Take profit either when hitting the (faint gray) midline and/or when hitting the band on the far side.
The trend analysis shows green or red ranges above or below the bands to indicate trend strength - larger swaths of green or red indicates strong trend while shorter swathes indicate weak. If the upper trend color doesn't match the lower trend color, the trend is undecided or transitioning.
Optionally, trend initiation indicators can be turned on to show above/below candles where a trend switch is taking place.
All-in-one CPR indicator Introduction and Acknowledgement:
The script is basically a mashup script and provides a combined functionality of various indicators. I'll explain the usefulness and the optimal usage of the script after giving the credits where it is due. A CPR indicator for visually identifying the trend along with the strength of the trend is NOT available in the public library of TradingView. Hence, the need of this indicator.
The credit of creating the original indicators remain unknown to me but I would like to acknowledge the authors whose formulae and codes I have used for creating this mashup indicator.
- Frank Ochoa
- Guruprasad Meduri
- Rafael Zioni
- Stoked Stocks
- Pine team for default indicators
The prime focus of the script is identifying and simplifying the 2 main aspects of a trend:
1. Direction / Underlying trend
2. Strength of the trend
Flaws in traditional CPR:
Some may see this as a flaw, some may not. So take my opinion with a grain of salt. In general, the traditional CPR indicator is used to plot just support and resistance levels, and the trend identification is purely discretionary. In addition to this, there is no way to assess the strength of the move without using a dedicated volumed based indicator. This causes amateur traders to take counter trades to the market direction.
What is the need of this hybrid indicator?
A CPR indicator that also aids in visually identifying the trend and the strength of the trend with respect to the price action in NOT available in the public library of TradingView. The traditional CPR can be used to assess the rough direction of the market but if it combined with the Hull ribbon, the probability of identifying the trend increases manifold. Hence, I decided to create this mashup indicator.
In addition to the basic CPR pivots, the script provides the functionality of the following indicators:
1. HMA based trend ribbons with auto buy/sell signals
2. Volatility based bands - Bollinger bands, Keltner channel, Donchian channel, envelope.
3. Coloured volume candles to determine the strength of the trend
4. CPR with daily, weekly, and monthly levels
5. Previous day high/low
6. Tomorrow CPR
7. 3 Simple moving averages
8. Volume Weighted Average Price (VWAP)
Correct usage of the indicator:
The optimal usage of the indicators consists of mainly 2 parts:
1. Identification of the trend using the combination of CPR and Hull ribbon
2. Determining the strength of the trend
How to identify the trend?
In general, when the price is above CPR it is considered a bullish trend. Also, when the price is above the Hull ribbon, it is considered bullish. Reverse is true for a bearish trend. Combining the traditional CPR logic with the Hull trend ribbon, we can conclude that:
1. Bullish trend = Price above CPR and above the Hull ribbon
2. Bearish trend = Price below CPR and below the Hull ribbon
If the Hull ribbon is showing a zig-zag move, the trend will be sideways. Also, the time frame of the Hull ribbon can be defined as per the need of the user.
Exhibit: Identification of a bullish trend
Exhibit: Identification of a bullish trend with a contra move (pullback)
Exhibit: Identification of a bearish trend
Exhibit: Identification of a bearish trend with a contra move (pullback)
How to determine the strength of the trend?
1. Strong trend = The dark coloured candles represent volume more than 150% of the look back period. For instance
2. Moderate trend = The bright coloured candles represent volume between 50-150%.
3. Neutral trend = The Grey coloured candles represent a weak trend where the volume is less than 50%.
Exhibit: Identification of a strong bearish trend along with the trend direction
Exhibit: Identification of a strong bullish trend using only coloured candles
All the other indicators including the SMA, VWAP, Bollinger bands, Keltner channels, etc. can be used as per the taste of the trader.
Thanks for reading! I hope you find this indicator useful.
Happy learning. Cheers!
Rajat Kumar Singh (@johntradingwick)
Community Manager (India), TradingView
[blackcat] L1 Pawel Kosinski BB with CandlesLevel 1
Background
In Tradersโ Tips of October 2019, the focus is Pawel Kosinskiโs article : โCombining Bollinger Bands With Candlesticksโ
Function
In โCombining Bollinger Bands With Candlesticksโ in this issue, author Pawel Kosinski introduces us to a trading indicator that combines standard Bollinger Bands with the bullish engulfing candlestick pattern. Along the way we get a glimpse into the authorโs process for trading strategy design and testing.
Remarks
Feedbacks are appreciated.
Root mean squared error range (RMSER)Similarly to Bollinger bands, the RMSER gives a support and resistance areas for the trading price. Unlike bollinger bands, which use standard deviation, this support and resistance is calculated with 2 * the root mean squared error away from the moving average. This works very well with indices, like $SPX, and prices only fall outside the range during black swan events like the 2020 crash.
Volatility indicator based on ATR Hello,
I'm sharing to you a volatility indicator I've done in the last few weeks based on ATR. There is multiple functionalities on this indicator, the first one is an overlay displaying when an asset is in an "overvolatily zone"
(displayed with red cross) and when we are in an "undervolatily zone" (displayed with green cross). You can change the sensibility of the signals in the parameters if you wish to have more or less greedy signals
(it will only modify the overvolatility signals). By the way those signals are not working for week-ends because volatility works differently on week-ends and it's not a good idea to count week-ends in the calculations, so do not worry if you see no signals on weekends.
Second part of the indicator is something I called "Atr bands" it's an equivalent to the famous Bollinger-Bands but based on ATR. I haven't backtested them yet but they seems really interesting in low ut
(15 mins seems to be the best ut for those) and they seems pretty bad in high ut so they can maybe be useful for low ut scalping.
Last thing, there is a parameter allowing you to display bands on the week-ends so you can easily see where the indicator won't give signals.
I would be really happy if I could have some feedsback if you try the indicator :)
Have a wonderful day
BBands ChannelsBased on the Bollinger Bands system. This shows outer channels to the bollinger bands .
1 Indicator to rule them allThe best combination indicator consisting of 4 SMA's, 4 EMA's, Donchian Channels, Parabolic SAR, Bollinger Bands, Ichimoku Cloud, a trend strength highlight for the bollinger bands background according to the ADX, labels on the chart to draw in when the Directional Index plus and minus cross, and a background highlight for low and high volatility according to the Historical Volatility Percentile.
The Indicators and placed and group intentionally, with the SMA and EMA's next to the Donchian Channels to draw in areas of support and resistance, with the parabolic SAR afterwards for confirmation on entries and exits.
Next are the Bollinger Bands and the Ichimoku cloud, which when used in combination by an experienced trader allows one to see the trend and spot any developing opportunities at a glance. These can be used in combination with the ADX background in the bolls to point out when trends start and end.
The Directional Indexes crossing implies a equilibrium point has been reached between the buy and selling pressure. Finally the background highlight according to low and high periods of volatility does well to ensure you're entering into the best trades at the best times.
These indicators used together in combo with momentum oscillators will lead to a full and complete picture of the trend and the most likely places for future price to come, allowing a holistic view and confluence between different, noncollinear indicators to paint occam's razor onto the charts.
+ Donchian ChannelsThis version of Donchian Channels uses two source options so that one can create a channel using highs and lows rather than one or the other or closes. My thinking was that this would create a more accurate portrayal of price action (or at least contain the greatest scope of it) as seen through the lens of a Donchian Channel. This was actually part of the genesis of my idea around my Ultimate Moving Average.
Besides the single top and bottom plot for the DC's extremities, I've enabled the ability to create outer bands with a variable width that the user can adjust to their preference. I think it's quite nice. I use it in the DC in my other non-overlay indicators.
Besides this additional functionality, the indicator has options to plot lines between the basis and the upper and lower bands, so, basically, splitting the upper and lower channel in half.
There is no magic number to the lookback. I chose 233 as default because it's a fibonacci sequence number and I'm more interested in using the DC like a very long period bias indicator, and the longer lookback gives a much wider window (because highs and lows are so spread apart) with which other faster indicators (supertrend, shorter period moving averages, etc.) can work without making the screen a clutter.
The color of the basis may also be made relevant to higher timeframe information. What I mean by this is that you can set it so that the basis of the current timeframe is colored based on the candle close of the higher timeframe of your choosing. If you're looking at an hourly chart, and you set the color to Daily, the basis will be colored based on the candle close (above or below the basis) of the previous day. If the previous daily close was above the basis, that positive color will be reflected in the basis, even if the current hourly candle closes are below the hourly basis. This could potentially be useful for setting a higher timeframe directional bias and reacting off price crossing the lower timeframe basis (or whatever your trigger for entering a trade might be). This is also optional in my Ultimate Moving Average indicator.
You can also set the entire indicator to whatever time frame you want if you want to see where the actual basis, or other levels are on that higher timeframe.
Further additions include fibonacci retracement levels. These are calculated off the high and the low of the Donchian Channels themselves.
You will see that there are only three retracement levels (.786, .705, .382), one of which is not a fib level, but what some people call the 'OTE,' or optimal trade entry. If you want more info on the OTE just web search it. So, why no .618 or .236? Reason being that the .618 overlaps the .382, and the .236 is extremely close to the .786. This sounds confusing, but the retracement levels I'm using are derived from the high and low, so it was unnecessary to have all five levels from each. I could have just calculated from the high, or just from the low, and used all the levels, but I chose to just calculate three levels from the high and three from the low because that gives a sort of mirror image balance, and that appeals to me, and the utility of the indicator is the same.
The plot lines are all colored, and I've filled certain zones between them. There is a center zone filled between both .382 levels, and an upper and lower zone filled between the .786 and either the high or the low.
If you like the colored zones, but don't like the plots because they cause screen compression, turn off the plots under the "style" tab.
There are alerts for candle closes across every line.
I should state that, regarding the fibs, obviously the length of the Channels is going to affect to what levels price retraces to. A shorter lookback means you will see more changes in highs and lows, and therefore retraces are often going to be full retraces within the bands unless price is trending hard. A longer lookback means you will see smaller retraces. Using this in conjunction with key high timeframe levels and/or a moving average can give great confidence in a trade entry. Additionally, if you have a short bias it may help in finding levels or entering a trade on a pullback. It could also be good for trade targets. But again, the lookback you choose for this indicator is going to dictate its use in the system you're building or already have. A 9 EMA and a 200 EMA, while fundamentally the same, are going to be used somewhat differently while doing your chart analysis.
Additional images below.
Same image as main, but with supertrend and my +UMA to help with chart analysis.
Image with the fib stuff turned on.
Zoomed out image with the same.
Shorter lookback period.
Zoomed in image of shorter lookback.
Multi-Timeframe TTM Squeeze Pro with alerts and screenersBased of John Carters TTM Squeeze. Must open the settings and select wether you want to match the timeframe in your chart. This must be done in the pinescreener as well otherwise results will not be correct.
---
# **Squeeze Momentum Pro โ Enhanced Screener + EMA Cross Alerts**
This custom version of the Squeeze Momentum indicator expands the standard TTM-style squeeze with screening and automated alert logic so you can quickly find high-quality setups across many tickers.
---
## **What This Script Does**
This indicator plots a three-level squeeze visual similar to TTM Squeeze:
Dot meanings in this indicator
Orange dot:
Strongest squeeze โ Bollinger Bands are inside the tightest Keltner level (highest volatility compression).
Red dot:
Medium squeeze โ still compressed, but not as tight as orange.
Black dot:
Weak squeeze / lowest level of volatility compression.
Price is coiling, but not as tight as the higher levels.
Green dot (โFiredโ):
Squeeze has released โ Bollinger Bands have expanded out of the channels and momentum is moving.
A momentum histogram is plotted to show directional pressure during the squeeze.
---
## **Major Improvements Added**
### **โ Screenable Conditions for Stock Scanners**
This version includes multiple `alertcondition()` flags so the script can be used as a **Pine Screener inside TradingView**.
Currently it can screen for:
โ Price closing above the 50-SMA
โ Presence of an **orange (strong) squeeze dot**
โ 6/20 EMA crossover signals inside a squeeze
These can be used inside the TradingView Screener or in watchlists to automatically highlight qualifying tickers.
---
### **โก 6/20 EMA Trend Signals (Filtered by Squeeze)**
A crossover system was added:
* **Bullish Signal:** 6 EMA crosses above 20 EMA
* **Bearish Signal:** 6 EMA crosses below 20 EMA
But **these signals only trigger if the market is in a red or orange squeeze**, which helps remove noise and focus on valid setups.
---
### **โข Visual Markers Under the Histogram**
Whenever an EMA crossover occurs during a squeeze:
* A **green up-triangle** is plotted for a bullish cross
* A **red down-triangle** for a bearish cross
These markers are drawn **below the histogram**, keeping the display clean while still providing quick visual cues.
---
### **โฃ Fully Non-Repainting Logic**
All signals and squeeze calculations are based on standard fully-resolved `ta.*` functions, making the results stable both in backtesting and real-time.
---
## **Who This Script Helps**
This version is ideal for:
* Traders who use TradingViewโs screener and want automated breakout/continuation filtering
* Traders who scan large watchlists for squeeze setups
* Users who want trend confirmation during volatility compression
---
## **How to Use It**
1. Add the script to your chart
2. Open TradingView Alerts or Screener
3. Select the conditions you want, for example:
* *โOrange Squeeze Detectedโ*
* *โSqueeze Fire after 3 squeeze dots*
* *โ4 REd Dots in a row.โ*
* *โBuy Alertโ*
* *โEMA 6/20 Bullish Crossover (Squeeze Only)โ*
* *โClose Above 50 SMAโ*
Once active, TradingView will automatically flag symbols that meet the criteria.
---
## **Summary**
This enhanced Squeeze Momentum indicator turns the standard TTM-style visual into a **true screening and alert system** by adding:
* Multi-level squeezes
* EMA trend signals
* Screener-compatible alert conditions
* Clean visual signals
* Non-repainting logic
It helps traders quickly locate high-probability setups across any watchlist or market.
SymFlex Band - MAD, RSI Momentum, ATR Volatility"I wanted to design a hybrid band tool that adapts to different market conditions (volatility, momentum, trend) all in one."
"When the RSI band expands asymmetrically and the price closes outside it, this often signals a momentum climax or exhaustion zone."
"Ideal for traders looking to combine volatility breakout and mean reversion logic without switching indicators."
SymFlex Band is a flexible, multi-source band indicator that combines three dynamic metrics:
โ
MAD Band โ Median Absolute Deviation-based range band
โ
RSI Momentum Band โ Adaptive envelope using RSI deviation and trend bias
โ
ATR Band โ Classic Average True Range-based volatility band
๐ Features
-Selectable band types (individually toggled)
-Configurable moving average for center line (EMA, SMA, TEMA, DEMA, Zero-lag variants)
-Dynamic distance and breakout tracking
-Automatic nearest band detection
-Real-time correlation table between bands
This tool helps identify price location relative to statistically adaptive bands, making it easier to detect breakout conditions, mean-reversion zones, and trend-following opportunities.
๐ซ Note: This version is an indicator only. Strategy logic and entry triggers have been removed for publication clarity.
๐ Use Case Suggestions:
Use MAD for range-dominant assets
Use RSI Band for momentum-driven setups
Use ATR when volatility-based positioning is key
Combine all three to get a full perspective of price behavior
OSOM TrendHow to Use the OSOM Trend Indicator
The OSOM Trend indicator is designed for use on TradingView charts. It provides trend identification, entry/exit signals, breakout detection, volume analysis, and market state insights. Below is a step-by-step guide to setting it up and using it effectively.
1. Adding the Indicator to Your Chart
Open TradingView (tradingview.com) and load a chart for your desired asset (e.g., stock, crypto, forex).
Click the "Indicators" button at the top of the chart.
Search for "OSOM Trend" (if it's a community script, you may need to paste the Pine Script code into the Pine Editor).
To add via Pine Editor:
Click the Pine Editor tab at the bottom.
Paste the provided code (from //@version=6 to the end).
Click "Save" and name it (e.g., "OSOM Trend").
Click "Add to Chart".
The indicator will overlay on your chart with default settings.
2. Configuring Inputs
Once added, click the gear icon next to the indicator name in the chart legend to open settings.
Inputs are grouped for ease:
OSOM WV Settings: Adjust trend length (default 14 for sensitivity), smoothing (7), band width (0.8 ATR multiplier), ATR length (10). Toggle fast mode for minimal lag, signals, forecast, take-profits, and re-entries.
Breakout Boxes Settings: Set pivot length (5), box widths (0.5 upper/lower via sliders), and colors.
MMB Settings: Volume lookback (200), EMA smoothing (10).
PVSRA Settings: Length (10), multipliers for climax/rising volumes (2.0/1.5). Optional symbol override (e.g., for aggregated BTC data).
Vector Candle Zones: Toggle on/off, max zones (500), zone type (body/wicks), transparency (90).
CVD Settings: Toggle long/short MAs (55/34 EMA), multipliers (1.5), lengths (40). Enable higher TF, volume integration, dynamic clouds, bar coloring, and status table.
Start with defaults for most assets; reduce lengths for lower timeframes (e.g., 1m-15m) to increase responsiveness, or increase for higher TFs (e.g., daily) for smoother trends.
Visual tweaks: Choose label size (small to reduce clutter), colors, and mode (Cloud for channels, Line Only for simplicity).
3. Interpreting the Visuals and Signals
Trend Line and Bands/Cloud:
Green (bullish) when price > upper band; red (bearish) when < lower band; gray (neutral).
Cloud mode shows a filled channel; use for range visualization. Single Band highlights the active support/resistance.
Buy/Sell Signals:
Up arrow (โ) labels for buys (price crosses over upper band); down arrow (โ) for sells (crosses under lower band).
If forecast enabled, labels show "count/avg" (e.g., "โ 5/10") โ current trend bars vs. smoothed historical average.
Take-profit: "โ" labels when overextended (Z-score > threshold, RSI EMA slope reversal).
Re-entries: "โป" labels on wick touches during trends (with cooldown to avoid spam).
Breakout Boxes:
Pink upper boxes (resistance) and green lower boxes (support) around pivots.
Boxes display total volume and buy/sell % breakdown.
Breakout signals: "BreakUp โฏ" or "BreakDn โฏ" labels/alerts when price crosses box edges โ use for momentum trades.
MMB (Market Maker Build):
Green crosses below bars: Building long (accumulation).
Red crosses above: Building short.
Green X above: Closing long (distribution).
Red X below: Closing short.
Watch for clusters near support/resistance for institutional activity.
PVSRA Candle Coloring:
Overrides bar colors: Green/lime (bull climax), red (bear climax), blue (bull rising), violet/fuchsia (bear rising), gray (normal).
Vector zones (translucent boxes) highlight high-volume areas as potential S/R.
CVD (Cumulative Volume Delta):
Bar colors: Blue (uptrend), red (downtrend) based on CVD vs. MAs.
Status table (top-right): Checkmarks for Long/Short/Test/Sideways states.
Long: CVD above both MAs (bullish confirmation).
Short: Below both (bearish).
Test: Near clouds (potential reversal).
Sideways: Within parallels (range-bound).
4. Trading Strategies
Trend Following: Enter long on buy signals in green trends; short on sell in red. Exit on opposite signals or take-profits. Use forecast for expected duration.
Breakouts: Trade breakups from upper boxes (long) or breakdowns from lower (short). Confirm with volume % (e.g., high buy volume in upper box suggests strong breakout).
Volume Confirmation: Align with MMB builds/closes and PVSRA climaxes for high-conviction entries. Avoid trades in sideways CVD states.
Filters: Use RSI EMA slope in take-profits for overbought/oversold avoidance. Higher TF CVD for broader context.
Timeframes: Versatile โ scalping (1m-5m with fast mode), swing (1h-4h), position (daily+). Test on historical data.
Risk Management: Set stops below lower band (longs) or above upper (shorts). Size positions based on ATR.
5. Alerts and Automation
Set alerts via TradingView: Right-click chart > Add Alert > Condition (e.g., "Buy Signal" or "BreakUp").
Supported alerts: Buy/Sell, Take-Profit, BreakUp/Dn, MMB crosses, Vector patterns, CVD Long/Short entries.
For scripting: Use alertcondition() calls in the code for custom notifications.
6. Tips and Best Practices
Asset Suitability: Best on volume-rich assets (e.g., BTC/USD, stocks). For low-volume, disable CVD/MMB or use overrides.
Performance: On busy charts, reduce max counts (labels/boxes) to avoid lag. Test fast mode for real-time trading.
Backtesting: Use TradingView's replay or strategy tester (convert to strategy script by adding strategy() functions).
Limitations: Not a standalone system โ combine with fundamentals/news. Higher TF data may delay updates.
Customization: Experiment with inputs; e.g., tighten bands (lower multiplier) for volatile markets.
This indicator excels in providing multi-layered confirmation, reducing false signals through volume integration. Always practice on demo accounts before live trading.
Engulfing Candlestick Pattern - BB FilterBeen working on doing a better version of this. This is like version 2.0. Usese this definition of an engulfing candle:
tradeciety.com
As you change the parameters of the Bollinger band the signals will change.
You can also set the distance away from the band using ATR muliplier to catch moves near the BB.
Per Claude,
This setup should give you much higher quality signals since you're filtering for engulfing patterns that occur at the extremes of the Bollinger Bands - exactly like the Tradeciety article recommends. Those are the setups with the best context and highest probability.
A few tips for using it:
You can adjust the BB Touch Distance slider if you want to be stricter or more lenient about what counts as "touching" the bands
Try enabling Strict Mode if you want only the strongest engulfing patterns (where the full range including wicks is engulfed)
Works great on higher timeframes like Daily and Weekly for the most reliable signals on NQ and ES
I personally use this on the 1000 tick NQ chart.
It's not perfect but 2x better than my first attempt. Enjoy.
Open to suggestions as well.
For entertainment purposes only.
HEK Dinamik Fiyat Kanalฤฑ Stratejisi v1HEK Dynamic Price Channel Strategy
Concept
The HEK Dynamic Price Channel provides a channel structure that expands and contracts according to price momentum and time-based equilibrium.
Unlike fixed-band systems, it evaluates the interaction between price and its balance line through an adaptive channel width that dynamically adjusts to changing market conditions.
How It Works
When the price reacts to the midline, the channel bands automatically reposition themselves.
Touching the upper band indicates a strengthening trend, while touching the lower band signals weakening momentum.
This adaptive mechanism helps filter out false signals during sudden directional changes, enhancing overall signal quality.
Advantages
โ
Maintains trend continuity while avoiding overtrading.
โ
Automatically adapts to changing volatility conditions.
โ
Detects early signals of short- and mid-term trend reversals.
Applications
Directional confirmation in spot and futures markets.
A supporting tool in channel breakout strategies.
Identifying price consolidation and equilibrium zones.
Note
This strategy is intended for educational and research purposes only.
It should not be considered financial advice. Always consult a professional financial advisor before making investment decisions.
ยฉ HEK โ Adaptive Channel Approach on Dynamic Market Structures
6 gรผn รถnce
Sรผrรผm Notlarฤฑ
HEK Dynamic Price Channel Strategy
Concept
The HEK Dynamic Price Channel provides a channel structure that expands and contracts according to price momentum and time-based equilibrium.
Unlike fixed-band systems, it evaluates the interaction between price and its balance line through an adaptive channel width that dynamically adjusts to changing market conditions.
How It Works
When the price reacts to the midline, the channel bands automatically reposition themselves.
Touching the upper band indicates a strengthening trend, while touching the lower band signals weakening momentum.
This adaptive mechanism helps filter out false signals during sudden directional changes, enhancing overall signal quality.
Advantages
โ
Maintains trend continuity while avoiding overtrading.
โ
Automatically adapts to changing volatility conditions.
โ
Detects early signals of short- and mid-term trend reversals.
Applications
Directional confirmation in spot and futures markets.
A supporting tool in channel breakout strategies.
Identifying price consolidation and equilibrium zones.
Note
This strategy is intended for educational and research purposes only.
It should not be considered financial advice. Always consult a professional financial advisor before making investment decisions.
ยฉ HEK โ Adaptive Channel Approach on Dynamic Market Structures
ๅคๅจๆ่ถๅฟๅจ้้ขๆฟ(Multi-Timeframe Trend Momentum Panel - User Guide)ๅคๅจๆ่ถๅฟๅจ้้ขๆฟ(Multi-Timeframe Trend Momentum Panel - User Guide)(english explanation follows.)
๐ ๆๆ ๅ่ฝ่ฏฆ่งฃ (็ฒพ็ฎ็):
๐ฏ ๆ ธๅฟๅ่ฝ:
1. ๅคๅจๆ่ถๅฟๅๆ ๅๆถ็ๆง8ไธชๆถ้ดๅจๆ(1m/5m/15m/1H/4H/D/W/M)
2. 4็ปดๅบฆๆ็ฅจ็ณป็ป MA่ถๅฟ+RSIๅจ้+MACD+ๅธๆๅธฆ็ปผๅๅคๆญ
3. ๅ
จ็ไบคๆๆถๆฎต ๅฏ่งๅไบๆดฒ/ไผฆๆฆ/็บฝ็บฆไบคๆๆถ้ด
4. ่ถๅฟๅผบๅบฆ่ฏๅ 0100%้ๅๅธๅบๅ้
5. ๆบ่ฝ่ญฆๆฅ ๅผบๅฟๅค็ฉบไฟกๅท่ชๅจๆจ้
________________________________________
๐ ้่ฆๅ่ฏ่งฃ้:
๐ต ่ถๅฟ็ถๆ (MAๅ็บฟๅๆ):
ๅ่ฏ ๅซไน ไฟกๅทๅผบๅบฆ
ๅผบๅฟๅคๅคด ๅฟซMA่ฟ้ซไบๆ
ขMA(ๅทฎๅผโฅ0.35%) โญโญโญโญโญ ๅๅค
ๅคๅคดๅพๅ ๅฟซMA็ฅ้ซไบๆ
ขMA(ๅทฎๅผ<0.35%) โญโญโญ ่ฐจๆ
ๅๅค
้่ก ๅฟซๆ
ขMA็ผ ็ป,ๆ ๆ็กฎๆนๅ โ ๏ธ ่งๆ
็ฉบๅคดๅพๅ ๅฟซMA็ฅไฝไบๆ
ขMA โญโญโญ ่ฐจๆ
ๅ็ฉบ
ๅผบๅฟ็ฉบๅคด ๅฟซMA่ฟไฝไบๆ
ขMA โญโญโญโญโญ ๅ็ฉบ
็ฎๅ็่งฃ: ๅฟซMAๅฐฑๅ็ญ่ท่ฟๅจๅ(ๅๅบๅฟซ),ๆ
ขMAๆฏ้ฟ่ท่ฟๅจๅ(็จณๅฎ)ใ็ญ่ท่ฟ่ถ
้ฟ่ท=ๅผบๅฟๅคๅคด,ๅไน=ๅผบๅฟ็ฉบๅคดใ
________________________________________
๐ ๅจ้็ถๆ (RSIๅๅบฆๅๆ):
ๅ่ฏ ๅซไน ๆไฝๅปบ่ฎฎ
ๅจ้ไธๆปโ RSI>60ไธๅฟซ้ไธๅ ๅผบ็ไนฐๅ
ฅไฟกๅท
ๅจ้้ซไฝ RSI>60ไฝไธๅๅๆ
ข ่ญฆๆๅ่ฐ,ๅฏๅไป
ๅจ้ไธญๆง RSIๅจ4060ไน้ด,ๅนณ็จณ ็ญๅพ
ๆนๅๆ็กฎ
ๅจ้ไฝไฝ RSI<40ไฝไธ่ทๅๆ
ข ่ญฆๆๅๅผน,ๅฏๆญข็
ๅจ้ไธๅโ RSI<40ไธๅฟซ้ไธ้ ๅผบ็ๅๅบไฟกๅท
็ฎๅ็่งฃ: RSIๅฐฑๅๆฑฝ่ฝฆ้ๅบฆ่กจใ"ๅจ้ไธๆป"=ๆฒน้จ่ธฉๅฐๅบๅ ้,"ๅจ้้ซไฝ"=ๅทฒ็ปๅพๅฟซไฝไธๅๅ ้ไบใ
________________________________________
๐ฃ ่พ
ๅฉไฟกๅท:
MACD:
โข MACDๅคๅคด = ๆฑ็ถๅพ>0 = ไนฐๆนๅ้ๅผบ
โข MACD็ฉบๅคด = ๆฑ็ถๅพ<0 = ๅๆนๅ้ๅผบ
ๅธๆๅธฆ(BB):
โข BB่ถ
ไนฐ = ไปทๆ ผๅจๅธๆๅธฆไธ่ฝจ้่ฟ = ๅฏ่ฝๅ่ฐ
โข BB่ถ
ๅ = ไปทๆ ผๅจๅธๆๅธฆไธ่ฝจ้่ฟ = ๅฏ่ฝๅๅผน
โข BBไธญ่ฝจ = ไปทๆ ผๅจไธญ้ดไฝ็ฝฎ = ๅนณ่กก็ถๆ
________________________________________
๐ก ๅฟซ้ไธๆ 3ๆญฅ็ๆ้ขๆฟ:
็ฌฌ1ๆญฅ: ็"็ปผๅ็ป่ฎบๆ ็ญพ" (K็บฟไธๆน)
โข ็ปฟ่ฒ"ๅคๅคดๅ ไผ" โ ๅฏไปฅๅๅค
โข ็บข่ฒ"็ฉบๅคดๅ ไผ" โ ๅฏไปฅๅ็ฉบ
โข ๆฉ่ฒ"้่ก/ๅ่กก" โ ่งๆ
็ฌฌ2ๆญฅ: ็"็ฅจๆฐ ๅค/็ฉบ" (้ขๆฟๆไธๆน)
โข ๅคๅคด็ฅจๆฐ่ฟๅคงไบ็ฉบๅคด (ๅทฎ่ท>2) โ ่ถๅฟๅผบ
โข ็ฅจๆฐๆฅ่ฟ (ๅทฎ่ท<1) โ ้่กๅธ
็ฌฌ3ๆญฅ: ็"่ถๅฟๅผบๅบฆ" (็ปผๅๆ ็ญพไธญ)
โข ๅผบๅบฆ>70% โ ๅผบๅฟ่ถๅฟ,ๅฏ้ไป
โข ๅผบๅบฆ5070% โ ไธญ็ญ่ถๅฟ,ๆญฃๅธธไปไฝ
โข ๅผบๅบฆ<50% โ ๅผฑๅฟ,่ฝปไปๆ่งๆ
________________________________________
๐จ ๆถๆฎต่ๆฏ่ฒๅซไน:
โข ็ดซ่ฒ่ๆฏ = ไบๆดฒๆถๆฎต (ไธไบฌไบคๆๆถ้ด) ๆณขๅจ่พๅฐ
โข ๆฉ่ฒ่ๆฏ = ไผฆๆฆๆถๆฎต (ๆฌงๆดฒไบคๆๆถ้ด) ๆณขๅจๅขๅคง
โข ่่ฒ่ๆฏ = ็บฝ็บฆๅๆจ ็พ็ๅๅค้ถๆฎต
โข ็บข่ฒ่ๆฏ = ็บฝ็บฆๅ
ณ้ฎ5ๅ้ (09:3009:35) โ ๏ธ ๆ้่ฆ! ๅธๅบๆๆดป่ท,่ถๅฟๆๅฝขๆ
โข ็ปฟ่ฒ่ๆฏ = ็บฝ็บฆไธๅๅๆฎต ๅปถ็ปญๆฉ็่ถๅฟ
ไบคๆๅปบ่ฎฎ: ้็นๅ
ณๆณจ็บข่ฒๅ
ณ้ฎๆถๆฎต,่ฟ5ๅ้ๅพๅพๅณๅฎๅ
จๅคฉๆนๅ!
________________________________________
โ๏ธ ไธๅคงๅธๅบๆจ่่ฎพ็ฝฎ
๐ฅ ้ป้: Hull MA 12/EMA 34, ้ๅผ0.250.35%
โฟ ๆฏ็นๅธ: EMA 21/EMA 55, ้ๅผ0.801.20%
๐ ไปฅๅคชๅ: TEMA 21/EMA 55, ้ๅผ0.600.80%
ๅๆฐไผๅๅปบ่ฎฎ
้ป้ (XAUUSD)
ๅฟซ้MA: Hull MA 12 (่ถ
็ตๆๆๆ้ป้ๅฟซ้ๆณขๅจ)
ๆ
ข้MA: EMA 34 (ๆๆณข้ฃๅฅๆฐๅ)
RSIๅจๆ: 9 (ๅ ๅฟซๅๅบ)
ๅผบ่ถๅฟ้ๅผ: 0.25%
ๅจๆ: 5, 15, 60, 240, 1440
ๆฏ็นๅธ (BTCUSD)
ๅฟซ้MA: EMA 21
ๆ
ข้MA: EMA 55
RSIๅจๆ: 14
ๅผบ่ถๅฟ้ๅผ: 0.8% (ๆณขๅจๅคง,้ๅผ้ๆ้ซ)
ๅจๆ: 15, 60, 240, D, W
ๅคๆฑ EUR/USD
ๅฟซ้MA: TEMA 10 (ๅฟซ้ๅๅบ)
ๆ
ข้MA: T3 30, ๅ ๅญ0.7 (ๅนณๆปๅช้ณ)
RSIๅจๆ: 14
ๅผบ่ถๅฟ้ๅผ: 0.08% (ๅคๆฑๆณขๅจๅฐ)
ๅจๆ: 5, 15, 60, 240, 1440
๐ Indicator Function Details (Concise Version):
๐ฏ Core Functions:
1. MultiTimeframe Trend Analysis Monitors 8 timeframes simultaneously (1m/5m/15m/1H/4H/D/W/M)
2. 4Dimensional Voting System Comprehensive judgment based on MA trend + RSI momentum + MACD + Bollinger Bands
3. Global Trading Sessions Visualizes Asia/London/New York trading hours
4. Trend Strength Score Quantifies market strength from 0100%
5. Smart Alerts Automatically pushes strong bullish/bearish signals
๐ Key Term Explanations:
๐ต Trend Status (MA Analysis):
| Term | Meaning | Signal Strength |
| | | |
| Strong Bull | Fast MA significantly > Slow MA (Diff โฅ0.35%) | โญโญโญโญโญ Long |
| Bullish Bias | Fast MA slightly > Slow MA (Diff <0.35%) | โญโญโญ Caution Long |
| Ranging | MAs intertwined, no clear direction | โ ๏ธ Wait & See |
| Bearish Bias | Fast MA slightly < Slow MA | โญโญโญ Caution Short |
| Strong Bear | Fast MA significantly < Slow MA | โญโญโญโญโญ Short |
Simple Understanding: Fast MA = sprinter (fast reaction), Slow MA = longdistance runner (stable). Sprinter far ahead = Strong Bull, opposite = Strong Bear.
๐ Momentum Status (RSI Analysis):
| Term | Meaning | Trading Suggestion |
| | | |
| Momentum Up โ | RSI >60 & rising rapidly | Strong Buy Signal |
| Momentum High | RSI >60 but rising slower | Watch for pullback, consider reducing position |
| Momentum Neutral | RSI between 4060, stable | Wait for clearer direction |
| Momentum Low | RSI <40 but falling slower | Watch for rebound, consider taking profit |
| Momentum Down โ | RSI <40 & falling rapidly | Strong Sell Signal |
Simple Understanding: RSI = car speedometer. "Momentum Up" = full throttle acceleration, "Momentum High" = already fast but not accelerating further.
๐ฃ Auxiliary Signals:
MACD:
MACD Bullish = Histogram >0 = Strong buyer power
MACD Bearish = Histogram <0 = Strong seller power
Bollinger Bands (BB):
BB Overbought = Price near upper band = Possible pullback
BB Oversold = Price near lower band = Possible rebound
BB Middle = Price near middle band = Balanced state
๐ก Quick Start 3 Steps to Understand the Panel:
Step 1: Check "Composite Conclusion Label" (Above the chart)
Green "Bulls Favored" โ Consider Long
Red "Bears Favored" โ Consider Short
Orange "Ranging/Balanced" โ Wait & See
Step 2: Check "Votes Bull/Bear" (Bottom of the panel)
Bull votes significantly > Bear votes (Difference >2) โ Strong Trend
Votes close (Difference <1) โ Ranging Market
Step 3: Check "Trend Strength" (In the composite label)
Strength >70% โ Strong Trend, consider heavier position
Strength 5070% โ Moderate Trend, normal position size
Strength <50% โ Weak Trend, light position or wait & see
๐จ Trading Session Background Color Meanings:
Purple = Asian Session (Tokyo hours) Lower volatility
Orange = London Session (European hours) Increased volatility
Blue = NY Early Morning US session preparation phase
Red = NY Critical 5 Minutes (09:3009:35) โ ๏ธ Most Important! Market most active, trends easily form
Green = NY Late Morning Continuation of early session trend
Trading Tip: Focus on the red critical period; these 5 minutes often determine the day's direction!
โ๏ธ Recommended Settings for Three Major Markets
๐ฅ Gold (XAUUSD):
Fast MA: Hull MA 12 (Highly sensitive for gold's fast moves)
Slow MA: EMA 34 (Fibonacci number)
RSI Period: 9 (Faster reaction)
Strong Trend Threshold: 0.25%
Timeframes: 5, 15, 60, 240, 1440
โฟ Bitcoin (BTCUSD):
Fast MA: EMA 21
Slow MA: EMA 55
RSI Period: 14
Strong Trend Threshold: 0.8% (High volatility, requires higher threshold)
Timeframes: 15, 60, 240, D, W
๐ Ethereum (ETHUSD):
Fast MA: TEMA 21
Slow MA: EMA 55
RSI Period: 14
Strong Trend Threshold: 0.600.80%
Timeframes: 15, 60, 240, D, W
๐ฑ Forex EUR/USD:
Fast MA: TEMA 10 (Fast response)
Slow MA: T3 30, Factor 0.7 (Smooths noise)
RSI Period: 14
Strong Trend Threshold: 0.08% (Forex has low volatility)
Timeframes: 5, 15, 60, 240, 1440
Buy/Sell Signals [WynTrader]My name is WynTrader. I cumulate 24 years of experience.
This Indicator produces Buy/Sell Signals using these features:
- Fast and Slow Moving averages (modifiable) optimized at EMA-8 and SMA-35
- Bollinger Bands (modifiable) optimized at Basis-18 and Multiplier-1
Also, the Buy/Sell Signals are conditioned by three Filters (optionable, modifiable) :
. Bollinger-Bands Lookback
. High-Low vs Candle Range %
. Distance from Fast and Slow Moving averages %
The Results Calculation presented in a Table are based :
- on the Current Chart Visible Range (optionable)
or
- on the specified TIme Frame Start and End Dates (modifiable)
The Table shows Calculation Results of the Buy and Sell Signals that are activated on the chart, with the Number of Trades (Signals), the Winning Points and the Win Rate %. The Buy&Hold starts calculation at the first Buy encountered.
So be surprised by my Buy/Sell Indicator. But always remember that the world is not perfect. The Graal Indicator, even with AI, doesn't already exist, maybe one day (all of us richier...), but not now. , depending on the chart product (stocks...), volatility, probabilities, unpredictable behaviour. , the moves, etc.
Enjoy
WynTrader
P. s. :
My name is WynTrader. I cumulate 24 years of experience. In 2001, I took an intensive technical analysis course taught by an exceptional friend, Cyril, who taught me everything I know. The foundation I gained through his teaching remains solid and relevant to this day, never failing me.
Before i made this Indicator, I have used many Trading View Buy/Sell Indicators using alone or combined RSI, SMI, OBV, MACD ATR, ADX, Neural, Fractal, Geometry, etc., that are already available for the Trading View community. A great thanks to those who give their time that help me build this tool.
Note that I'm not a programmer, so... ;-)
Multi-Timeframe Trend Indicator with Signalsโโโโโโโโโโโโโโโโโโโโโโโโโโโโโโโโโโโโโโโโโโโโโโโโโโโโโโโโโโโโโโโ
Multi-Timeframe Trend Indicator with Signals
by Zakaria Safri
โโโโโโโโโโโโโโโโโโโโโโโโโโโโโโโโโโโโโโโโโโโโโโโโโโโโโโโโโโโโโโโ
โ ๏ธ IMPORTANT DISCLAIMERS:
โโโโโโโโโโโโโโโโโโโโโโโโโโโโโโโโโโโโโโโโโโโโโโโโโโโโโโโโโโโโโโ
โข This indicator may REPAINT on unconfirmed bars
โข Signals appear in real-time but may change or disappear
โข FOR EDUCATIONAL PURPOSES ONLY - NOT FINANCIAL ADVICE
โข Past performance does not guarantee future results
โข Always do your own research and use proper risk management
โข The Risk Management feature is VISUAL ONLY - does not execute trades
โโโโโโโโโโโโโโโโโโโโโโโโโโโโโโโโโโโโโโโโโโโโโโโโโโโโโโโโโโโโโโ
๐ OVERVIEW:
โโโโโโโโโโโโโโโโโโโโโโโโโโโโโโโโโโโโโโโโโโโโโโโโโโโโโโโโโโโโโโ
This indicator combines multiple technical analysis tools to help identify
potential trend directions and entry/exit points across different timeframes.
It uses SuperTrend, EMAs, ADX, RSI, and Keltner Channels to generate signals.
๐ฏ KEY FEATURES:
โโโโโโโโโโโโโโโโโโโโโโโโโโโโโโโโโโโโโโโโโโโโโโโโโโโโโโโโโโโโโโ
๐ SIGNAL TYPES:
โข All Signals: Shows all SuperTrend crossovers
โข Filtered Signals: Additional EMA filter for potentially higher quality signals
โข Signals use barstate.isconfirmed to reduce (but not eliminate) repainting
๐ TREND ANALYSIS:
โข Trend Ribbon: 8 EMAs creating a visual trend direction indicator
โข Trend Cloud: EMA 150/250 cloud for long-term trend context
โข Chaos Trend Line: Dynamic support/resistance trend line
โข Multi-timeframe dashboard showing trend across 8 timeframes (3m to Daily)
๐ TECHNICAL INDICATORS:
โข Keltner Channels: Dynamic price channels
โข RSI Background: Visual overbought/oversold zones
โข Candlestick Coloring: Three modes (CleanScalper/Trend Ribbon/Moving Average)
โข ADX-based trend strength analysis for MTF dashboard
๐ฏ VISUAL TOOLS:
โข Order Blocks: Supply/demand zones (optional)
โข Channel Breakouts: Pivot-based support/resistance levels
โข Reversal Signals: RSI-based potential reversal indicators
โข Visual TP/SL Lines: For reference only - does NOT execute trades
๐ DASHBOARD:
โข Real-time multi-timeframe trend analysis
โข Volatility indicator (Very Low to Very High)
โข Current RSI value with color coding
โข Customizable position and size
โ๏ธ SETTINGS:
โโโโโโโโโโโโโโโโโโโโโโโโโโโโโโโโโโโโโโโโโโโโโโโโโโโโโโโโโโโโโโ
MAIN SETTINGS:
โข Sensitivity: Controls signal frequency (lower = more signals)
โข Signal Type: Choose between All Signals or Filtered Signals
โข Factor: ATR multiplier for SuperTrend calculation
TREND SETTINGS:
โข Toggle Trend Ribbon, Trend Cloud, Chaos Trend, Order Blocks
โข Moving Average: Customizable EMA (default 200)
ADVANCED SETTINGS:
โข Candlestick coloring with 3 different modes
โข Overbought/Oversold background coloring
โข Channel breakout levels
โข Show/hide signals
RISK MANAGEMENT (VISUAL ONLY):
โข โ ๏ธ Does NOT execute trades automatically
โข Shows potential Take Profit levels (TP1, TP2, TP3)
โข Shows potential Stop Loss level
โข Adjustable TP strength multiplier
โข For educational reference only
๐ HOW TO USE:
โโโโโโโโโโโโโโโโโโโโโโโโโโโโโโโโโโโโโโโโโโโโโโโโโโโโโโโโโโโโโโ
1. SIGNAL INTERPRETATION:
โข "Buy" signals appear below candles when conditions are met
โข "Sell" signals appear above candles when conditions are met
โข Wait for bar close confirmation to avoid repainting
โข Use multiple timeframes for confluence
2. TREND CONFIRMATION:
โข Check the multi-timeframe dashboard for trend alignment
โข Use Trend Ribbon for visual trend direction
โข Trend Cloud shows longer-term market bias
โข Green candles = potential uptrend, Red = potential downtrend
3. ENTRY/EXIT STRATEGY:
โข Combine signals with other analysis tools
โข Check volatility status before entering trades
โข Use support/resistance levels for confirmation
โข The visual TP/SL lines are for planning only
4. RISK MANAGEMENT:
โข Always use stop losses (indicator shows suggested levels only)
โข Position size according to your risk tolerance
โข Never risk more than you can afford to lose
โข The indicator does NOT manage trades automatically
โ ๏ธ LIMITATIONS & RISKS:
โโโโโโโโโโโโโโโโโโโโโโโโโโโโโโโโโโโโโโโโโโโโโโโโโโโโโโโโโโโโโโ
REPAINTING:
โข Signals may appear and disappear on unconfirmed bars
โข Always wait for bar close before taking action
โข Historical performance may look better than real-time results
FALSE SIGNALS:
โข No indicator is 100% accurate
โข Signals can fail in ranging/choppy markets
โข Use additional confirmation methods
โข Consider market context and fundamentals
VISUAL TP/SL:
โข Lines are for reference/planning only
โข Does NOT place or manage actual trades
โข You must manually set your own stop losses
โข TP levels are calculated estimates, not guarantees
๐ง TECHNICAL DETAILS:
โโโโโโโโโโโโโโโโโโโโโโโโโโโโโโโโโโโโโโโโโโโโโโโโโโโโโโโโโโโโโโ
โข Version: Pine Script v5
โข Overlay: Yes (displays on main chart)
โข Anti-repaint measures: Uses barstate.isconfirmed on signals
โข Security function: Uses lookahead protection for higher timeframes
โข Dynamic requests: Enabled for MTF analysis
โข Max labels: 500
๐ COMPONENTS EXPLAINED:
โโโโโโโโโโโโโโโโโโโโโโโโโโโโโโโโโโโโโโโโโโโโโโโโโโโโโโโโโโโโโโ
SUPERTREND:
โข Core signal generator using ATR-based bands
โข Crossovers indicate potential trend changes
โข Adjustable via Sensitivity and Factor inputs
EMA FILTER:
โข Uses 200 EMA as trend filter (customizable)
โข Filtered signals require price above/below EMA
โข Helps reduce false signals in ranging markets
ADX TREND QUALITY:
โข Measures trend strength across timeframes
โข Used in multi-timeframe dashboard
โข Shows Bullish/Bearish/Neutral states
KELTNER CHANNELS:
โข Multiple bands showing volatility zones
โข Color-coded based on RSI levels
โข Helps identify overbought/oversold conditions
ORDER BLOCKS:
โข Identifies supply/demand zones
โข Based on price structure and pivots
โข Can extend to the right for projection
๐ก BEST PRACTICES:
โโโโโโโโโโโโโโโโโโโโโโโโโโโโโโโโโโโโโโโโโโโโโโโโโโโโโโโโโโโโโโ
โ Use multiple timeframe confirmation
โ Wait for bar close before acting on signals
โ Combine with support/resistance analysis
โ Check overall market conditions
โ Use proper risk management (1-2% per trade)
โ Backtest on your specific market/timeframe
โ Paper trade before using real money
โ Keep a trading journal
โ Adjust settings to your trading style
โ Don't rely solely on this indicator
โ Don't ignore risk management
โ Don't trade on unconfirmed signals
โ Don't overtrade every signal
โ Don't use without understanding how it works
โ Don't expect the TP/SL feature to trade for you
๐ SUPPORT & UPDATES:
โโโโโโโโโโโโโโโโโโโโโโโโโโโโโโโโโโโโโโโโโโโโโโโโโโโโโโโโโโโโโโ
Creator: Zakaria Safri
Version: 4.3 (Compliance Update)
For questions or feedback, please use TradingView's comment section.
โ๏ธ FINAL DISCLAIMER:
โโโโโโโโโโโโโโโโโโโโโโโโโโโโโโโโโโโโโโโโโโโโโโโโโโโโโโโโโโโโโโ
This indicator is provided for EDUCATIONAL and INFORMATIONAL purposes only.
It is NOT financial advice, investment advice, or a recommendation to buy/sell.
Trading involves substantial risk of loss. Past performance, whether actual or
indicated by historical tests of strategies, is not indicative of future results.
The creator assumes NO responsibility for your trading results. You are solely
responsible for your own investment decisions and due diligence.
Always consult with a qualified financial advisor before making investment decisions.
By using this indicator, you acknowledge and accept these risks and limitations.
Adaptive Trend CatcherAdaptive Trend Catcher is an original indicator that combines Hull Moving Average smoothing, ATR-based volatility bands, and a CCI filter within an adaptive logic framework. Itโs built to react intelligently to changing market conditions rather than applying fixed parameters.
The system uses hysteresis to confirm trend flips only after several consistent signals, minimizing noise and false reversals. During strong momentum bursts, it automatically tightens its internal deadzone and step size to stay responsive while maintaining stability in quieter periods.
The result is a dynamic trend engine that plots a color-shifting adaptive line โ green for bullish, red for bearish โ that adjusts smoothly with volatility. Optional upper/lower ATR bands can be displayed for added context.
How to use: Watch for confirmed trend color flips with supporting momentum. Bullish flips occur when price regains the lower band and CCI turns positive; bearish flips when price falls below the upper band and CCI turns negative.
Includes alert conditions for both reversals.
For educational purposes only. Not financial advice.
EQ + Bandas Pro ๐ EQ + Bands Pro is an advanced indicator built on OHLC analysis. It calculates a synthetic equilibrium price and plots dynamic, robust bands that adapt to volatility while filtering outliers. The tool highlights zones of overvaluation and undervaluation, helping traders identify key imbalances, potential reversals, and trend confirmations.
PSAR+EMA+Hull+BBDescription
This all-in-one indicator combines four proven tools:
Parabolic SAR (Everget) โ trend direction and potential reversals.
Exponential Moving Averages (20/50/100/200) โ customizable lengths, colors, and offsets.
Hull Suite (InSilico) โ smooth trend detection with multiple variations (HMA, THMA, EHMA).
Bollinger Bands โ volatility and dynamic support/resistance.
Features
Toggle each module on/off in settings.
Fully configurable inputs (lengths, colors, offsets, multipliers).
Optional PSAR labels, highlights, and state fill.
Hull can color candles, draw band fills, and pull from higher timeframes.
Bollinger Bands include multiple basis types, stdev multipliers, and fill transparency.
Built-in alerts: PSAR direction change, Hull trending up/down.
Category
Trend Analysis (with Volatility as secondary).


