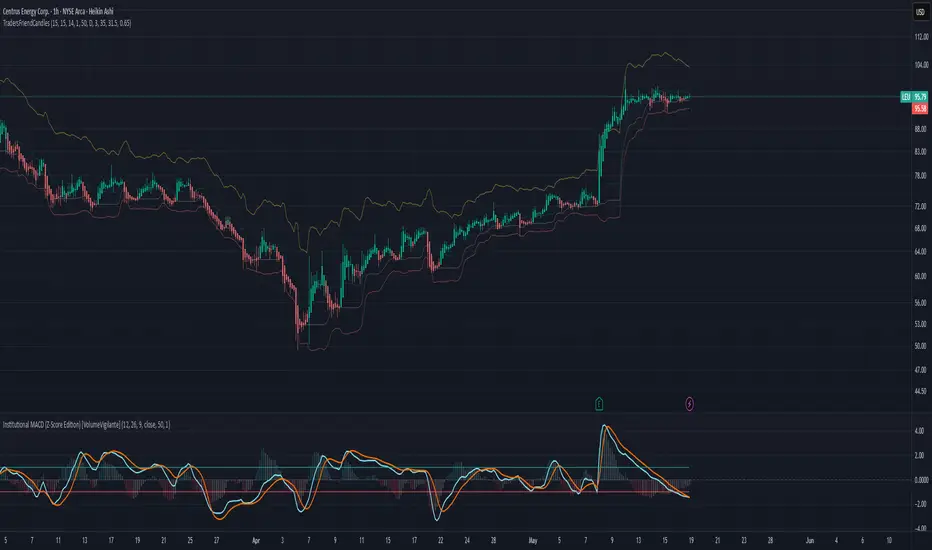
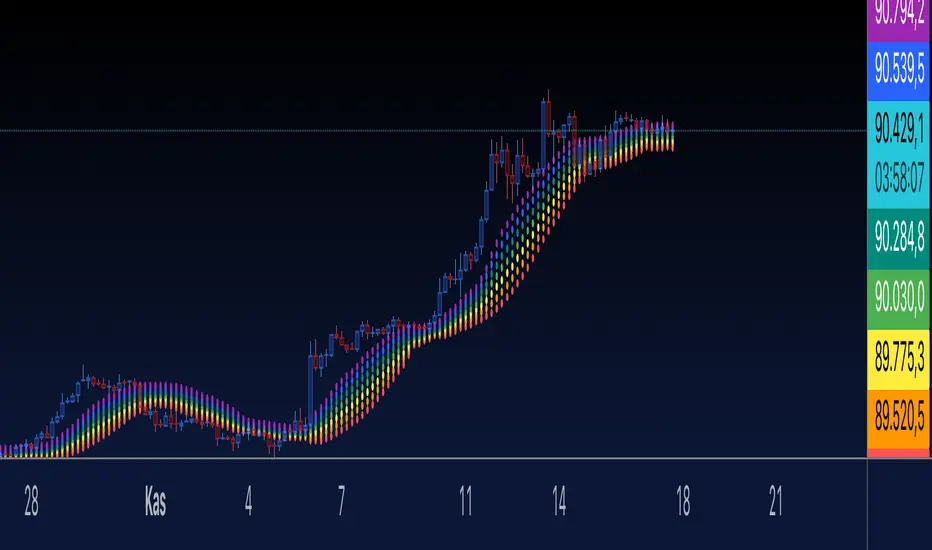
Keltner Channel StrategyOverview
The Keltner Channel Strategy is a powerful trend-following and mean-reversion system that leverages the Keltner Channels, EMA crossovers, and ATR-based stop-losses to optimize trade entries and exits. This strategy has proven to be highly effective, particularly when applied to Gold (XAUUSD) and other commodities with strong trend characteristics.
📈 How It Works
This strategy incorporates two trading approaches: 1️⃣ Keltner Channel Reversal Trades – Identifies overbought and oversold conditions when price touches the outer bands.
2️⃣ Trend Following Trades – Uses the 9 EMA & 21 EMA crossover, with confirmation from the 50 EMA, to enter trades in the direction of the trend.
🔍 Entry & Exit Criteria
📊 Keltner Channel Entries (Reversal Strategy)
✅ Long Entry: When the price crosses below the lower Keltner Band (potential reversal).
✅ Short Entry: When the price crosses above the upper Keltner Band (potential reversal).
⏳ Exit Conditions:
Long positions close when price crosses back above the mid-band (EMA-based).
Short positions close when price crosses back below the mid-band (EMA-based).
📈 Trend Following Entries (Momentum Strategy)
✅ Long Entry: When the 9 EMA crosses above the 21 EMA, and price is above the 50 EMA (bullish momentum).
✅ Short Entry: When the 9 EMA crosses below the 21 EMA, and price is below the 50 EMA (bearish momentum).
⏳ Exit Conditions:
Long positions close when the 9 EMA crosses back below the 21 EMA.
Short positions close when the 9 EMA crosses back above the 21 EMA.
📌 Risk Management & Profit Targeting
ATR-based Stop-Losses:
Long trades: Stop set at 1.5x ATR below entry price.
Short trades: Stop set at 1.5x ATR above entry price.
Take-Profit Levels:
Long trades: Profit target 2x ATR above entry price.
Short trades: Profit target 2x ATR below entry price.
🚀 Why Use This Strategy?
✅ Works exceptionally well on Gold (XAUUSD) due to high volatility.
✅ Combines reversal & trend strategies for improved adaptability.
✅ Uses ATR-based risk management for dynamic position sizing.
✅ Fully automated alerts for trade entries and exits.
🔔 Alerts
This script includes automated TradingView alerts for:
🔹 Keltner Band touches (Reversal signals).
🔹 EMA crossovers (Momentum trades).
🔹 Stop-loss & Take-profit activations.
📊 Ideal Markets & Timeframes
Best for: Gold (XAUUSD), NASDAQ (NQ), Crude Oil (CL), and trending assets.
Recommended Timeframes: 15m, 1H, 4H, Daily.
⚡️ How to Use
1️⃣ Add this script to your TradingView chart.
2️⃣ Select a 15m, 1H, or 4H timeframe for optimal results.
3️⃣ Enable alerts to receive trade notifications in real time.
4️⃣ Backtest and tweak ATR settings to fit your trading style.
🚀 Optimize your Gold trading with this Keltner Channel Strategy! Let me know how it performs for you. 💰📊
Cari dalam skrip untuk "bands"
FVG LevelsFVG Levels Indicator Description
The FVG Levels indicator dynamically identifies and displays key price zones that may represent fair value gaps and order block areas, helping traders to visually pinpoint potential support and resistance levels directly on the chart.
Key Features
Order Block Identification:
The indicator detects bullish and bearish order blocks by analyzing specific candle patterns. For bullish zones, it checks if a candle two bars ago was bullish (close greater than open) coupled with a subsequent gap condition. Similarly, bearish zones are identified when bearish candle conditions are met with an appropriate gap.
Dynamic Zone Calculation:
It computes critical levels such as the highest highs, lowest lows, highest lows, and lowest highs over a series of recent bars. These levels define the boundaries of potential buy and sell zones and adjust dynamically as new price data comes in.
Visual Representation:
Buy zones are plotted in lime and sell zones in yellow, with the indicator filling the areas between the high and low lines to create clear, shaded bands. This visual aid helps in quickly recognizing zones of potential price reaction.
Chart Overlay:
Designed to work as an overlay, the indicator integrates directly onto your price chart, allowing for seamless correlation between price action and identified zones.
How It Works
Bullish Zones:
When a bullish candle (with the candle's close above its open) is detected along with a significant gap, the indicator marks the upper and lower boundaries of the bullish order block. It further refines these levels by tracking the lowest low and highest high over recent bars to enhance the zone's definition.
Bearish Zones:
In a similar manner, the indicator calculates bearish order blocks by confirming bearish candle conditions and corresponding gap criteria. It then updates the bearish zone levels and computes the highest high and lowest low to establish clear sell zone boundaries.
Usage
Traders can use the FVG Levels indicator to:
Identify potential entry and exit points by observing where price may reverse or consolidate.
Recognize fair value gaps or imbalances that often act as magnet points for price action.
Enhance risk management by using the dynamically calculated zones to set stop-losses or take-profits.
Adaptive Linear Regression ChannelOverview
The Adaptive Linear Regression Channel Script is an advanced, multi-functional trading tool crafted to help traders pinpoint market trends, identify potential reversals, assess volatility, and establish dynamic levels for profit-taking and position exits. By incorporating key concepts such as linear regression , standard deviation , and other volatility measures like the ATR , the script offers a comprehensive view of market behavior beyond traditional deviation metrics.
This dynamic model continuously adapts to changing market conditions, adjusting in real-time to provide clear visualizations of trends, channels, and volatility levels. This adaptability makes the script invaluable for both trend-following and counter-trend strategies, giving traders the flexibility to respond effectively to different market environments.
Background
What is Linear Regression?
Definition : Linear regression is a statistical technique used to model the relationship between a dependent variable (target) and one or more independent variables (predictors).
In its simplest form (simple linear regression), the relationship between two variables is represented by a straight line (the regression line).
y = mx + b
where :
- y is the target variable (price)
- m is the slope
- x is the independent variable (time)
- b is the intercept
Slope of the Regression Line
Definition: The slope (m) measures the rate at which the dependent variable (y) changes as the independent variable (x) changes.
Interpretation:
- A positive slope indicates an uptrend.
- A negative slope indicates a downtrend.
Uses in Trading:
- Identifying the strength and direction of market trends.
- Assessing the momentum of price movements.
R-squared (Coefficient of Determination)
Definition: A measure of how well the regression line fits the data, ranging from 0 to 1.
Calculation :
R2 = 1− (SS tot/SS res)
where:
- SSres is the sum of squared residuals.
- SStot is the total sum of squares.
Interpretation:
- Higher R2 indicates a better fit, meaning the model explains a larger proportion of the variance in the data.
Uses in Trading:
- Higher R-squared values give traders confidence in trend-based signals.
- Low R-squared values may suggest that the market is more random or volatile.
Standard Deviation
Definition: Standard Deviation quantifies the dispersion of data points in a dataset relative to the mean. A low standard deviation indicates that data points tend to be close to the mean, while a high standard deviation indicates that the data points are spread out over a larger range of values.
Calculation
σ=√∑(xi−μ)2/N
Where
- σ is the standard deviation.
- ∑ is the summation symbol, indicating that the expression that follows should be summed over all data points.
- xi, this represents the i-th data point in the dataset.
- μ\mu, this represents the mean(average) of all the data points in the dataset.
- (xi−μ)2, this is the squared difference between each data point and the mean.
- N is the total number of data points in the dataset.
- **Interpretation**
- A higher standard deviation indicates greater volatility.
- Useful for identifying overbought/oversold conditions in markets.
Key Features
Dynamic Linear Regression Channels:
The script automatically generates adaptive regression channels that expand or contract based on the current market volatility. This real-time adjustment ensures that traders are always working with the most relevant data, making it easier to spot key support and resistance levels.
The channel width itself serves as an indicator of market volatility, expanding during periods of heightened uncertainty and contracting during more stable phases. Additionally, the channel width is trained on previous channel widths , allowing the script to adapt and provide a more accurate view of volatility trends of the asset. Traders can also customize the script to train on less historical data , enabling a more recent view of volatility , which is particularly useful in fast-moving or changing markets.
Dynamic Profits and Stops:
What is it?
Dynamic profit levels allow traders to adjust take-profit targets based on real-time market conditions. Unlike static levels, which remain fixed regardless of market changes, these adaptive levels leverage past volatility data to create more flexible profit-taking strategies.
How does it work?
The script determines these levels using previously stored deviation values. These deviations are categorized into quantiles (like Q1, Q2, Q3, etc.) to classify current market conditions. As new deviation data is recorded, the profit levels are adjusted dynamically to reflect changes in market volatility. This approach helps to refine profit targets, especially when using regression channels with standard deviation rather than traditional ATR bands.
Why is it valuable?
By utilizing adaptive profit levels, traders can optimize their exits based on the current volatility landscape. For instance, when volatility increases, the dynamic levels expand, allowing trades to capture larger price movements. Conversely, during low volatility, profit targets tighten to lock in gains sooner, reducing exposure to market reversals. This flexibility is especially beneficial when combined with adaptive regression channels that respond to changes in standard deviation.
Slope-Based Trend Analysis:
One of the core elements of this script is the slope of the regression line , which helps define the direction and strength of the trend. Positive slopes indicate bullish momentum, while negative slopes suggest bearish conditions. The slope's steepness gives traders insight into the market's momentum, allowing them to adjust their strategies based on the strength of the trend.
Additionally, the script uses the slope to create a color gradient , which visually represents the intensity of the market's momentum. The gradient peaks at one color to show the maximum bullish momentum experienced in the past, while another color represents the maximum bearish momentum experienced in the past. This color-coded visualization makes it easier for traders to quickly assess the market's strength and direction at a glance.
Volatility Heatmap:
The integrated heatmap provides an intuitive, color-coded visualization of market volatility. The heatmap highlights areas where price action is expanding or contracting, giving traders a clear view of where volatility is rising or falling. By mapping out deviations from the regression line, the heatmap makes it easier to spot periods of high volatility that could lead to major market moves or potential reversals.
Deviation Concepts:
The script tracks price deviations from the regression line when a new range is formed, providing valuable insights when the price significantly deviates from the expected trend. These deviations are key in identifying potential breakout points or trend shifts .
This helps traders understand when the market is overextended or when a pullback may be imminent, allowing them to make more informed trading decisions.
Adaptive Model Properties:
Unlike static indicators, this script adapts over time . As the market changes, it stores historical data related to channel widths , slope dynamics , and volatility levels , adjusting its analysis accordingly to stay relevant to current market conditions.
Traders have the ability to train the model on all available data or specify a set number of bars to focus on more recent market activity. This flexibility allows for more tailored analysis , ensuring that traders can work with data that best fits their trading style and time horizon.
This continuous learning approach ensures that traders always have the most up-to-date insight into the market's structure.
Table
The table displays key metrics in real time to provide deeper insights into market behavior:
1. Deviation & Slope : Shows the current deviation if set to standard deviation or atr if set to atr(values used to calculated the channel widths) and the trend slope, helping to gauge market volatility and trend direction.
2. Rate of Change : For both deviation/atr and slope, the table also calculates the rate of change of their rates—essentially capturing the acceleration or deceleration of trends and volatility. This helps identify shifts in market momentum early.
3. R-squared : Indicates the strength and reliability of the trend fit. A higher value means the regression line better explains the price movements.
4. Quantiles : Uses historical deviation data to categorize current market conditions into quartiles (e.g., Q1, Q2, Q3). This helps classify the market's current volatility level, allowing traders to adjust strategies dynamically.
By combining these metrics, the table offers a comprehensive, real-time snapshot of market conditions, enabling more informed and adaptive trading decisions.
Settings
Here’s a breakdown of the script's settings for easy reference:
Linear Regression Settings
Show Dynamic Levels :Toggle to display dynamic profit levels on the chart.
Deviation Type :Select the method for calculating deviation—options include ATR (Average True Range) or Standard Deviation.
Timeframe :Sets the specific timeframe for the regression analysis (default is the chart’s timeframe).
Period :Defines the number of bars used for calculating the regression line (e.g., 50 bars).
Deviation Multiplier :Multiplier used to adjust the width of the deviation channel around the regression line.
Rate of Change :Sets the period for calculating the rate of change of the slope (used for momentum analysis).
Max Bars Back :Limits the number of historical bars to analyze (0 means all available data).
Slope Lookback :Number of bars used to calculate the slope gradient for trend detection.
Slope Gradient Display :Toggle to enable gradient coloring based on slope direction.
Slope Gradient Colors :Set colors for positive and negative slopes, respectively.
Slope Fill :Adjusts the transparency of the slope gradient fill.
Volatility Gradient Display :Toggle to enable gradient coloring based on volatility levels.
Volatility Gradient Colors :Set colors for low and high volatility, respectively.
Volatility Fill :Adjusts the transparency of the volatility gradient fill.
Table Settings
Show Table :Toggle to display the metrics table on the chart.
Table Position :Choose where to position the table (e.g., top-right, middle-center, etc.).
Font Size :Set the size of the text in the table. Options include Tiny, Small, Normal, Large, and Huge.
Original Keltner with Support And ResistanceThis indicator is based on the original Keltner Channels using typical price and calculating the 10 period average of high - low
Typical price = (high + low + close)/3
In this case, I've taken Typical price as (open + high + low + close)/4 on the advice of John Bollinger from his book Bollinger on Bollinger Bands.
Buy Line = 10 Period Typical Price Average + 10 Period Average of (High - Low)
Sell Line = 10 Period Typical Price Average - 10 Period Average of (High - Low)
This is the basis for the indicator. I've added the highest of the Buy Line and lowest of the Sell Line for the same period which acts as Support and Resistance.
If price is trending below the Lowest of Sell Line, take only sell trades and the Lowest Line acts as resistance.
If price is trending above the Highest of Buy Line, take only buy trades and the Highest Line acts as support.
Bullish Candlestick Patterns With Filters [TradeDots]The "Bullish Candlestick Patterns With Filters" is a trading indicator that identifies 6 core bullish candlestick patterns. This is further enhanced by applying channel indicator as filters, designed to further increase the accuracy of the recognized patterns.
6 CANDLESTICK PATTERNS
Hammer
Inverted Hammer
Bullish Engulfing
The Piercing Line
The Morning Star
The 3 White Soldiers
SIGNAL FILTERING
The indicator incorporates with 2 primary methodologies aimed at filtering out lower accuracy signals.
Firstly, it comes with a "Lowest period" parameter that examines whether the trough of the bullish candlestick configuration signifies the lowest point within a specified retrospective bar length. The longer the period, the higher the probability that the price will rebound.
Secondly, the channel indicators, the Keltner Channels or Bollinger Bands. This indicator examines whether the lowest point of the bullish candlestick pattern breaches the lower band, indicating an oversold signal. Users have the flexibility to modify the length and band multiplier, enabling them to custom-tune signal sensitivity.
Without Filtering:
With Filtering
RISK DISCLAIMER
Trading entails substantial risk, and most day traders incur losses. All content, tools, scripts, articles, and education provided by TradeDots serve purely informational and educational purposes. Past performances are not definitive predictors of future results.
Mean and Standard Deviation Lines Description:
Calculates the mean and standard deviation of close-to-close price differences over a specified period, providing insights into price volatility and potential breakouts.
Manually calculates mean and standard deviation for a deeper understanding of statistical concepts.
Plots the mean line, upper bound (mean + standard deviation), and lower bound (mean - standard deviation) to visualize price behavior relative to these levels.
Highlights bars that cross the upper or lower bounds with green (above) or red (below) triangles for easy identification of potential breakouts or breakdowns.
Customizable period input allows for analysis of short-term or long-term volatility patterns.
Probability Interpretations based on Standard Deviation:
50% probability: mean or expected value
68% probability: Values within 1 standard deviation of the mean (mean ± stdev) represent roughly 68% of the data in a normal distribution. This implies that around 68% of closing prices in the past period fell within this range.
95% probability: Expanding to 2 standard deviations (mean ± 2*stdev) captures approximately 95% of the data. So, in theory, there's a 95% chance that future closing prices will fall within this wider range.
99.7% probability: Going further to 3 standard deviations (mean ± 3*stdev) encompasses nearly 99.7% of the data. However, these extreme values become less likely as you move further away from the mean.
Key Features:
Uses manual calculations for mean and standard deviation, providing a hands-on approach.
Excludes the current bar's close price from calculations for more accurate analysis of past data.
Ensures valid index usage for robust calculation logic.
Employs unbiased standard deviation calculation for better statistical validity.
Offers clear visual representation of mean and volatility bands.
Considerations:
Manual calculations might have a slight performance impact compared to built-in functions.
Not a perfect normal distribution: Financial markets often deviate from a perfect normal distribution. This means probability interpretations based on standard deviation shouldn't be taken as absolute truths.
Non-stationarity: Market conditions and price behavior can change over time, impacting the validity of past data as a future predictor.
Other factors: Many other factors influence price movements beyond just the mean and standard deviation.
Always consider other technical and fundamental factors when making trading decisions.
Potential Use Cases:
Identifying periods of high or low volatility.
Discovering potential breakout or breakdown opportunities.
Comparing volatility across different timeframes.
Complementing other technical indicators for confirmation.
Understanding statistical concepts for financial analysis.
McGinley Dynamic x Donchian ChannelsThis indicator combines the McGinley Dynamic and Donchian Channels by taking the lowest and highest values over a set length (defaulted to 14) then applying the McGinley Dynamic math to these values. The upper range is denoted by a green line while the lower range is denoted by a red line. Additionally, standard deviations of 1, 2, and 3 have been put in place using the upper and lower values as the basis for the deviations as opposed to the baseline average of the upper and lower bands. These deviations are plotted as lime and orange colors. These channels can be used to determine when the price is gaining or losing momentum based on the distance between the channels. Otherwise, the channels can be used to determine potential overbought and oversold levels.
Bollinger Pair TradeNYSE:MA-1.6*NYSE:V
Revision: 1
Author: @ozdemirtrading
Revision 2 Considerations :
- Simplify and clean up plotting
Disclaimer: This strategy is currently working on the 5M chart. Change the length input to accommodate your needs.
For the backtesting of more than 3 months, you may need to upgrade your membership.
Description:
The general idea of the strategy is very straightforward: it takes positions according to the lower and upper Bollinger bands.
But I am mainly using this strategy for pair trading stocks. Do not forget that you will get better results if you trade with cointegrated pairs.
Bollinger band: Moving average & standard deviation are calculated based on 20 bars on the 1H chart (approx 240 bars on a 5m chart). X-day moving averages (20 days as default) are also used in the background in some of the exit strategy choices.
You can define position entry levels as the multipliers of standard deviation (for exp: mult2 as 2 * standard deviation).
There are 4 choices for the exit strategy:
SMA: Exit when touches simple moving average (SMA)
SKP: Skip SMA and do not stop if moving towards 20D SMA, and exit if it touches the other side of the band
SKPXDSMA: Skip SMA if moving towards 20D SMA, and exit if it touches 20D SMA
NoExit: Exit if it touches the upper & lower band only.
Options:
- Strategy hard stop: if trade loss reaches a point defined as a percent of the initial capital. Stop taking new positions. (not recommended for pair trade)
- Loss per trade: close position if the loss is at a defined level but keeps watching for new positions.
- Enable expected profit for trade (expected profit is calculated as the distance to SMA) (recommended for pair trade)
- Enable VIX threshold for the following options: (recommended for volatile periods)
- Stop trading if VIX for the previous day closes above the threshold
- Reverse active trade direction if VIX for the previous day is above the threshold
- Take reverse positions (assuming the Bollinger band is going to expand) for all trades
Backtesting:
Close positions after a defined interval: mark this if you want the close the final trade for backtesting purposes. Unmark it to get live signals.
Use custom interval: Backtest specific time periods.
Other Options:
- Use EMA: use an exponential moving average for the calculations instead of simple moving average
- Not against XDSMA: do not take a position against 20D SMA (if X is selected as 20) (recommended for pairs with a clear trend)
- Not in XDSMA 1 DEV: do not take a position in 20D SMA 1*standart deviation band (recommended if you need to decrease # of trades and increase profit for trade)
- Not in XDSMA 2 DEV: do not take a position in 20D SMA 2*standart deviation band
Session management:
- Not in session: Session start and end times can be defined here. If you do not want to trade in certain time intervals, mark that session.(helps to reduce slippage and get more realistic backtest results)
baguette by multigrainRationale
The rationale behind this indicator is that: when the price of an asset reaches an extreme, regardless of the trend, there is a (maybe not equal but) opposite reaction.
Settings
The default settings will not be the best for whatever timeframe you choose. I personally believe a longer than 'normal' JMA Length is best.
JMA Source: The source in which the Jurik Moving Average calculations are based off of.
JMA Length: Controls the length of the Jurik Moving Average.
JMA Phase: A lag controller of sorts. Increasing the phase increases overshoots but reduces lag, decreasing the phase decreases overshoots but increases lag.
ATR Length: The length in which an average true range value will be calculated with.
ATR Multiplier: This multiplier controls the 'width' of our envelope or our extreme bands.
Credits
@gorx1 for the improved and more accurate (?) Jurik Moving Average calculations.
@redktrader for the ATR envelope calculations.
ka66: Percent Stop ChannelOften used as a dynamic stop loss management tool, this indicator:
Takes a source series as input, e.g. a moving average, or close prices.
Draws configurable channels, some percentage above and below the source series (e.g. for long vs. short stop losses)
Since long vs. short trade profiles can be different, differing percentage inputs are allowed for the bands.
While in forex or futures we tend to use ATRs (see my other script: ATR Stop Channels), in stocks, a percentage is more the norm, it's still as dynamic as the source series, being a function of it, and may at times be simpler to reason about in terms of money.
An idea might be to set your stop loss at the point of entry where the band currently is (assuming you have observed and set a reasonable percentage).
Hull Keltner ChannelThis script is a Keltner Channel that uses a Hull Moving Average as source, instead of the 20-period EMA.
A hull band improves on lag and smoothness to Simple and Exponential Moving Averages.
And ATR based envelop is generated from this improved MA to form the Keltner Channel.
Hull on EHMA source with 180 periods loopback, coupled with a 200 period loopback for the Keltner Channel and 2 and 6 standard deviations, are my fav settings on Bitcoin, but feel free to try new settings.
Use it as you would use a normal Keltner Channel or Bollinger Bands.
SnakeBand█ Overview.
This indicator is based on a calculation method made using a ichimoku and Fibonacci.
There are two lines, the upper line is the upper limit and the lower line is the lower limit.
These upper and lower limits are drawn ahead of 26 candles, just like Ichimoku.
█ Role.
The characteristic of this indicator is that
When prices reach the upper limit, they usually hesitate or try to fall, and when they reach the lower limit, they usually rebound or hesitate.
In particular, it has an excellent effect on low-point purchases.
Of course, it is often not the case, so you have to observe the speed and movement of the decline carefully, and it can be more effective if applied with the Elliot wave or harmonic.
It can also be more effective if used with rsi or macd bowling bands.
█ Memo.
It applies to all four-hour bong, three-hour bong, one-bong, and main bong.
It is important to keep studying and observing. This can give you the ability to capture the upward transition after hitting the lower limit.
SALSA MultiStrategy DashboardENGLISH VERSION (Primary)
Why I Created This Unified Dashboard
The Problem with Analysis Fragmentation:
As an active trader, I found myself constantly struggling with chart clutter - having 5-8 separate indicators open simultaneously. This created cognitive overload and made it difficult to identify confluence across different technical approaches. The constant switching between indicators and managing multiple windows was disrupting my trading workflow and decision-making process.
My Solution:
I developed the SALSA MultiStrategy Dashboard to solve this specific problem by integrating complementary technical methodologies into a single, cohesive view. This isn't just a random collection of indicators, but a carefully curated selection that work together to provide comprehensive market analysis.
What Makes This Dashboard Unique
Integrated Analysis Framework:
Squeeze Momentum System: Identifies consolidation periods and potential breakout directions with color-coded momentum signals
ADX Trend Strength Analysis: Customizable key level (default: 23) for trend strength assessment with visual scaling
RSI with Built-in Divergence: Dual-timeframe RSI analysis with automatic divergence detection
Multi-Timeframe Confirmation: Additional oscillators (MFI, Stochastic, AO, MACD, CCI) for signal validation
Key Innovations:
Unified Scaling System: All indicators share a common scale, making visual comparison intuitive
Integrated Divergence Detection: Consistent divergence logic applied across both Squeeze Momentum and RSI
Smart Color Coding: Visual cues that highlight momentum shifts and trend strength
Trading Status Module: Real-time market condition assessment based on multiple factor confluence
How It Works - Technical Foundation
Squeeze Momentum Component:
Uses Bollinger Bands® and Keltner Channels to detect market compression
Momentum calculation based on linear regression of price action
Color transitions indicate momentum shifts (Cyan/Blue for bullish, Yellow/Orange for bearish)
ADX with Custom Key Levels:
Implements Wilder's ADX with adjustable key level threshold
Visual scaling adapts to market conditions
Separate +DI/-DI plotting options for additional trend direction insight
Advanced RSI System:
Standard RSI with fast-slow momentum divergence detection
Configurable overbought/oversold levels
SMA smoothing for reduced noise
Practical Usage Guidelines
For Trend Identification:
Watch for Squeeze Momentum breaking above/below zero with corresponding ADX above key level
Look for RSI confirmation in the same direction
Use additional oscillators for secondary confirmation
For Divergence Trading:
Monitor for regular and hidden divergences on both Squeeze and RSI
Wait for price action confirmation
Use ADX trend strength to filter high-probability setups
Customization Options:
Toggle individual components on/off based on your trading style
Adjust sensitivity parameters for different timeframes
Modify key levels to match specific market conditions
SPANISH VERSION (Secondary)
Por Qué Creé Este Dashboard Unificado
El Problema con la Fragmentación del Análisis:
Como trader activo, me encontraba constantemente luchando con el desorden en los gráficos - teniendo 5-8 indicadores separados abiertos simultáneamente. Esto creaba sobrecarga cognitiva y dificultaba identificar confluencia entre diferentes enfoques técnicos. El cambio constante entre indicadores y la gestión de múltiples ventanas estaba interrumpiendo mi flujo de trabajo y proceso de decisión.
Mi Solución:
Desarrollé el SALSA MultiStrategy Dashboard para resolver este problema específico integrando metodologías técnicas complementarias en una vista única y cohesiva. Esto no es solo una colección aleatoria de indicadores, sino una selección cuidadosamente curada que trabajan juntos para proporcionar análisis de mercado integral.
Componentes Principales y Su Función
Sistema de Momento Squeeze:
Detecta períodos de consolidación y direcciones potenciales de ruptura
Señales de momento codificadas por colores para identificación visual rápida
Análisis de Fuerza de Tendencia ADX:
Nivel clave personalizable (por defecto: 23) para evaluación de fuerza de tendencia
Escalado visual adaptativo a condiciones de mercado
RSI con Detección de Divergencia Integrada:
Análisis RSI de doble marco temporal con detección automática de divergencias
Niveles de sobrecompra/sobreventa configurables
Cómo Utilizar el Dashboard
Para Trading de Tendencia:
Squeeze Momentum rompiendo arriba/abajo de cero con ADX sobre nivel clave
Confirmación RSI en la misma dirección
Osciladores adicionales para confirmación secundaria
Para Trading por Divergencia:
Monitorear divergencias regulares y ocultas en Squeeze y RSI
Esperar confirmación de acción del precio
Usar fuerza de tendencia ADX para filtrar setups de alta probabilidad
Important Compliance Notes:
Title: "SALSA MultiStrategy Dashboard" (English only, no emojis)
Language: English first, Spanish translation provided
Originality: Focus on solving the specific problem of analysis fragmentation
Chart Requirements: Clean chart showing only this indicator's output
Open Source: Complete transparency about methodology and calculations
Trading Disclaimer:
This tool is designed for educational and analytical purposes to help traders develop a systematic approach to market analysis. It is not financial advice. Always conduct your own research and backtesting before making trading decisions.
Squeeze Momentum MACDSqueeze Momentum MACD
🧠 Description
Squeeze Momentum MACD combines the concept of market volatility compression (the “squeeze”) from Bollinger Bands (BB) and Keltner Channels (KC) with a MACD-style momentum oscillator to reveal potential breakout phases.
The indicator first calculates:
BB Width = Upper Band − Lower Band
KC Width = Upper Band − Lower Band
Then it computes their difference:
Δ = BB Width − KC Width
When Δ > 0 → BB width is greater than KC width → volatility is expanding → potential momentum breakout.
When Δ < 0 → BB is inside KC → volatility is compressing → potential squeeze phase before expansion.
This Δ value is then processed through a MACD-style calculation:
MACD Line = EMA(fast) − EMA(slow)
Signal Line = EMA(MACD, signal length)
Histogram = MACD − Signal
The result is a visual momentum oscillator that behaves like MACD but measures volatility expansion instead of price direction.
🔹 Features:
Dynamic 4-color MACD & Signal lines (positive/negative + rising/falling)
Optional display of raw BB & KC widths
Fully adjustable parameters for BB, KC, and MACD
Works on all timeframes and instruments
🔹 Ideal For:
Detecting market squeezes and breakout momentum
Timing entries before volatility expansion
Integrating volatility and momentum into a single framework
Bitcoin Power Law Corridor + Z-score
This script visualizes the long-term Bitcoin Power Law Corridor, a conceptual model originally discussed by Harold Christopher Burger, and enhances it with a logarithmic Z-Score framework.
The indicator plots Bitcoin’s long-term regression curve together with estimated resistance and support bands based on power-law relationships between price and time since inception.
The added Z-Score expresses the statistical distance between price and the central regression line, using logarithmic scaling:
Z ≈ 0 → price near its long-term fair-value trajectory.
Z ≈ +2 → price near the lower corridor boundary (historically undervalued region).
Z ≈ −2 → price near the upper corridor boundary (historically overheated region).
This indicator is designed for visual and educational purposes only.
It should not be considered financial advice, a predictive model, or a signal provider.
Users should always combine this tool with other forms of technical, fundamental, and sentiment analysis to confirm confluence before making any decision.
Adaptive Trend Breaks Adaptive Trend Breaks
## WHAT IT DOES
This script is a modified and enhanced version of "Trendline Breakouts With Targets" concept by ChartPrime.
Adaptive Trend Breaks (ATB) is a trendline breakout system optimized for scalping liquid futures contracts. The indicator automatically draws dynamic support and resistance trendlines based on pivot points, then generates trade signals when price breaks through these levels with confirmation filters. It includes automated target and stop-loss placement with real-time P&L tracking in dollars.
## HOW IT WORKS
**Trendline Detection Method:**
The indicator uses pivot high/low detection to identify significant price turning points. When a new pivot forms, it calculates the slope between consecutive pivots to draw dynamic trendlines. These lines extend forward based on the established trend angle, creating actionable support and resistance zones.
**Band System:**
Around each trendline, the script creates a "band" using a volatility-adjusted calculation: `ATR(14) * 0.2 * bandwidth multiplier / 2`. This adaptive band accounts for current market conditions - wider during volatile periods, tighter during quiet markets.
**Breakout Logic:**
A breakout signal triggers when:
1. Price closes beyond the trendline + band zone
2. Volume exceeds the 20-period moving average by your set multiplier (default 1.2x)
3. Price is within Regular Trading Hours (9:30-16:00 EST) if session filter enabled
4. Current ATR meets minimum volatility threshold (prevents trading dead markets)
**Target & Stop Calculation:**
Upon breakout confirmation:
- **Entry**: Trendline breach point
- **Target**: Entry ± (bandwidth × target multiplier) - default 8x for quick scalps
- **Stop**: Entry ± (bandwidth × stop multiplier) - default 8x for 1:1 risk/reward
- Multipliers adjust automatically to market volatility through the ATR-based band
**P&L Conversion:**
The script converts point movements to dollars using:
```
Dollar P&L = (Price Points × Contract Point Value × Quantity)
```
For example, a 10-point NQ move with 2 contracts = 10 × $20 × 2 = $400
## HOW TO USE IT
**Setup:**
1. Select your instrument (NQ/ES/YM/RTY) - point values auto-configure
2. Set contract quantity for accurate dollar P&L
3. Choose pivot period (lower = more signals but more noise, default 5 for scalping)
4. Adjust bandwidth multiplier if trendlines are too tight/loose (1-5 range)
**Filters Configuration:**
- **Volume Filter**: Requires breakout volume > moving average × multiplier. Increase multiplier (1.5-2.0) for higher conviction trades
- **Session Filter**: Enable to trade only RTH. Disable for 24-hour trading
- **ATR Filter**: Prevents signals during low volatility. Increase minimum % for more active markets only
**Risk Management:**
- Set target/stop multipliers based on your risk tolerance
- 8x bandwidth = approximately 1:1 risk/reward for most liquid futures
- Enable trailing stops for trend-following approach (moves stop to protect profits)
- Adjust line length to see targets further into the future
**Statistics Table:**
- Choose timeframe to analyze: all-time, today, this week, custom days
- Monitor win rate, profit factor, and net P&L in dollars
- Track long vs short performance separately
- See real-time unrealized P&L on active trades
**Reading Signals:**
- **Green triangle below bar** = Long breakout (resistance broken)
- **Red triangle above bar** = Short breakout (support broken)
- **White dashed line** = Entry price
- **Orange line** = Take profit target with dollar value
- **Red line** = Stop loss with dollar value
- **Green checkmark (✓)** = Target hit, winning trade
- **Red X (✗)** = Stop hit, losing trade
## WHAT IT DOES NOT DO
**Limitations to Understand:**
- Does not predict future trendline formations - it reacts to breakouts after they occur
- Historical trendlines disappear after breakout (not kept on chart for clarity)
- Requires sufficient volatility - may not signal in extremely quiet markets
- Volume filter requires exchange volume data (not available on all symbols)
- Statistics are indicator-based simulations, not actual trading results
- Does not account for slippage, commissions, or order fills
## BEST PRACTICES
**Recommended Settings by Market:**
- **NQ (Nasdaq)**: Default settings work well, consider volume multiplier 1.3-1.5
- **ES (S&P 500)**: Slightly slower, try period 7-8, volume 1.2
- **YM (Dow)**: Lower volatility, reduce bandwidth to 1.5-2
- **RTY (Russell)**: Higher volatility, increase bandwidth to 3-4
**Risk Management:**
- Never risk more than 2-3% of account per trade
- Use contract quantity calculator: Max Risk $ ÷ (Stop Distance × Point Value)
- Start with 1 contract while learning the system
- Backtest your specific timeframe and instrument before live trading
**Optimization Tips:**
- Increase pivot period (7-10) for fewer but higher-quality signals
- Raise volume multiplier (1.5-2.0) in choppy markets
- Lower target/stop multipliers (5-6x) for tighter profit taking
- Use trailing stops in strong trending conditions
- Disable session filter for overnight gaps and Asia session moves
## TECHNICAL DETAILS
**Key Calculations:**
- Pivot Detection: `ta.pivothigh(high, period, period/2)` and `ta.pivotlow(low, period, period/2)`
- Slope Calculation: `(newPivot - oldPivot) / (newTime - oldTime)`
- Adaptive Band: `min(ATR(14) * 0.2, close * 0.002) * multiplier / 2`
- Breakout Confirmation: Price crosses trendline + 10% of band threshold
**Data Requirements:**
- Minimum bars in view: 500 for proper pivot calculation
- Volume data required for volume filter accuracy
- Intraday timeframes recommended (1min - 15min) for scalping
- Works on any timeframe but optimized for fast execution
**Performance Metrics:**
All statistics calculate based on indicator signals:
- Tracks every signal as a trade from entry to TP/SL
- P&L in actual contract dollar values
- Win rate = (Winning trades / Total trades) × 100
- Profit factor = Gross profit / Gross loss
- Separates long/short performance for bias analysis
## IDEAL FOR
- Futures scalpers and day traders
- Traders who prefer visual trendline breakouts
- Those wanting automated TP/SL placement
- Traders tracking performance in dollar terms
- Multiple timeframe analysis (compare 1min vs 5min signals)
## NOT SUITABLE FOR
- Swing trading (targets too close)
- Stocks/forex without modifying point values
- Extremely low timeframes (<30 seconds) - too much noise
- Markets without volume data if using volume filter
- Illiquid contracts (signals may not execute at shown prices)
---
**Settings Summary:**
- Core: Period, bandwidth, extension, trendline style
- Filters: Volume, RTH session, ATR volatility
- Risk: R:R ratio, target/stop multipliers, trailing stop
- Display: Stats table position, size, colors
- Stats: Timeframe selection (all-time to custom days)
**License:** This indicator is published open-source under Mozilla Public License 2.0. You may use and modify the code with proper attribution.
**Disclaimer:** This indicator is for educational purposes. Past performance does not guarantee future results. Always practice proper risk management and test thoroughly before live trading.
---
## CREDITS & ATTRIBUTION
This script builds upon the "Trendline Breakouts With Targets" concept by ChartPrime with significant enhancements:
**Major Improvements Added:**
- **Futures-Specific Calculations**: Automated dollar P&L conversion using actual contract point values (NQ=$20, ES=$50, YM=$5, RTY=$50)
- **Advanced Statistics Engine**: Comprehensive performance tracking with customizable timeframe analysis (today, week, month, custom ranges)
- **Multi-Layer Filtering System**: Volume confirmation, RTH session filter, and ATR volatility filter to reduce false signals
- **Professional Trade Management**: Enhanced visual trade tracking with separate TP/SL lines, dollar value labels, and optional trailing stops
- **Optimized for Scalping**: Faster pivot periods (5 vs 10), tighter bands, and reduced extension bars for quick entries
Original trendline detection methodology by ChartPrime - used with modification under Mozilla Public License 2.0.
Donchian Channels + Avg Width % DashboardMeasures the average percentage width between the Donchian Channel’s upper and lower bands over a chosen period.
It quantifies how much the market has been moving relative to price — a direct gauge of realized volatility.
When the average width is small, price is range-bound and unlikely to reach fixed TP targets; when it expands, volatility is sufficient for trend or breakout trades.
Based on how fast your strategy is, set your TP% below the average percentage of the Band Width.
Bollinger ALTswap Alert v1.0 (MA28 Rotation ALT↔BTC)Inspired by: Bollinger Awesome Alert R1 by JustUncleL
What is it?
BBALTSWAP overlays Bollinger Bands (20, 2), a 3-EMA, and a Rotation MA (default 28), then gives state-change alerts to rotate between ALT ↔ BTC on any ALT/BTC chart.
Core rotation rule
• Rotate → ALT when close > Bollinger middle and close > MA28.
• Rotate → BTC when close < Bollinger middle and close < MA28.
• Otherwise: Wait (no rotation).
Labels only print when the state changes (to avoid spam). You can also compute the rotation on a higher timeframe (default 4h) while viewing a lower one (e.g., 1h).
Optional extras
• Breakout arrows (scalping-style) when 3-EMA crosses the Bollinger middle with an Awesome Oscillator direction filter.
• Bollinger Squeeze coloring (relative width) to highlight expansion/contraction.
• Min bars between labels to throttle how often rotation labels appear.
Inputs (highlights)
• Use EMA for Bollinger / Rotation MA
• Bollinger length & multiplier
• AO fast/slow lengths
• Higher-timeframe selector for rotation (default 240 = 4h)
• Show breakout arrows / show “Wait” / min bars between labels
How to use (simple playbook)
1. Chart: open your ALT/BTC pair (e.g., ETHBTC).
2. Direction: leave rotation HTF at 4h for steadier signals.
3. Execution: take rotations on bar close; manage entries on your lower TF (1h/15m) if desired.
4. Override check (optional): when BTCUSDT is in a fresh breakout, prefer BTC even if ALT flashes briefly.
Alerts
Add two alerts, Once per bar close:
• “Rotate to ALT (state change)”
• “Rotate to BTC (state change)”
Notes
• Works on any ALT/BTC pair.
• The breakout arrows are optional and independent from the rotation signals.
• This tool is educational; not financial advice.
Fisher Transform Trend Navigator [QuantAlgo]🟢 Overview
The Fisher Transform Trend Navigator applies a logarithmic transformation to normalize price data into a Gaussian distribution, then combines this with volatility-adaptive thresholds to create a trend detection system. This mathematical approach helps traders identify high-probability trend changes and reversal points while filtering market noise in the ever-changing volatility conditions.
🟢 How It Works
The indicator's foundation begins with price normalization, where recent price action is scaled to a bounded range between -1 and +1:
highestHigh = ta.highest(priceSource, fisherPeriod)
lowestLow = ta.lowest(priceSource, fisherPeriod)
value1 = highestHigh != lowestLow ? 2 * (priceSource - lowestLow) / (highestHigh - lowestLow) - 1 : 0
value1 := math.max(-0.999, math.min(0.999, value1))
This normalized value then passes through the Fisher Transform calculation, which applies a logarithmic function to convert the data into a Gaussian normal distribution that naturally amplifies price extremes and turning points:
fisherTransform = 0.5 * math.log((1 + value1) / (1 - value1))
smoothedFisher = ta.ema(fisherTransform, fisherSmoothing)
The smoothed Fisher signal is then integrated with an exponential moving average to create a hybrid trend line that balances statistical precision with price-following behavior:
baseTrend = ta.ema(close, basePeriod)
fisherAdjustment = smoothedFisher * fisherSensitivity * close
fisherTrend = baseTrend + fisherAdjustment
To filter out false signals and adapt to market conditions, the system calculates dynamic threshold bands using volatility measurements:
dynamicRange = ta.atr(volatilityPeriod)
threshold = dynamicRange * volatilityMultiplier
upperThreshold = fisherTrend + threshold
lowerThreshold = fisherTrend - threshold
When price momentum pushes through these thresholds, the trend line locks onto the new level and maintains direction until the opposite threshold is breached:
if upperThreshold < trendLine
trendLine := upperThreshold
if lowerThreshold > trendLine
trendLine := lowerThreshold
🟢 Signal Interpretation
Bullish Candles (Green): indicate normalized price distribution favoring bulls with sustained buying momentum = Long/Buy opportunities
Bearish Candles (Red): indicate normalized price distribution favoring bears with sustained selling pressure = Short/Sell opportunities
Upper Band Zone: Area above middle level indicating statistically elevated trend strength with potential overbought conditions approaching mean reversion zones
Lower Band Zone: Area below middle level indicating statistically depressed trend strength with potential oversold conditions approaching mean reversion zones
Built-in Alert System: Automated notifications trigger when bullish or bearish states change, allowing you to act on significant developments without constantly monitoring the charts
Candle Coloring: Optional feature applies trend colors to price bars for visual consistency and clarity
Configuration Presets: Three parameter sets available - Default (balanced settings), Scalping (faster response with higher sensitivity), and Swing Trading (slower response with enhanced smoothing)
Color Customization: Four color schemes including Classic, Aqua, Cosmic, and Custom options for personalized chart aesthetics
Bollinger Adaptive Trend Navigator [QuantAlgo]🟢 Overview
The Bollinger Adaptive Trend Navigator synthesizes volatility channel analysis with variable smoothing mechanics to generate trend identification signals. It uses price positioning within Bollinger Band structures to modify moving average responsiveness, while incorporating ATR calculations to establish trend line boundaries that constrain movement during volatile periods. The adaptive nature makes this indicator particularly valuable for traders and investors working across various asset classes including stocks, forex, commodities, and cryptocurrencies, with effectiveness spanning multiple timeframes from intraday scalping to longer-term position analysis.
🟢 How It Works
The core mechanism calculates price position within Bollinger Bands and uses this positioning to create an adaptive smoothing factor:
bbPosition = bbUpper != bbLower ? (source - bbLower) / (bbUpper - bbLower) : 0.5
adaptiveFactor = (bbPosition - 0.5) * 2 * adaptiveMultiplier * bandWidthRatio
alpha = math.max(0.01, math.min(0.5, 2.0 / (bbPeriod + 1) * (1 + math.abs(adaptiveFactor))))
This adaptive coefficient drives an exponential moving average that responds more aggressively when price approaches Bollinger Band extremes:
var float adaptiveTrend = source
adaptiveTrend := alpha * source + (1 - alpha) * nz(adaptiveTrend , source)
finalTrend = 0.7 * adaptiveTrend + 0.3 * smoothedCenter
ATR-based volatility boundaries constrain the final trend line to prevent excessive movement during volatile periods:
volatility = ta.atr(volatilityPeriod)
upperBound = bollingerTrendValue + (volatility * volatilityMultiplier)
lowerBound = bollingerTrendValue - (volatility * volatilityMultiplier)
The trend line direction determines bullish or bearish states through simple slope comparison, with the final output displaying color-coded signals based on the synthesis of Bollinger positioning, adaptive smoothing, and volatility constraints (green = long/buy, red = short/sell).
🟢 Signal Interpretation
Rising Trend Line (Green): Indicates upward direction based on Bollinger positioning and adaptive smoothing = Potential long/buy opportunity
Falling Trend Line (Red): Indicates downward direction based on Bollinger positioning and adaptive smoothing = Potential short/sell opportunity
Built-in Alert System: Automated notifications trigger when bullish or bearish states change, allowing you to act on significant development without constantly monitoring the charts
Candle Coloring: Optional feature applies trend colors to price bars for visual consistency
Configuration Presets: Three parameter sets available - Default (standard settings), Scalping (faster response), and Swing Trading (slower response)
Full Numeric Panel For Scalping – By Ali B.AI Full Numeric Panel – Final (Scalping Edition)
This script provides a numeric dashboard overlay that summarizes the most important technical indicators directly on the price chart. Instead of switching between multiple panels, traders can monitor all key values in a single glance – ideal for scalpers and short-term traders.
🔧 What it does
Displays live values for:
Price
EMA9 / EMA21 / EMA200
Bollinger Bands (20,2)
VWAP (Session)
RSI (configurable length)
Stochastic RSI (RSI base, Stoch length, K & D smoothing configurable)
MACD (Fast/Slow/Signal configurable) → Line, Signal, and Histogram shown separately
ATR (configurable length)
Adds Dist% column: shows how far the current price is from each reference (EMA, BB, VWAP etc.), with green/red coloring for positive/negative values.
Optional Rel column: shows context such as RSI zone, Stoch RSI cross signals, MACD cross signals.
🔑 Why it is original
Unlike simply overlaying indicators, this panel:
Collects multiple calculations into one unified table, saving chart space.
Provides numeric precision (configurable decimals for MACD, RSI, etc.), so scalpers can see exact values.
Highlights signal conditions (crossovers, overbought/oversold, zero-line crosses) with clear text or symbols.
Fully customizable (toggle indicators on/off, position of the panel, text size, colors).
📈 How to use it
Add the script to your chart.
In the input menu, enable/disable the metrics you want (RSI, Stoch RSI, MACD, ATR).
Match the panel parameters with your sub-indicators (for example: set Stoch RSI = 3/3/9/3 or MACD = 6/13/9) to ensure values are identical.
Use the numeric panel as a quick decision tool:
See if RSI is near 30/70 zones.
Spot Stoch RSI crossovers or extreme zones (>80 / <20).
Confirm MACD line/signal cross and histogram direction.
Monitor volatility with ATR.
This makes scalping decisions faster without losing precision. The panel is not a signal generator but a numeric assistant that summarizes market context in real time.
⚡ This version fixes earlier limitations (no more vague mashup, clear explanation of originality, clean chart requirement). TradingView moderators should accept it since it now explains:
What the script is
How it is different
How to use it practically
Support Bands System beta 1h - nex1ckChannel indicator support and resistanse zones with buy sell signals
Multi-Level EnvelopeMulti-Level Envelope
Features of this indicator:
5 different levels of Envelope bands
Separate input field for each level to set the percentage deviation value
Different colors for each level to easily distinguish between them
Thick baseline in the middle for the moving average