Kozlod - Heikin-Ashi Bar Color Change AlertsYou can use this script to setup alerts on Heikin-Ashi bar color change.
You have to apply this script to usual candles and not Heikin-Ashi!!!
Background color indicates HA bar color. On change you'll see green/red arrows and alert will be fired.
Also you can find in the code calculations of all HA OHLC values.
Cari dalam skrip untuk "bar"

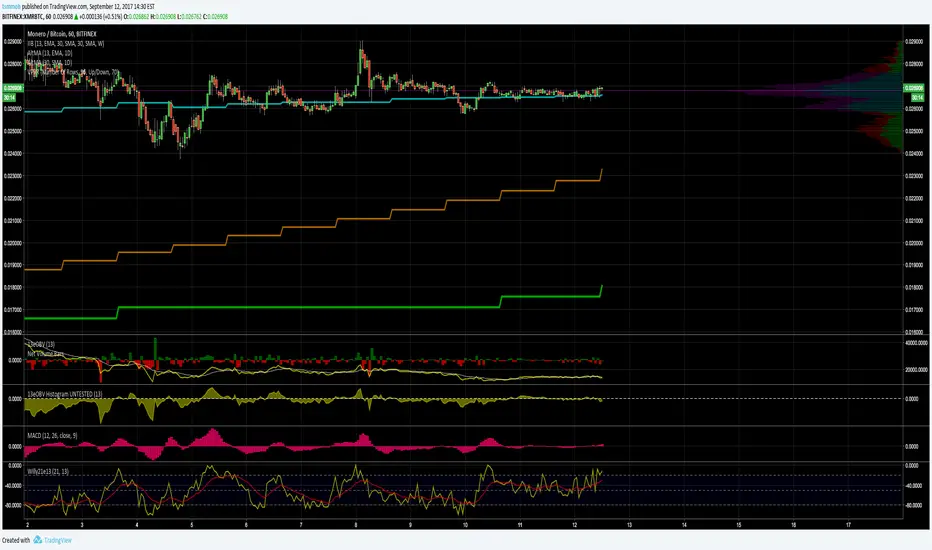
RSI/MFI - MTF - Entry signals/Trend colored bars - JD@version=2
This indicator is designed to give early entry signals as well as to follow trend moves, according to different settings.
The indicator shows a histogram of the RSI ro MFI in relation to an ema of the RSI or MFI.
The histogram is then smoothed to give early reversal/entry signals.
The actual RSI/MFI line with oversold/overbought indication can be displayed or omitted, as preferred.
in addition to the RSI/MFI line or as an alternative to it, the background colour can be set to change folowing the RSI/MFI signals.
The timeframe can be chosen. Higher timeframes (eg. 3h) tend to give less false signals.
version 5.
added support for custom Multiple Time Frame selection.
added option for choice of RSI or MFI as base indicator.
added option for price bar coloring according to the indicator. (deselecting "borders" in the "style" tab is recommended)
price bar coloring can be adjusted for different strategies:
1. following the slope of the histogram (for faster entry/exit signals)
2. according to positive or negative histogram (for longer moves)
3. according to pos. or neg. RSI/MFI (for longer term trend holds)
4. uptrend: biased towards faster buy signals and slower sell signals to stay in the uptrend
5. downtrend: biased towards faster sell signals and slower buy signals to stay in the downtrend
A longer timeframe (eg. 3x) is recommended for following trend moves.
try different strategies to see what works better for RSI or MFI.
JD.

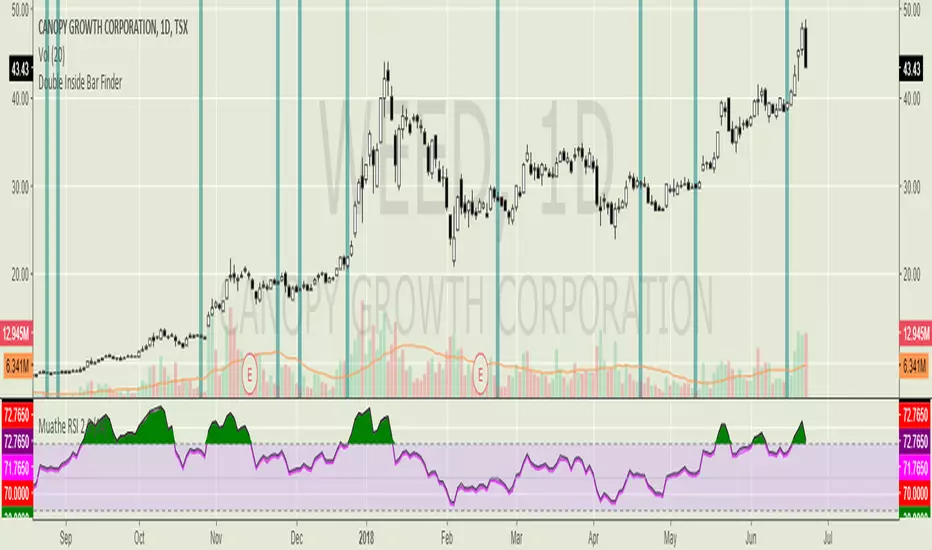
Double Inside Bar FinderHighlights in blue when an inside bar follows an inside bar. Double inside bars (when used on the daily timeframe) are a way of easily finding equilibrium patterns (i.e. pennant shaped price action) on lower time frames. There is usually a strong move in whatever direction these patterns break, so good to have alerts set up for your favourite markets.
BD RSI & STOCH RSI BAR COLOR CHANGERA simple indicator displaying RSI and STOCHASTIC RSI combined in the one indicator. This indicator also changes the bar colour to yellow when it meets the overbrought conditions of both the RSI and the STOCH RSI and changes the bar colour to black when it meets the oversold conditions of both the RSI and STOCH RSI. The values of these conditions are set as the regular defaults but can be changed in the input settings to suit different time frames and user requirements. This does NOT generate signals but simply shows when both the RSI & STOCH RSI are oversold or overbrought.

[MV] %B with SMA + Volume Based Colored Bars
Entry Signal when %B Crosses with SMA and this is more meaningful if it supports colored bars.
Black Bar when prices go down and volume is bigger than 150% of its average, that indicates us price action is supported by a strong bearish volume
Blue Bar when prices go up and volume bigger than 150% of its average, that indicates us price action is supported by a strong bullish volume
VBC author @KIVANCfr3762

Odd Bars Emiliano MesaSimple code which will find and highlight big price movements in a small period of time. This price movements will usually have an opposite reaction of the same size.
Use this indicator under your own risk.
Emiliano Mesa
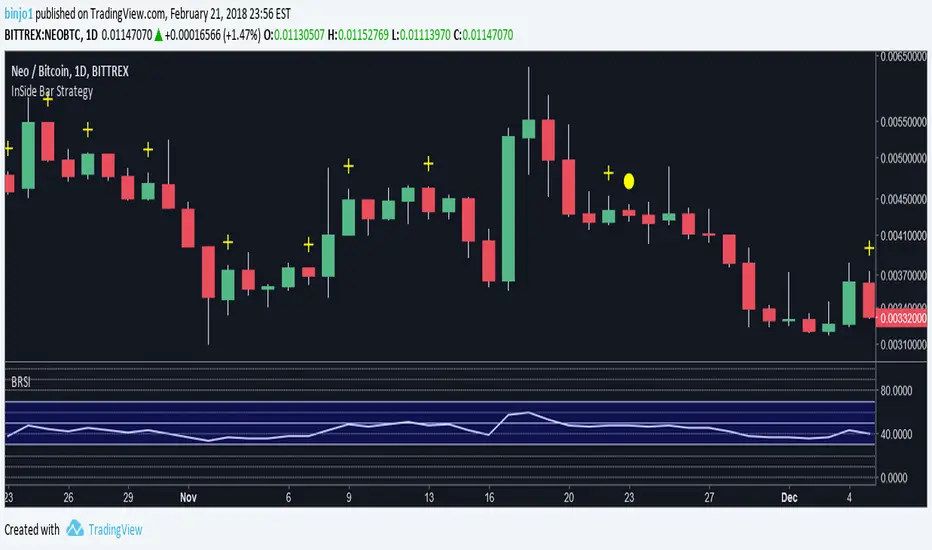
Better Inside BarsIndicates a single inside bar with a yellow plus symbol and two inside bars in a row with a yellow circle.
Closing bars arrowsSimple script which adds arrows above or below bars.
Triangles will appear if close prices is in a above 80% or below 20% of tick price bar.
Default values can be changed from settings.

Calculated projected value one bar aheadcalc_proj - a some calculated value is plotted one bar ahead the current last bar.
This was requested here getsatisfaction.com

Average True Range - without open barBasic ATR without the current open bar in progress, it calculates the closed bars within the chosen ATR Period

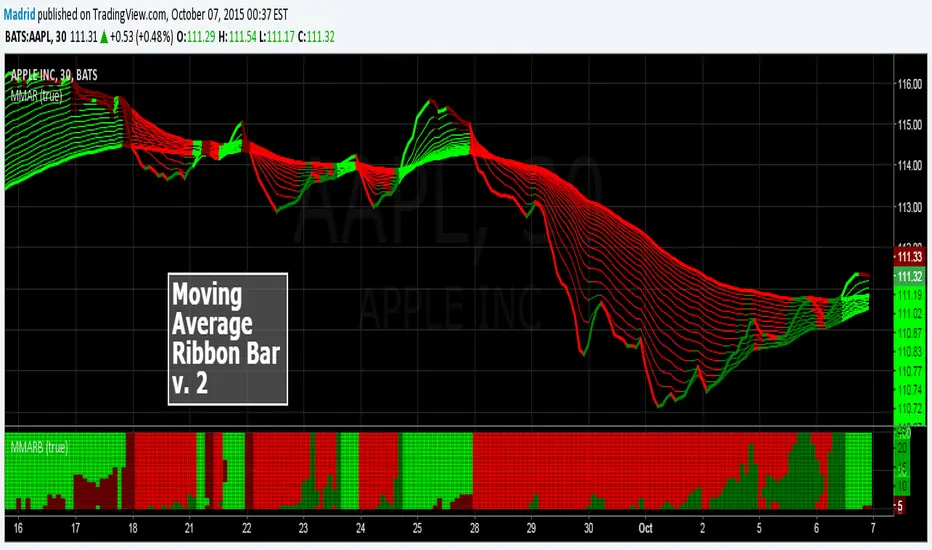
Madrid MA Ribbon Bar v2This script is the second version of the Moving average Ribbon Bar, a companion study of the MA Ribbon. In this version the display is changed, instead of lines, it display the results in stacked bars, making it more user friendly and allowing it to be expanded or contracted without loosing visual continuity.
Binary option trading by two previous barsThis simple script uses the idea of inertia of the market. if 2 previous candles have the same color, current meant to have that too. Following this signal is equal to buying a binary option on the start of the bar (week here). Signals are shown as arrows on the series. The color of the bar shows the outcome of the current option: yellow is success, black is failure. The same outcomes are at the bottom of the chart. The blue line is the total revenue of all options so far. Can be used as template for strategy simulation.

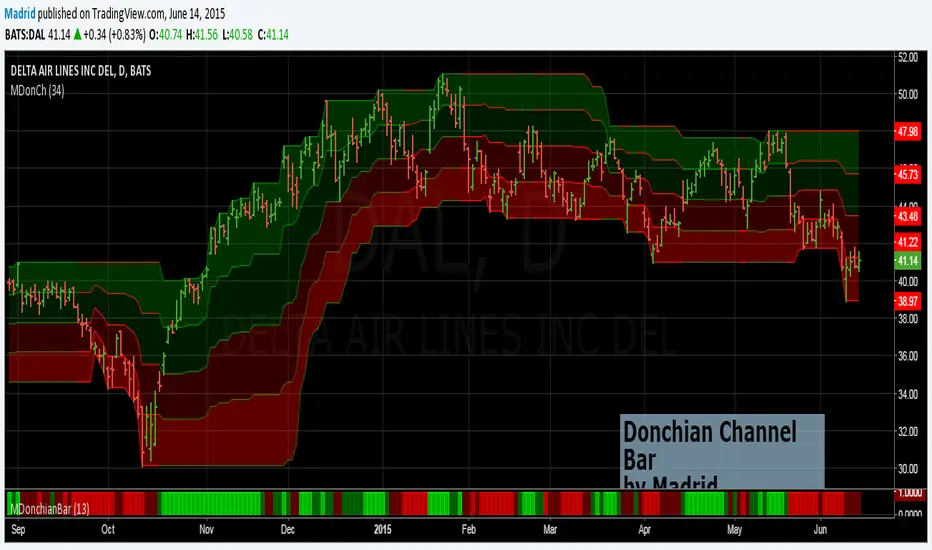
Madrid Donchian BarThis is the companion bar of the Donchian Channel study. This bar at the bottom of the screen depicts the detrended position of the closing price. This is useful to reduce clutter on the screen and locate the position of the closing price at a glance.
Lime ; Extremely Bullish
Green : Bullish
Maroon : Bearish
Red : Extremely Bearish
Engulfing + Pinbar + Inside BarThis indicator combines three powerful candlestick patterns in one tool:
Engulfing Candles (Bullish & Bearish)
Pinbars / Hammers (Reversal signals)
Inside Bars (Consolidation + breakout setup)
Each pattern can be enabled or disabled individually through the settings panel.
Candle colors and labels help you quickly identify strong price action zones.

Gold Pin Bar Pivot Alerts - FixedThis script is designed for the high volatility of Gold (XAU/USD). It identifies Pin Bars with body less than 30% of the candle's total range, and the candle occuring at a structural Pivot High or Pivot Low


Hammer Strategy (CLOSE ON NEXT BAR) [WORKING]Adjustable hammer and inverted hammer candle
Ham? INV? is the hammer
Entry on HAM, INV OR HAM?, INV? close next bar

ZKNZCN Önceki Bar H/L (Ayrı Kontrol)Bir önceki barın high & low noktalarını çizgi halinde görmeyi sağlar.

5-Bar BreakoutThis indicator shows if the price is breaking out above the high or the low of the previous 5 bars

Pivot Points High Low (With confirm bar)This script simply adds a visual circle confirmation to visualise the bar when the pivot has been confirmed. It's based on Pivot Points High Low scripts

9 AM 12-Bar Zoneplaces a 12 bar box around the 9 am hour. The idea is to see if there is a pattern of activity around suspected institutional moves that occur in the opening hour of the new york market
