Inside Bar/Outside Bar/Mother Bar Box By SmartTrader888This Indicator shows:
1. Inside Bar
2. Outside Bar
3. Mother Bar box (Box the mother bar and all subsequent inside bars)
This indicator handles correctly the edge conditions such as:
1. bar close = bar open
2. current bar low equals to mother bar low or current bar high equals mother bar high
Cari dalam skrip untuk "bar"
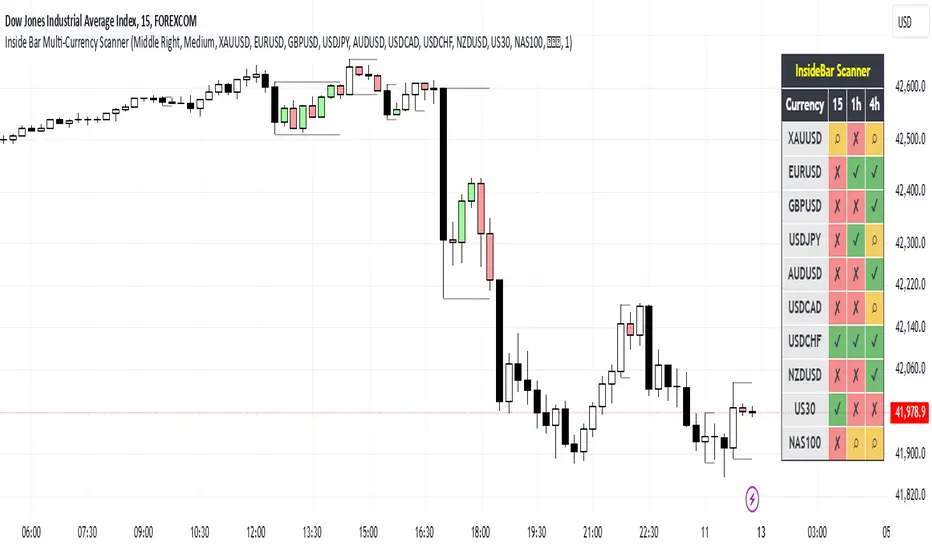
Inside Bar Multi-Currency ScannerDescription:
This script is an Inside Bar Scanner that allows you to monitor multiple currency pairs across different timeframes (15 minutes, 1 hour, and 4 hours). Its main features include:
Inside Bar Detection:
An Inside Bar is a candlestick where both the High and Low are within the range of the previous candle.
The script automatically identifies Inside Bars and displays the results in a table.
Customizable Timeframes:
Supports scanning in 15-minute, 1-hour, and 4-hour timeframes.
Results are displayed for each timeframe separately.
Multi-Currency Support:
Scan up to 10 currency pairs simultaneously.
Currency pairs are customizable and selected by the user.
Candle Coloring:
Inside Bars are highlighted with colors:
Semi-transparent green for bullish Inside Bars.
Semi-transparent red for bearish Inside Bars.
Colors are customizable and selected by the user.
Alerts:
Custom alerts for detecting Inside Bars in selected timeframes.
Receive notifications when an Inside Bar is detected in any of the selected currency pairs.
How to Use:
Select your desired currency pairs from the Scanner Currencies section.
Enable your preferred timeframes in the Scanner Timeframe section.
The script will display a table of results with Inside Bar information for each currency pair and timeframe.
Optionally, customize the candle colors in the Scanner InsideBar Color section.
Additional Explanation for Timeframe Status:
In each selected timeframe, there are three possible states for the candles:
Previous Candle is an Inside Bar:
Displayed with a green background and the symbol ✔.
Previous Candle is NOT an Inside Bar:
Displayed with a red background and the symbol ✘.
Current Candle is an Inside Bar:
Displayed with an orange background and the symbol ⌕.
These visual indicators provide a clear and quick overview of the Inside Bar status for each selected currency pair and timeframe.
Custom ATR with Paranormal Bar FilterCustom ATR with Paranormal Bar Filter
Description:
This indicator calculates a custom ATR (Average True Range) by filtering out bars with unusually large or small price ranges. It helps provide a more accurate measure of market volatility by ignoring outliers.
How it works:
True Range Calculation:
The price range for each bar is calculated.
Bars with ranges much larger or smaller than typical are excluded.
Filtered ATR:
The ATR is calculated using only the bars that pass the filter.
Current Bar Progress:
Measures how much the current bar has moved compared to the filtered ATR, based on the difference between its opening and closing prices.
Display:
A line represents the filtered ATR.
A table shows the filtered ATR, the current bar's range, and its progress relative to the ATR.
Input Settings:
ATR Period: Number of bars used to calculate the ATR.
Filter Window: Number of recent bars used to determine the typical range.
Filter Threshold: Sensitivity of the filter. A higher value allows more bars to pass.
How to Use:
Monitor Volatility:
Use the filtered ATR to understand market volatility while ignoring unusual price movements.
Track Current Bar Progress:
See how much of the ATR the current bar has completed.
Adjust Filter Settings:
Fine-tune the filter to match your trading timeframe and strategy.
This indicator is designed for traders who want to track market volatility without being misled by extreme outlier bars.

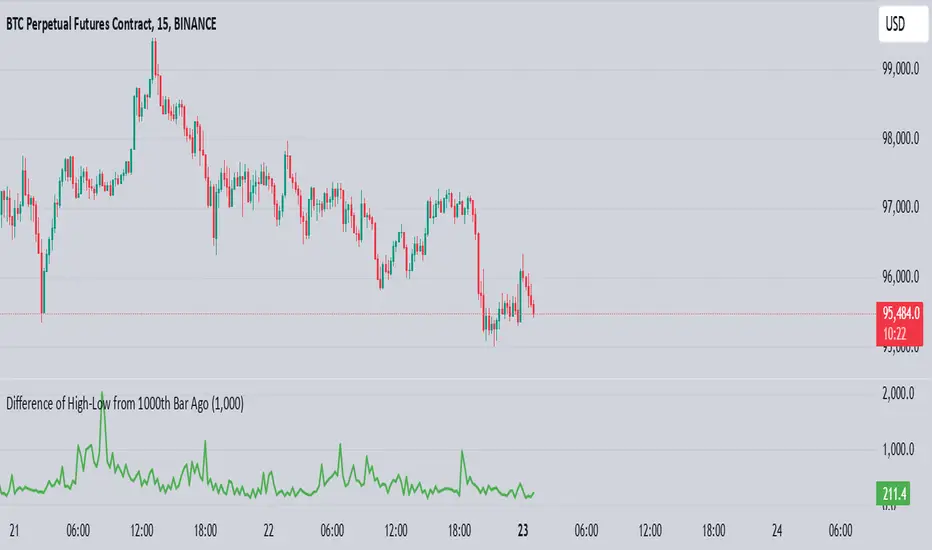
High-Low of X BarOverview
The High-Low of X Bar indicator allows traders to visualize historical high and low values from a specific number of bars ago directly on the chart.
Provides insight into past price action by displaying high, low, and their difference at the most recent bar.
Customizable inputs and color settings for labels enhance usability and visual integration with your chart.
Key Features
Historical Data Analysis: Displays the high, low, and the difference between these values from a specified number of bars ago.
Customizable Inputs: Set the number of bars ago to review historical price points, with a range from 1 to 2000 bars. Premium users can exceed this range.
Dynamic Labeling: Option to show high, low, and difference values as labels on the chart, with customizable text and background colors.
Color Customization: Customize label colors for high, low, and difference values, as well as for cases with insufficient bars.
Inputs
Number of Bars Ago: Enter the number of bars back from the current bar to analyze historical high and low values.
Show High Value: Toggle to display the historical high value.
Show Low Value: Toggle to display the historical low value.
Show Difference Value: Toggle to display the difference between high and low values.
Color Settings
High Label Background Color: Set the background color of the high value label.
High Label Text Color: Choose the text color for the high value label.
Low Label Background Color: Set the background color of the low value label.
Low Label Text Color: Choose the text color for the low value label.
Difference Label Background Color: Set the background color of the difference label.
Difference Label Text Color: Choose the text color for the difference label.
Not Enough Bars Label Background Color: Set the background color for the label shown when there are insufficient bars.
Not Enough Bars Label Text Color: Choose the text color for the insufficient bars label.
Usage Instructions
Add to Chart: Apply the High-Low of X Bar indicator to your TradingView chart.
Configure Settings: Adjust the number of bars ago and display options according to your analysis needs.
Customize Appearance: Set the colors for the labels to match your chart's style.
Analyze: Review the high, low, and their difference directly on your chart for immediate insights into past price movements.
Notes
Ensure your chart has sufficient historical data for the indicator to function properly.
Customize label visibility and colors based on your preference and trading strategy.
[DT] ATR Trigger Bar OverlayATR Trigger candle is an idea that I originally heard about studying alexander elder's work at spike trade. This code is my interpretation of his work.
The idea behind an ATR trigger bar is to find areas where price is likely trapping market participants. In some cases a trigger will not form in one bar so a two bar analysis is also included in study.
Bull trap condition:
- price moves above previous bar high and in the same candle will close below previous bar close
Bear trap condition:
- price moves below previous bar low and in the same candle will close above previous bar close
TODO:
- categorize trigger bar as 1 bar or 2 bar price action
- allow user to filter 1 bar or 2 bar price action
- multiple timeframes
- volume filter
- horizontal line for average price on a trigger bar

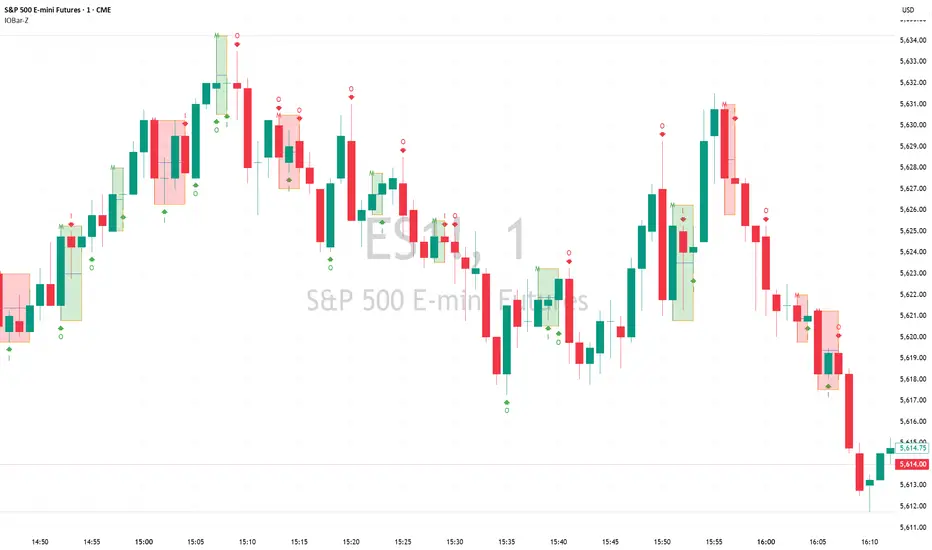
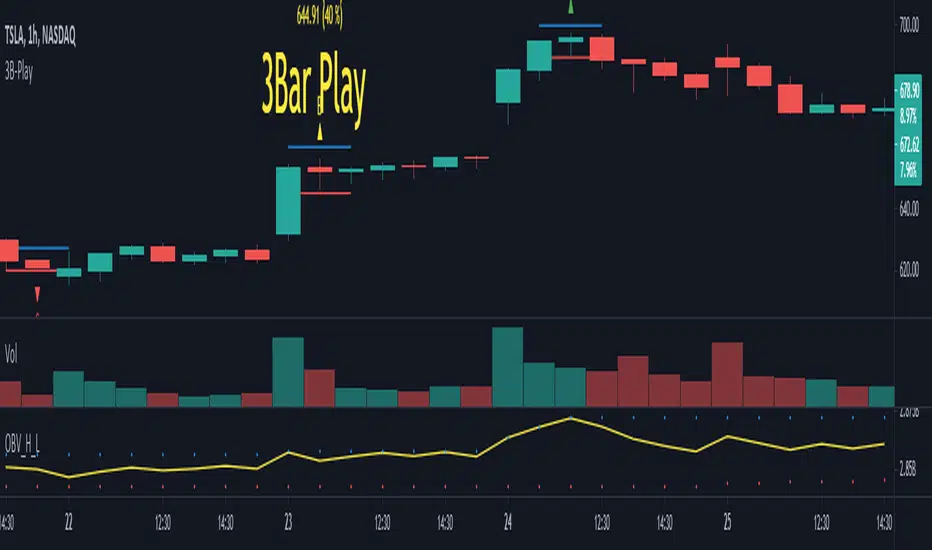
3B-Play Finder1 - Objective
2 - How to use (Theory)
3 - How to use (Grade System)
4 - Inputs
5 - Extras and Alerts
6 - Notes
Objective
This script aims to mark 3 Bar play patterns (both short and long) by identifying them on the chart, with an arrow pointing up from long and down for short. Aswell, setting alerts based on grade.
Following the base concept, this script comes with a "grade" system (A, B, C), which aims to classify 3B-Play according to input parameters.
2 - How to use (Theory)
The pattern is described by a wide range Ignite bar followed by a narrow resting bar.
Long
Given a 3 Bar play pattern, with a wide range green bar, the entry point should be above the ignite and narrow bar wicks (high) with stop loss set below the resting bar wick low but within ignite wide range bar.
The exit depends on the chart analysis, and there is no set rule for it.
Short
Similar to long but is with a wide range red bar and entry is defined on wick low and stop-loss at wick high.
3 - How to use (Grade System)
Since 3B-play come in all sort of shapes, some are "textbook" perfect, others a bit more "loose". I set a grading system, to differentiate each one.
The way the 3 Bar play quality is determined is based on the percentage size of the resting bar in relation to igniting bar size, starting from de close. An example of how this works is the following. Note: enabling the extra draws lines helps visually to adjust the grades to your preference.
4 - Inputs
3B Quality section
Enable/disable each grade.
CONTROL LONG / SHORT
Set the percentage values for each grade.
Extras
Enable/Disable extra plots.
5 - Extras and Alerts
This script comes with an extra section, enabling it, draws lines on the max and min values, as well, showing the values in text and the set percentage.
Also, you can set alerts based on the grade and short/long, note you should set the alert to bar close to avoid pre-trigger warnings.
6 - Notes
The script can be shorted a lot, by only looking for a single 3 bar play, to less than 30 lines.
Popgun Bar PatternI created this script to research the trading effectiveness of the Popgun Bar Pattern.
The Popgun Bar Pattern is found when 3 candlesticks in order form the following pattern:
0. Any bar that is then followed by:
1. An inside bar. This is a bar that is completely engulfed by the bar before it. It will have a lower high and a higher low than the previous bar.
2. An outside bar immediately after. This is a bar that completely engulfs the prior inside bar. It will have a higher high and a lower low than the previous bar.
Simply put, the Popgun Bar Pattern is an inside bar followed by an outside bar.
I would highly recommend incorporating this signal as a "trigger" for existing technical analysis. Used in isolation it may not have a high probability of success.
To make it more effective as a trigger to a trading signal I incorporated into my code an Entry, Stop, and a Target dot.
The Entry dot is offset from the low of a bearish Popgun Bar Pattern or the high of a bullish Popgun Bar Pattern by a factor of ATR. The default ATR percentage is 33% but can be adjusted.
The Stop dot is based on the recent highest high (bearish) or lowest low (bullish) of a set range (default is 9 bars) plus/minus the ATR percentage buffer.
The Target dot is automatically calculated from the entry based on a configurable reward factor (default is 3) from the entry to stop distance. This projects a potential 3:1 reward/risk trade by default.
There is an additional alert condition which can be configured at the end of the script.

Probability: Bull/Bear Dominance | Ratio | Bar CountIntro
What's the probability of the next bar being red? How about green? Well, there are many ways to quantify the probability but I am presenting just one stupidly simple (but generally accurate) way to measure it.
Strangely... no one has done this before that I can find. I try to check if someone else has done it first (Pro Tip: Plz do this. We honestly don't need the 5 trillionth "MTF MAs" script.)
Indicator
Its a basic counting script, but the nice thing about this script is you choose the time range. It starts counting from a specified point of your choosing. It counts up the bull bars and bear bars separately.
Bull Bar = Close > Open
Bear Bar = Open > Close
You can look at them in sum or as a ratio of Green Bars : Red Bars
I know, it's almost too simple. But, here's some interesting food for thought from a layman to fellow laymen.
Analysis/Edge
Between the time of candle open and candle close, the price can do one of three things, close higher, close lower, or close equal to.
'Equal to' is rare on higher timeframes in liquid markets and it provides no useful information. Thus, we'll nix it for purposes of this conversation.
So boil it down. The next candle is going to be a red candle or a green candle.
It is popular to refer to the general probability of most candles as 50/50, with trader's mission in life being to seek an edge that tilts the probabilities slightly in their favor.
The truth is the odds are probably never actually 50/50, but knowing the precisely correct probability is unknowable, just like the accuracy of a weather forecast is inherently unknowable. What we're trying to do as traders is develop systems that give us predictive probabilistic outcomes that correspond with future realities based on various ways of measuring the market (most often heavily dependent on the past).
The reality is that the market can be measured in many, many different ways. The important thing is that you measure it in a way that is accurate, relevant, and universally applicable.
So look at this indicator here:
You start from a point in time on a chosen timeframe and you put red bars in the red column, green in the green column, and count them all up.
Then you make a ratio, in this case, Green : Red.
What the ratio shows you is the percentage of green bars compared to red bars . At the time of this screenshot, the 4h on the SPX starting from the 2020 bottom is showing a ratio of 1.2.
This means there have been 20% more green bars than there have been red bars.
Now there are 1,000 directions you can take this discussion. What is the overall volatility picture, the size of the red bars vs the green bars, what happens if you miss out on the 5 biggest green bars... so many more variables that you would need to take into account to develop a true edge from this idea. But, the bottom line fact (which is what I like about this) is that we can take this data and say with a certain level of confidence that on the SPX you have a 20% better shot at making money (otherwise stated there's a 60/40 chance) if you open a LONG trade at the beginning of a 4h candle than if you open a short.
That's useful information. One could argue that it's not a complete strategy in and of itself (although I bet it could be with a couple of additional parameters). But I can tell you, based on the 4h candles in the 2020 rally if you open a short, the deck is stacked against you from this perspective. And we can actually somewhat demonstrate this to be true for our dataset because we can look at the price history and see who likely made more money. The SPX is up 1000pts off the bottom. So, thus far, for this dataset, it rings true; Bulls have been doing way better in the latter part of 2020 than the bears.
Conclusion
Predictive systems with a small number of variables tend to be more robust than a system with many variables when applied to a complex system. I may keep updating this script if people like it and determine aspects like population vs sample size, confidence intervals, volatility, and exclusion of outliers. For now, this is just an opening foray into the basic idea of how we can establish an edge in the markets. It really can be this simple.
Thanks for Reading.

Volatility BarVolatility Bar - Significant Price Movement Alert
This indicator identifies and highlights candles with significant price movements by comparing the current bar's range against historical volatility.
**Key Features:**
- **Orange Bars**: Marks candles with range 135%-175% of the maximum range in the previous N bars (default 4)
- **Red Bars**: Highlights extreme volatility bars exceeding 175% threshold
- **Visual Alerts**: Triangle markers below significant bars for quick identification
- **Background Highlighting**: Optional background coloring for enhanced visibility
- **Statistics Panel**: Real-time display of current range, max historical range, ratio percentage, and alert status
**Use Cases:**
- Identify wide range bars, gap bars, and price expansion patterns
- Spot potential breakout or reversal signals
- Filter out noise while catching meaningful price action
- Alert traders to significant market events requiring attention
**Customizable Parameters:**
- Lookback Period (default: 4 bars)
- Minimum Threshold (default: 135%)
- Maximum Threshold (default: 175%)
**How It Works:**
The indicator calculates the current bar's high-low range and compares it to the highest range among the previous N bars. When the current range exceeds the minimum threshold, it's marked orange. Extreme movements beyond the maximum threshold are marked red, helping you distinguish between normal volatility spikes and extraordinary events.
Perfect for price action traders who want automated alerts for significant market movements without the clutter of false signals.

Inside Bar Detector - 15min
🔍 What is an Inside Bar?
An **Inside Bar** is a candle that forms **entirely within the high and low of the previous candle**. It represents **consolidation**, **indecision**, or **potential reversal**, and is a key signal in The Strat trading method.
🔧 What the Script Does:
1. **Timeframe Restriction**:
* The script activates **only on the 15-minute timeframe**, avoiding clutter on other timeframes.
2. **Inside Bar Logic**:
* It checks whether the **current bar’s high is lower than the previous bar’s high**, **AND** the **current bar’s low is higher than the previous bar’s low**.
* If both conditions are true, it confirms an Inside Bar.
3. **Visual Display**:
* When an Inside Bar is detected, the script **plots a yellow label ("1") above the bar**.
* The label represents the Strat 1-bar and helps you easily spot potential setups.
🎯 Use Case:
* Ideal for **Strat traders**, **price action analysts**, or **any trader** looking for breakout or reversal opportunities.
* Common setups include **1-2**, **1-3**, or **double inside bar** breakouts.

Pin Bar Reversal StrategyStrategy: Pin Bar Reversal with Trend Filter
One effective high-probability setup is a Pin Bar reversal in the direction of the larger trend. A pin bar is a candlestick with a tiny body and a long wick, signaling a sharp rejection of price
By itself, a pin bar often marks a potential reversal, but not all pin bars lead to profitable moves. To boost reliability, this strategy trades pin bars only when they align with the prevailing trend – for example, taking a bullish pin bar while the market is in an uptrend, or a bearish pin bar in a downtrend. The trend bias can be determined by a long-term moving average or higher timeframe analysis.
Why it works: In an uptrend, a bullish pin bar after a pullback often indicates that sellers tried to push price down but failed, and buyers are resuming control. Filtering for pin bars near key support or moving averages further improves odds of success. This aligns the entry with both a strong price pattern and the dominant market direction, yielding a higher win rate. The pin bar’s own structure provides natural levels for stop and target placement, keeping risk management straightforward.
Example Setup:
USDCHF - 4 Hour Chart
Trend SMA 12
Max Body - 34
Min Wick - 66
ATR -15
ATR Stop Loss Multiplier - 2.3
ATR Take Profit Multiplier - 2.9
Minimum ATR to Enter - 0.0025

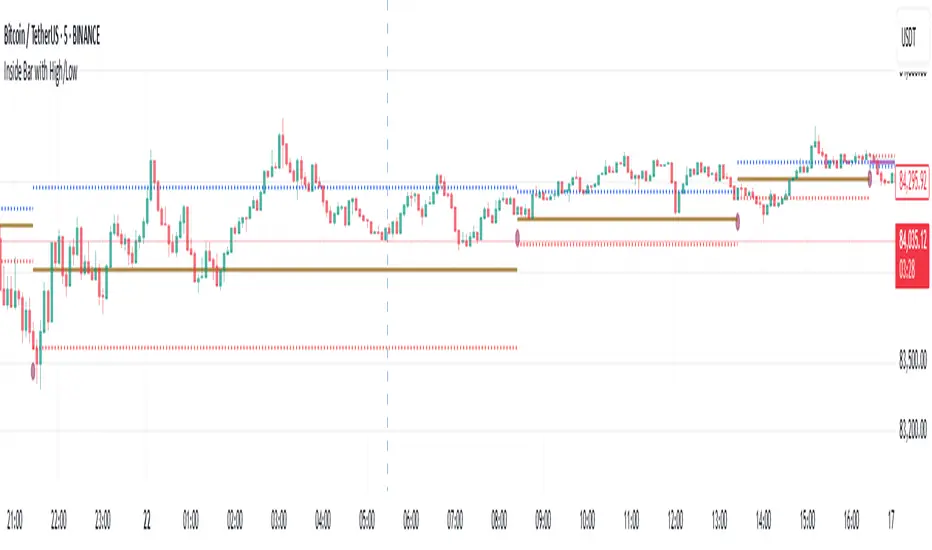
Inside Bar with High/LowInside Bar with High/Low
The indicator plots horizontal mid line between two Inside bars with High / Low with Multi Time Frame Selection by the user which can be traded in trending markets in the direction of the trend, when traded this way they are typically referred to as a ‘Breakout Play’ or an inside bar ‘Price Action Breakout Pattern’ They can also be traded counter-trend, typically from ‘Key Chart Levels’ , when traded this way they are often referred to as ‘Inside Bar Reversals’ .
The classic entry for an inside bar signal is to place a buy stop or sell stop at the high or low of the mother bar, and then when price breakouts above or below the mother bar, your entry order is filled with best time frame preferably more than 1 hour.
Stop loss placement is typically at the opposite end of the mother bar, or it can be placed near the mother bar halfway point (50% level), typically if the mother bar is larger than average.
It’s worth noting that these are the ‘classic’ or standard entry and stop loss placements for an inside bar setup is a useful tool for traders looking to identify potential reversals using the 20/50 EMA and candlestick patterns. However, like any trading tool, it should be used in conjunction with other indicators and analysis techniques for better accuracy
And also this tool is especially useful for day traders who want to track price action during specific times of the day and make informed decisions based on market behavior with more than 60 minutes period
As always, back testing and customization are recommended to optimize performance across different market conditions
In the end, experienced traders may decide on other entries or stop loss placements as they see fit.
Please remember that this indicator is provided for educational purposes only and does not constitute financial advice
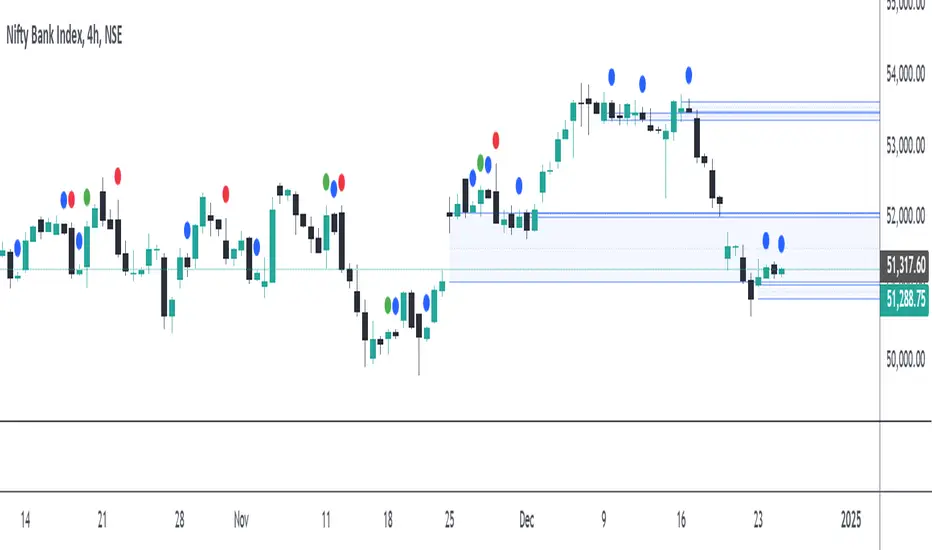
Engulfing Patterns & Inside Bar at NWOGEngulfing Patterns & Inside Bar at NWOG:
This indicator is designed to detect and display specific candlestick patterns (Bearish Engulfing, Bullish Engulfing, and Inside Bar) when they occur at the New Week Open Gap (NWOG). The indicator provides tiny dots plotted at the top of the candle for each detected pattern, keeping the chart clean and minimal. Below is a detailed description of the logic and components:
Candlestick Patterns Detected:
Bearish Engulfing:
A Bearish Engulfing pattern occurs when:
The current candle’s high is above the previous candle’s high.
The current candle’s close is below the previous candle’s low.
This pattern signals a potential downtrend and is marked by a red dot at the top of the candle.
Bullish Engulfing:
A Bullish Engulfing pattern occurs when:
The current candle’s low is below the previous candle’s low.
The current candle’s close is above the previous candle’s high.
This pattern signals a potential uptrend and is marked by a green dot at the top of the candle.
Inside Bar:
An Inside Bar pattern occurs when:
The current candle’s high is lower than the previous candle’s high.
The current candle’s low is higher than the previous candle’s low.
This pattern indicates a period of consolidation and possible breakout or breakdown, and is marked by a blue dot at the top of the candle.
New Week Open Gap (NWOG) Condition:
The patterns (Bearish Engulfing, Bullish Engulfing, and Inside Bar) are only considered valid if the candles occur within or touch the range of the New Week Open Gap (NWOG).
The NWOG is defined as the gap between:
The Friday close (previous week’s closing price).
The Monday open (current week’s opening price).
If the signal patterns (Bullish Engulfing, Bearish Engulfing, Inside Bar) align with the NWOG, a tiny dot is plotted at the top of the candle where the pattern occurs.
Visual Representation:
Red Dots: Indicate Bearish Engulfing signals that occur at the NWOG.
Green Dots: Indicate Bullish Engulfing signals that occur at the NWOG.
Blue Dots: Indicate Inside Bar Breakdown signals that occur at the NWOG.
Each dot is plotted as a tiny circle at the top of the candle, ensuring the chart remains minimal and clean without cluttering the view.
Key Features:
Minimal and Clean: The indicator only plots tiny dots at the top of the candles for the detected signals. No additional lines, labels, or other visual elements clutter the chart.
Customizable Signal Colors: Users can customize the colors for each signal type (Bearish Engulfing, Bullish Engulfing, and Inside Bar).
Alerts: Alerts are included for all detected patterns (Bullish Engulfing, Bearish Engulfing, Inside Bar) at the NWOG.
Alerts:
Bearish Engulfing Detected: Alerts when a Bearish Engulfing pattern occurs at the NWOG.
Bullish Engulfing Detected: Alerts when a Bullish Engulfing pattern occurs at the NWOG.
Inside Bar Breakdown Detected: Alerts when an Inside Bar Breakdown pattern occurs at the NWOG.
This indicator is helpful for traders who want to focus on clean, easy-to-spot patterns and trade based on market conditions near the New Week Open Gap (NWOG). The tiny dots ensure that only relevant signals are displayed without any distractions.
Enhanced Buy/Sell Pressure, Volume, and Trend Bar analysisEnhanced Buy/Sell Pressure, Volume, and Trend Bar Analysis Indicator
Overview
This indicator is designed to help traders identify buy and sell pressure, volume changes, and overall trend direction in the market. It combines multiple concepts like price action, volume, and trend analysis, candlestick anaysis to provide a comprehensive view of market dynamics. The visual elements are intuitive, making it suitable for traders at different levels. This indicator works together with Enhanced Pressure MTF Screener which is a screener based of this indicator to make it easier to see Bullish/Bearish pressures and trend across multiple timeframes.
Image below: is the Enhanced Buy/Sell Pressure, Volume, and Trend Bar Analysis with the Enhanced Pressure MTF Screener indicator both active together.
Key Features
1.Buy/Sell Pressure Identification
Buy Pressure: Calculated based on price movement where the close price is higher than the opening price.
Sell Pressure: Calculated when the closing price is equal to or lower than the opening price.These pressures help you understand whether buyers or sellers are more dominant for each bar.
2.Volume Analysis
Normalized Volume: Volume data is normalized, making it easier to compare volume levels over different periods.
Volume Histogram: The volume is also presented as a histogram for easy visualization, showing whether the current volume is higher or lower compared to the average.
3.Simplified Coloring Option
You can choose to simplify the coloring of bars to reflect the dominant pressure: green for bullish pressure and red for bearish pressure. This makes it visually easier to identify who is in control. When simplified coloring is disabled, the bars' colors will represent the combined effect of buy and sell pressure.
4.Heikin-Ashi Candles for Pressure Calculation
The indicator includes an option to use Heikin-Ashi candles instead of traditional candles to calculate buy and sell pressure. Heikin-Ashi candles are known for smoothing out price action and providing a clearer trend representation.
5.Trend Background Coloring
This feature uses exponential moving averages (EMAs) to determine the trend:
Short-Term EMA vs. Long-Term EMA: When the short-term EMA is above the long-term EMA, the trend is considered bullish, and vice versa.
The background color changes based on the identified trend: green for an uptrend and red for a downtrend. This feature helps visualize the overall market direction at a glance.
6.Signals for Key Price Actions
The indicator plots various symbols to signal important price movements:
Bullish Close (▲): Indicates a strong upward movement where the close price crosses above the open.
Bearish Close (▼): Indicates a downward movement where the close price falls below the open.
Higher High (•): Highlights new highs compared to previous bars, useful for confirming an uptrend.
Lower Low (•): Highlights lower lows compared to previous bars, which can indicate a downtrend or bearish pressure.
Calculations Explained
1.Buy and Sell Pressure Calculation
The buy pressure is determined by the price range (high - low) if the closing price is above the opening price, indicating an increase in value.
The sell pressure is similarly calculated when the closing price is equal to or below the opening price.
The indicator uses the Average True Range (ATR) for normalization. Normalizing helps you compare pressure across different periods, regardless of market volatility.
2.Volume Normalization
Volume Normalization: To make volume comparable across different periods, the indicator normalizes it using the Simple Moving Average (SMA) of volume over a user-defined length.
Volume Histogram: The histogram provides a clear representation of volume changes compared to the average, making it easier to spot unusual activity that may indicate market shifts.
3.Combined Pressure Calculation
The indicator calculates a combined pressure value by subtracting sell pressure from buy pressure.
When combined pressure is positive, buying is dominant, and when negative, selling is dominant. This helps in visually understanding the ongoing momentum.
4.Trend Calculation
The indicator uses two EMAs to determine the trend:
Short-Term EMA (default 14-period) to capture recent price movements.
Long-Term EMA (default 50-period) to provide a broader trend perspective.
By comparing these EMAs on a higher timeframe, the indicator can identify whether the trend is up or down, making it easier for traders to align their trades with the larger market movement.
Inputs and Customization
The indicator provides several options for customization, allowing you to adjust it to your preferences:
SMA Length: Determines the lookback period for moving averages and volume normalization. A longer length provides more smoothing, whereas a shorter length makes the indicator more responsive.
Buy/Sell/Volume Colors: Customize the colors used to represent buying, selling, and volume to suit your preferences.
Heikin Ashi Option: Toggle between using Heikin Ashi or traditional OHLC (Open-High-Low-Close) candles for pressure calculations.
Trend Timeframe and EMA Periods: You can choose different timeframes and EMA periods for trend analysis to suit your trading strategy.
How to Use This Indicator
Identifying Market Momentum: Use the buy/sell pressure columns to see which side (buyers or sellers) is in control. Positive pressure combined with green color indicates strong buying, while red indicates selling.
Volume Confirmation: Check the volume area plot and histogram. High volume coupled with strong pressure is a sign of conviction, meaning the current move has backing from market participants.
Trend Identification: The trend background color helps identify the overall trend direction. Trade in the direction of the trend (e.g., take long positions during a green background).
Signal Indicators: The plotted symbols like "Bullish Close" and "Bearish Close" provide visual signals of key price actions, useful for timing entry or exit points.
Practical use Example
Scenario: The market is consolidating, and you see alternating green and red bars.
Action: Wait for a consistent sequence of green bars (buy pressure) along with a green background (uptrend) to consider going long, although you can go long without having a green background, the background adds confirmation layer.
Scenario: The market has several bearish closes (red ▼ symbols) accompanied by increasing volume.
Action: This could indicate strong selling pressure. If the background also turns red, it might be a good time to exit long positions or consider shorting.
Higher timeframe pressure and volume: Another way to use the indicator is to check buy/sell volume and pressure of the higher timeframe say weekly or daily or any timeframe you consider higher, once you’ve identified or feel confident in which direction the bar is going along with the full picture of trend, you can go to the lower timeframe and wait for it to sync with the higher timeframe to consider a long or a short. It is also easier to see when markets sync up by also applying the Enhanced Pressure MTF Screener which works in companion to this indicator.
Visual Cues and Interpretation
Combined Pressure Plot: The green and red column plot at the bottom of the chart represents the dominance between buying and selling. Tall green bars signify strong buying, while tall red bars indicate selling dominance.
Trend Background: Helps visualize the overall direction without manually drawing trend lines. When the background turns green, it generally indicates that the shorter-term moving average has crossed above the longer-term average—a sign of a bullish trend.
To Summarize shortly
The Enhanced Buy/Sell Pressure, Volume, and Trend Bar Analysis Indicator is an advanced but simple tool designed to help traders visually understand market dynamics. It combines different aspects of market analysis of candle pressure from buyers and sellers, volume confirmation, and trend identification into a single view, which can assist both new and experienced traders in making informed trading decisions.
This indicator:
Saves time by simplifying market analysis.
Provides clear visual cues for buy/sell pressure, volume, and trend.
Offers customizable settings to suit individual trading styles.
Always, I am happy to share my creations with you all for free. If you guys have cool ideas you would like to share, or suggestions for improvements the comment is below and I hope this overview gave an idea of how to use the indicator :D

Inside and Outside BarsInside Bar:
An inside bar forms when the high and low range of a candlestick is within the high and low range of the previous candlestick.
In other words, the current candlestick's high is lower than the previous candlestick's high, and the current candlestick's low is higher than the previous candlestick's low.
Inside bars indicate a period of consolidation or indecision in the market. They often occur after a strong move in price and can signal a potential reversal or continuation of the trend, depending on the context.
Outside Bar:
An outside bar (or engulfing bar) forms when the high and low range of a candlestick completely engulfs the high and low range of the previous candlestick.
In bullish outside bars, the current candlestick's high is higher than the previous candlestick's high, and the low is lower than the previous candlestick's low.
In bearish outside bars, the current candlestick's high is lower than the previous candlestick's high, and the low is higher than the previous candlestick's low.
Outside bars often indicate a significant shift in market sentiment. Bullish outside bars suggest increased bullish momentum, while bearish outside bars suggest increased bearish momentum.

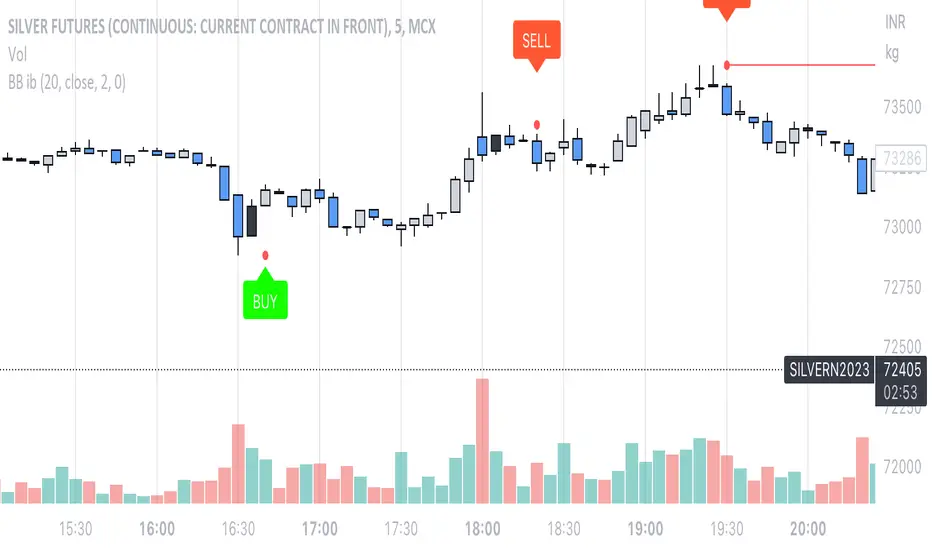
Bollinger Bands Inside barthe indicator name is Bollinger Band inside bar because it uses Bollinger Band and inside bar to take counter-trend positions in the market. whenever this pattern is formed then it can be used to take an entry into the market. the candlestick pattern recognizes 3 candle candlestick. first the mother bar i.e. the medium to the big size candle that intersects with the upper and the lower levels of the Bollinger band. the second candle should be an inside bar i.e. the high and low of the current bar should be less than the previous bar. finally, the last bar who's low should be less than the mother bar in case of the mother bar is at upper levels and if the mother bar is at lower levels then the candle's high should be more than the mother bar. the stop-loss should be high and low of the mother bar respectively. entry should be taken as soon as the low and high of the mother bar is taken out respectively. target should be 1:1 or 20 sma or lower Bollinger band in case the entry is taken from the top. works best if there is a trend and the market takes a pullback and this pattern is formed.
Inside Bar SetupScript Details
- This script plots Inside Bar for given day in selected time-frame (applicable only for Timeframes < Day)
- Basis plotted inside bar, relevant targets are marked on the chart
- Targets can be customised from script settings. Example, if range of mother candle is 10 points, then T1 is 10 * x above/below mother candle and T2 is 10 * y above/below mother candle. This x & y are configured via script settings
How to use this script ?
- This script works well on 10-15 mins timeframe for stocks, 15/30 mins timeframe for nifty index and 30/60 mins time frame for bank nifty index
- If mother candle high is broken, take long trade with SL of mother candle low and if low is broken, take short trade with SL of mother candle high
Remember:
1. Above logic is to be combined with support/resistances i.e. price action. This script is an add-on to price action analysis giving you more conviction.
2. If range of mother candle is very high, it is recommended to avoid the trade.
3. Basis inside bar formed on higher time frame, take trade on basis of lower time frame i.e if inside bar is formed on 60 mins, take trade on the basis of 10-15 mins time frame
Example:
1. As seen in the chart, Nifty is near it's resistance and we are seeing Inside Bar being formed, In such scenario, even if High of Mother Candle is broken, we should be more interested to short as we are near resistance and probability of getting our targets in long side is less.
2. So, if I see breakdown of mother candle i.e. price going below low of mother candle, we will short with SL of high of mother candle.
3. As seen in the chart, both the targets are achieved.
Additional Info:
1. Targets on Long/Short Side can be configured via settings. For indices 1 times/1.5 times the range works well.
2. This script plots targets basis the first inside bar formed in the day for selected time frame.
3. Inside bars formed through out the day are coloured separately but lines are plotted only on the basis of 1st formed inside bar as this strategy works well for the first formed inside bar)
4. Don't forget to check volume in case of breakout/breakdown.
Note:
1. Mother Candle - First Candle of Inside Bar
2. Child Candle - Candle formed inside Mother Candle (Second Candle of Inside Bar)
Happy Trading :)

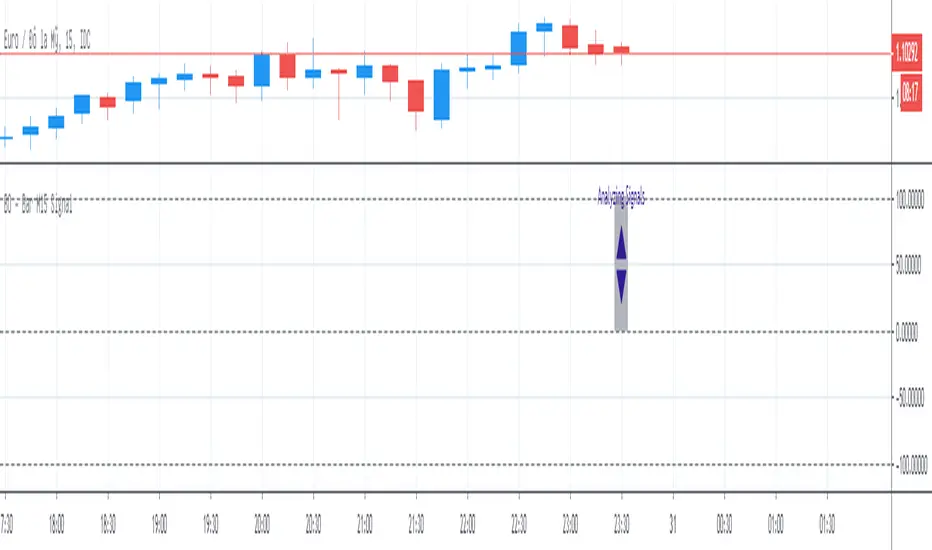
BO - Bar M15 2/3 SignalBO - Bar M15 2/3 Signal show the signal to trade Binary Option with rule below:
A. Indicator
* Bollinger Band (20,2): avoid waterfall
B. Rule of Signal
1. Rule1: Split Bar M15 to 3 part and load them on M5 chart (recommend use M5 IDC chart)
2. Rule 2: Delay 10' after bar M15 open => wait for price's pattern
3. Rule 3: Put Signal row 30-32
* Delay 10' after bar M15 open.
* Direction of 1/3 and 2/3 Bar M15 is upward
* close of 2/3 Bar M15 below upper band Bb(20,2) on M5 chart => avoid strong buy
4. Rule 4: Call Signal row 36-38
* Delay 10' after bar M15 open.
* Direction of 1/3 and 2/3 Bar M15 is downward
* close of 2/3 Bar M15 above lower band Bb(20,2) on M5 chart => avoid strong sell
C. Recommend Expiry time: Bar M15 close
* We try to catch the shadow of Bar M15 but dont trade when price run on the upper or lower band of BB(20,2,M5)

BO - Bar M15 Signal* This script show the signal base on volatility of previous bar M15 to trade Binary Option.
* Rule of Signal is below:
A. Rule 1: Wait for prices created temporary peak and bottom
Row 18: 10 minutes till close
B. Rule 2: Reversal previous bar's direction
1. Put Signal - Row 22 - 25:
- Delay 5' after bar M15 open
- previous bar's direction is upward
- price less than previous close
- temporary bottom greater than previous open
2. Call Signal - Row 29 - 32:
- Delay 5' after bar M15 open
- previous bar's direction is downward
- price greater than previous close
- temporary peak less than previous open
C. Rule 3: Follow previous bar's direction
1. Put Signal - Row 37 - 40:
- Delay 5' after bar M15 open
- previous bar's direction is downward
- price greater than previous open
- temporary peak less than previous peak
2. Call Signal - Row 43 - 46:
- Delay 5' after bar M15 open
- previous bar's direction is upward
- price less than previous open
- temporary bottom greater than previous bottom
Premarket Power Bar StrategyStep 1: Mark Your Levels Before the Open
When: Between 9:00–9:25 AM ET
Premarket High – the highest price before 9:30 AM
Premarket Low – the lowest price before 9:30 AM
Use extended hours view on your chart platform.
These levels act as magnets and turning points once the market opens. They form the foundation for your first trade of the day.
Step 2: Let Price Come to the Level
Do not chase early price action.
Wait for price to approach either the premarket high or low during regular market hours.
Look for a pause, hesitation, or test near the level.
This keeps you from overtrading and forces you to wait for structure to form.
Step 3: Watch for the Power Bar
A power bar is a large-bodied candle with strong momentum and little to no wick on the opposite side.
It should form directly at the premarket level—not near it, not after a breakout.
At the premarket low, a bullish power bar is your buy trigger.
At the premarket high, a bearish power bar signals a short opportunity.
No power bar? No trade. The level and the candle must come together to create the edge.
(BONUS: As you identify specific patterns, eg, double bottoms, double tops, etc. look for those patterns near the premarket high or low)
Step 4: Entry, Stop, and Target
Entry:
For longs: place your order just above the high of the bullish power bar
For shorts: enter just below the low of the bearish power bar
Stop:
Long trade: just under the low of the power bar
Short trade: just above the high of the power bar
Profit Target Options:
VWAP
Prior day’s close
Key support/resistance levels
Keep your trade logic mechanical and consistent.
Execution Guidelines
Only trade when price reacts at your marked level
Wait for the power bar to fully form before entering
Do not jump in early or chase candles that form away from your levels

Bullish & Bearish Once Bar PainterThe Bullish & Bearish First Bar Marker is a simple yet powerful indicator designed to highlight the first bullish and bearish bars in a sequence, helping traders identify key momentum shifts in the market. It marks:Bullish Bars: The first bar where the high and low are both higher than the previous bar (high > high and low > low ), painted green with a "Bullish" label.
Bearish Bars: The first bar where the high and low are both lower than the previous bar (high < high and low < low ), painted red with a "Bearish" label.
To avoid clutter, consecutive bullish or bearish bars are not marked until a non-bullish or non-bearish bar resets the sequence. This makes it ideal for spotting the start of strong upward or downward price movements.

Nifty Smart Zones & Breakout Bars(5min TF only) by Chaitu50cNifty Smart Zones & Breakout Bars is a purpose-built intraday trading tool, tested extensively on Nifty50 and recommended for Nifty50 use only.
All default settings are optimised specifically for Nifty50 on the 5-minute timeframe for maximum accuracy and clarity.
Why Last Bar of the Session Matters
The last candle of a trading session often represents the final battle between buyers and sellers for that day.
It encapsulates closing sentiment, influenced by end-of-day positioning, profit booking, and institutional activity.
The high and low of this bar frequently act as strong intraday support/resistance in the following sessions.
Price often reacts around these levels, especially when combined with volume surges.
Core Features
Session Last-Candle Zones
Plots a horizontal box at the high and low of the last candle in each session.
Boxes extend to the right to track carry-over levels into new sessions.
Uses a stateless approach — past zones reappear if relevant.
Smart Suppression System
When more than your Base Sessions (No Suppression) are shown, newer zones overlapping or within a proximity distance (in points) of older zones are hidden.
Older zones take priority, reducing chart clutter while keeping critical levels.
Breakout Bar Coloring
Highlights breakout bars in four categories:
Up Break (1-bar)
Down Break (1-bar)
Up Break (2-bar)
Down Break (2-bar)
Breakouts use a break buffer (in ticks) to filter noise.
Toggle coloring on/off instantly.
Volume Context (User Tip)
For best use, pair with volume analysis.
High-volume breakouts from last-session zones have greater conviction and can signal sustained momentum.
Usage Recommendations
Instrument: Nifty50 only (tested & optimised).
Timeframe: 5-minute chart for best results.
Approach:
Watch for price interaction with the plotted last-session zones.
Combine zone breaks with bar color signals and volume spikes for higher-probability trades.
Use suppression to focus on key, non-redundant levels.
Why This Tool is Different
Unlike standard support/resistance plotting, this indicator focuses on session-closing levels, which are more reliable than arbitrary highs/lows because they capture the final market consensus for the session.
The proximity-based suppression ensures your chart stays clean, while breakout paints give instant visual cues for momentum shifts.

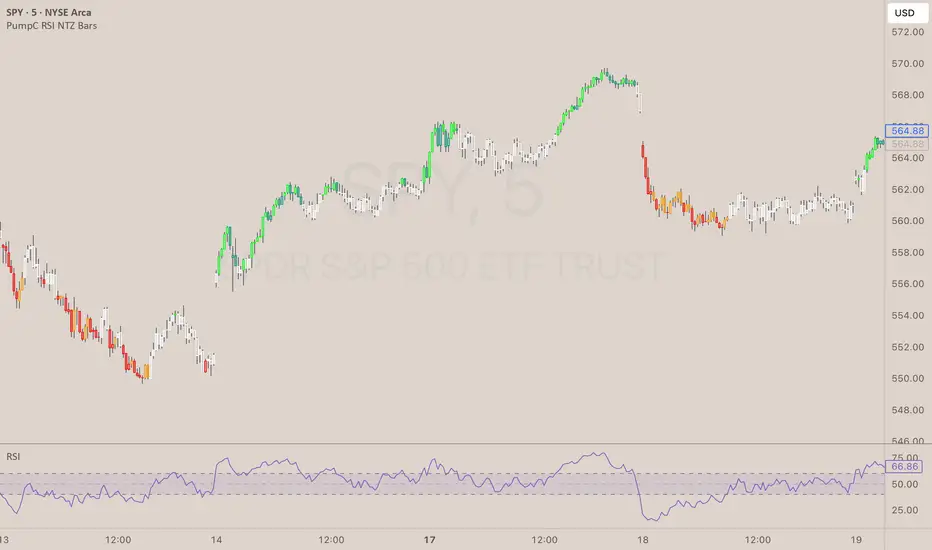
PumpC RSI NTZ BarsPumpC RSI NTZ Bars — Slope-Aware RSI Momentum Overlay
The PumpC RSI NTZ Bars indicator builds on the classic RSI by combining it with slope detection and custom bar highlighting, helping traders quickly identify strong momentum breakouts while avoiding sideways chop — the (NTZ) or No Trade Zone .
What is (NTZ)?
(NTZ) stands for No Trade Zone — the neutral RSI area between bullish and bearish thresholds. In this zone, RSI lacks directional strength, which often reflects indecision or consolidation in price. This indicator helps visually separate the chop from true momentum, so you can trade the breakout, not the noise .
Core Features
Dynamic RSI-Based Bar Coloring with Slope Awareness
Bars change color based on RSI value and its slope:
Bright Green: RSI ≥ Bullish Threshold and sloping upward
Teal Green: RSI ≥ Bullish Threshold but sloping downward
Bright Red: RSI ≤ Bearish Threshold and sloping downward
Orange: RSI ≤ Bearish Threshold but sloping upward
White: RSI is between thresholds (NTZ)
Slope Detection Logic
RSI slope is used to confirm directional bias and filter out weak or fading momentum.
Clean Visual Integration
Choose how signals appear: full bar color, border-only style, background shading, or a mix of all three.
RSI Smoothing Option
Optional smoothing to reduce noise — especially useful on faster timeframes.
Built-In Alerts
RSI crossing above the bullish threshold with an upward slope
RSI crossing below the bearish threshold with a downward slope
User Inputs & Customization Options
RSI Length: Default 14
RSI Source: Default Close
Smooth RSI: On or Off
Smoothing Length: Default 2
Bullish Threshold: Default 60
Bearish Threshold: Default 40
Bar Highlight Style: Full Bar or Border Only
Display Mode: Bar Color, Background, or Both
How to Use It
Step 1 – Adjust Your RSI Settings:
Start by setting the RSI Length (default is 14) and choosing which price source to use — typically close , but you can experiment with hl2 , ohlc4 , etc.
You can also turn on smoothing if you want to reduce noise, especially on fast timeframes like the 1m or 5m chart.
Step 2 – Define Your No Trade Zone (NTZ):
The NTZ is the space between the bullish and bearish thresholds (default 60 and 40).
This is where momentum is weak and price is often ranging or chopping. You don’t want to trade in this zone — you're waiting for RSI to break out of it with conviction.
Step 3 – Choose Your Visual Style:
You can choose to: Highlight the entire candle (Full Bar)
Just highlight the outline (Border Only)
Add a background color behind the chart
Or use a combination of the above This makes the signal easy to see without changing your whole chart look.
Step 4 – Read the Colors for Quick Clarity:
Bright Green / Bright Red = Strong Momentum (with RSI slope confirmation)
Teal / Orange = Momentum is weakening — RSI value is above/below threshold but losing slope strength
White = RSI is in the No Trade Zone (NTZ) — not enough strength to trade
Use this color feedback to stay out during weak periods and act when the trend gains strength.
Step 5 – Use Alerts for Clean Signals:
Set alerts when RSI breaks out of the NTZ with slope confirmation .
These are high-quality signals you can use to trigger your setups or review potential entries.
Disclaimer
This indicator is for educational and informational purposes only and should not be considered financial advice. Always combine tools like this with proper market context and risk management.