All SMAs Bullish/Bearish Screener (Enhanced)All SMAs Bullish/Bearish Screener Enhanced: Uncover High-Conviction Trend Alignments with Confidence
Description:
Are you ready to elevate your trading from mere guesswork to precise, data-driven decisions? The "All SMAs Bullish/Bearish Screener Enhanced" is not just another indicator; it's a sophisticated, yet user-friendly, trend-following powerhouse designed to cut through market noise and pinpoint high-probability trading opportunities. Built on the foundational strength of comprehensive Moving Average confluence and fortified with critical confirmation signals from Momentum, Volume, and Relative Strength, this script empowers you to identify truly robust trends and manage your trades with unparalleled clarity.
The Power of Multi-Factor Confluence: Beyond Simple Averages
In the unpredictable world of financial markets, true strength or weakness is rarely an isolated event. It's the harmonious alignment of multiple technical factors that signals a high-conviction move. While our original "All SMAs Bullish/Bearish Screener" intelligently identified stocks where price was consistently above or below a full spectrum of Simple Moving Averages (5, 10, 20, 50, 100, 200), this Enhanced version takes it a crucial step further.
We've integrated a powerful three-pronged confirmation system to filter out weaker signals and highlight only the most compelling setups:
Momentum (Rate of Change - ROC): A strong trend isn't just about price direction; it's about the speed and intensity of that movement. Positive momentum confirms that buyers are still aggressively pushing price higher (for bullish signals), while negative momentum validates selling pressure (for bearish signals).
Volume: No trend is truly trustworthy without the backing of smart money. Above-average volume accompanying an "All SMAs" alignment signifies strong institutional participation and conviction behind the move. It separates genuine trend starts from speculative whims.
Relative Strength Index (RSI): This versatile oscillator ensures the trend isn't just "there," but that it's developing healthily. We use RSI to confirm a bullish bias (above 50) or a bearish bias (below 50), adding another layer of confidence to the direction.
When the price aligns above ALL six critical SMAs, and is simultaneously confirmed by robust positive momentum, healthy volume, and a bullish RSI bias, you have an exceptionally strong "STRONGLY BULLISH" signal. This confluence often precedes sustained upward moves, signaling prime accumulation phases. Conversely, a "STRONGLY BEARISH" signal, where price is below ALL SMAs with negative momentum, confirming volume, and a bearish RSI bias, indicates powerful distribution and potential for significant downside.
How to Use This Enhanced Screener:
Add to Chart: Go to TradingView's Pine Editor, paste the script, and click "Add to Chart."
Customize Parameters: Fine-tune the lengths of your SMAs, RSI, Momentum, and Volume averages via the indicator's settings. Experiment to find what best suits your trading style and the assets you trade.
Choose Your Timeframe Wisely:
Daily (1D) and 4-Hour (240 min) are highly recommended. These timeframes cut through intraday noise and provide more reliable, actionable signals for swing and position trading.
Shorter timeframes (e.g., 15min, 60min) can be used by advanced day traders for very short-term entries, but be aware of increased volatility and noise.
Visual Confirmation:
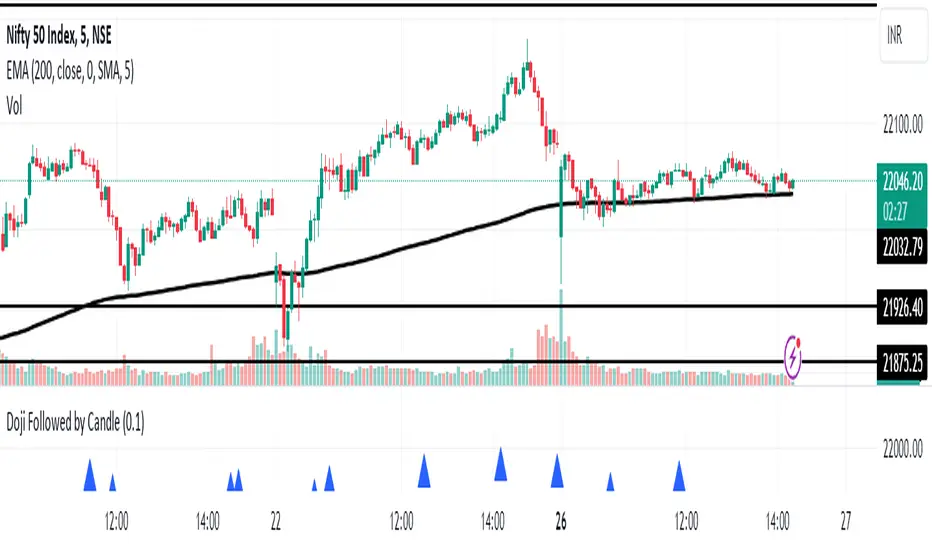
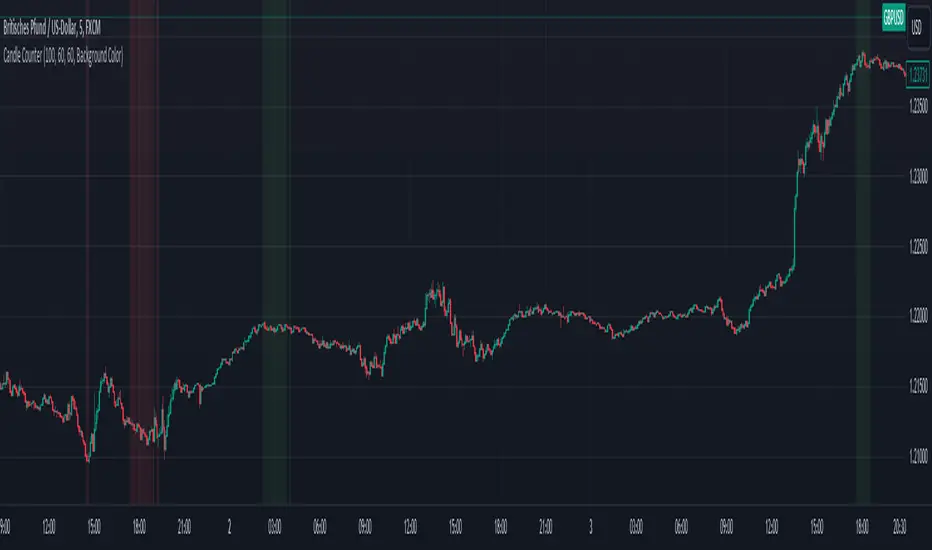
Green/Red Triangles: Appear on your chart, indicating confirmed bullish or bearish signals.
Background Color: The chart background will subtly turn lime green for "STRONGLY BULLISH" and red for "STRONGLY BEARISH" conditions.
On-Chart Status Table: A clear table displays the current signal status ("STRONGLY BULLISH/BEARISH," or "SMAs Mixed") for immediate feedback.
Set Up Alerts (Your Primary Screener Tool): This is the game-changer! Create custom alerts on TradingView based on the "Confirmed Bullish Trade" and "Confirmed Bearish Trade" conditions. Receive instant notifications (email, pop-up, mobile) for any stock in your watchlist that meets these stringent criteria. This allows you to scan the entire market effortlessly and act decisively.
Strategic Stop-Loss Placement: The Trader's Lifeline
Even the most robust signals can fail. Protecting your capital is paramount. For this trend-following strategy, your stop-loss should be placed where the underlying trend structure is broken.
For a "STRONGLY BULLISH" Trade: Place your stop-loss just below the most recent significant swing low (higher low). This is the last point where buyers stepped in to support the price. If price breaks below this, your bullish thesis is invalidated.
For a "STRONGLY BEARISH" Trade: Place your stop-loss just above the most recent significant swing high (lower high). If price breaks above this, your bearish thesis is invalidated.
Alternatively, consider placing your stop-loss just below the 20-period SMA (for bullish trades) or above the 20-period SMA (for bearish trades). A significant close beyond this intermediate-term average often indicates a critical shift in momentum. Always ensure your chosen stop-loss adheres to your pre-defined risk per trade (e.g., 1-2% of capital).
Disciplined Profit Booking: Maximizing Gains
Just as important as knowing when you're wrong is knowing when to take profits.
Trailing Stop-Loss: As your trade moves into profit, trail your stop-loss upwards (for longs) or downwards (for shorts). You can trail it using:
Previous Swing Lows/Highs: Move your stop to just below each new higher low (for longs) or just above each new lower high (for shorts).
A Moving Average (e.g., 10-period or 20-period SMA): If price closes below your chosen trailing SMA, exit. This allows you to ride the trend while protecting accumulated profits.
Target Levels: Identify potential resistance levels (for longs) or support levels (for shorts) using pivot points, previous highs/lows, or Fibonacci extensions. Consider taking partial profits at these levels and letting the rest run with a trailing stop.
Loss of Confluence: If the "STRONGLY BULLISH/BEARISH" condition ceases to be met (e.g., RSI crosses below 50, or volume drops significantly), this can be a signal to reduce or exit your position, even if your stop-loss hasn't been hit.
The "All SMAs Bullish/Bearish Screener Enhanced" is your comprehensive partner in navigating the markets. By combining robust trend identification with critical confirmation signals and disciplined risk management, you're equipped to make smarter, more confident trading decisions. Add it to your favorites and unlock a new level of precision in your trading journey!
#PineScript #TradingView #SMA #MovingAverage #TrendFollowing #StockScreener #TechnicalAnalysis #Bullish #Bearish #QQQ #Momentum #Volume #RSI #SPY #TradingStrategy #Enhanced #Signals #Analysis #DayTrading #SwingTrading
Penunjuk Pine Script®