Differential Price Counter for Bullish/Bearish BarsThis script can show the cumulative differential price of both bullish/bearish bars with the 0.1pip precision for the currencies having five decimal precision. However, can be useful for all markets.
Cari dalam skrip untuk "bear"

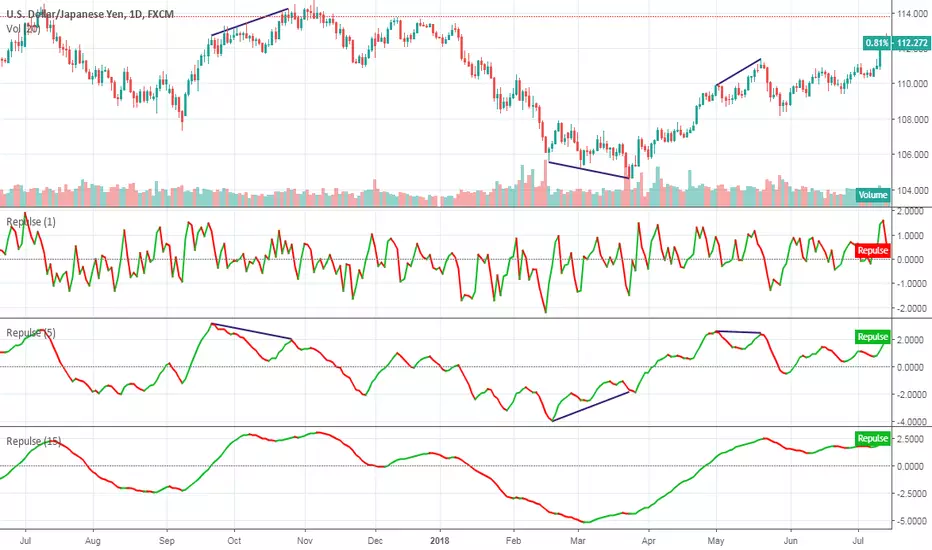
RepulseThis indicator was originally developed by Eric Lefort, a professional trader and author from France.
It gauges and displays the bullish or bearish pressure.
Like and follow for more open source indicators!
Happy Trading!
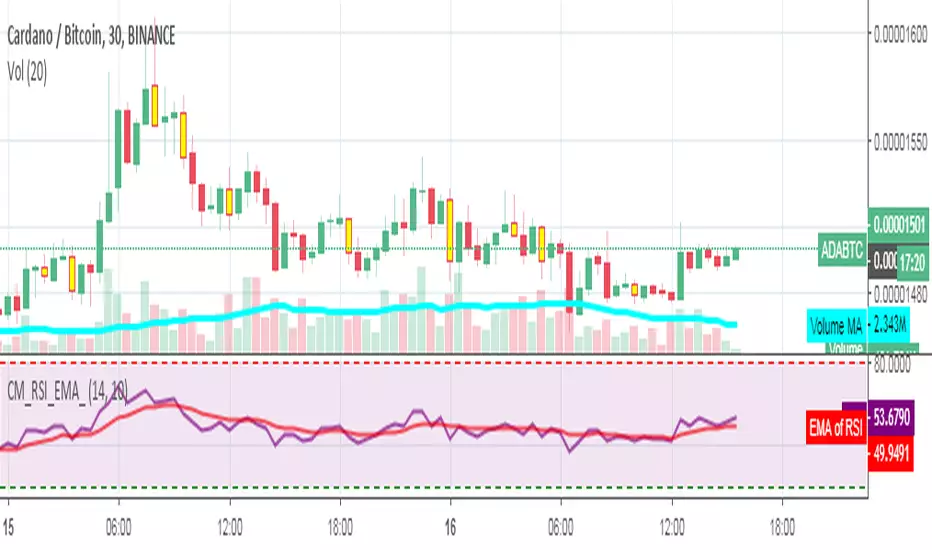
RSI_EMA & Bearish EngulfingThis is a RSI-RSI of EMA and bearish candlestick reversal pattern formed by two candlesticks. Following an uptrend, the first candlestick is a up candlestick which is followed by a down candlestick which has a long real body that engulfs or contains the real body of the prior bar. following an uptrend, if RSI and EMA line cross then Sell and for downtrend if RSI and EMA line cross then Buy.
CMYK VRMI◊ Introduction
This script indicates the relative movement of price x volume.
◊ Origin
Based on 'The Relative Momentum Index' by Roger Altman : February, 1993 issue of Technical Analysis of Stocks & Commodities magazine.
While RSI counts up and down days from close to close, the Relative Momentum Index counts up and down days from the close relative to a close x number of days ago.
This results in an RSI that is smoother. The input has been changed to the change of a smoothed close multiplied by a smoothed volume.
The polarity of VRMI indicates bearish/bullish movement.
◊ Adjustments
CMYK color theme applied.
◊ Usage
VRMI indicates the force the market moves with.
◊ Future Prospects
-
◊ ◊ ◊ ◊ ◊ ◊ ◊ ◊ ◊ ◊ ◊ ◊ ◊ ◊ ◊ ◊ ◊ ◊ ◊ ◊ ◊ ◊ ◊ ◊ ◊ ◊ ◊ ◊ ◊ ◊ ◊ ◊ ◊ ◊ ◊ ◊ ◊ ◊ ◊ ◊ ◊ ◊ ◊ ◊ ◊ ◊ ◊ ◊ ◊ ◊ ◊ ◊ ◊ ◊ ◊ ◊ ◊ ◊ ◊ ◊ ◊ ◊ ◊ ◊ ◊ ◊ ◊ ◊ ◊ ◊ ◊ ◊ ◊ ◊ ◊ ◊ ◊ ◊ ◊ ◊ ◊ ◊ ◊ ◊ ◊ ◊ ◊ ◊ ◊ ◊ ◊ ◊ ◊ ◊ ◊ ◊ ◊ ◊ ◊ ◊ ◊ ◊ ◊ ◊ ◊ ◊

CMYK VRMI RAYS ◊ Introduction
Introducing VRMI in this script, an RMI based on price movement and volume, to indicate bullish and bearish trends.
This script marks the background depending on RMI <> VRMI , VRMI polarity and large buy/sell sprees.
◊ Origin
Based on 'The Relative Momentum Index' by Roger Altman : February, 1993 issue of Technical Analysis of Stocks & Commodities magazine.
While RSI counts up and down days from close to close, the Relative Momentum Index counts up and down days from the close relative to a close x number of days ago.
This results in an RSI that is smoother.
In addition VRMI reacts quick, it is used to cut off latency from RMI, and it's polarity indicates the beginning and end of a trend.
Large buy sell sprees and detected in their proportion with an sma on the volume
◊ Adjustments
CMYK color theme applied.
◊ Usage
This indicator can be used to detect trends and mark reversals.
◊ Prospects
◊ ◊ ◊ ◊ ◊ ◊ ◊ ◊ ◊ ◊ ◊ ◊ ◊ ◊ ◊ ◊ ◊ ◊ ◊ ◊ ◊ ◊ ◊ ◊ ◊ ◊ ◊ ◊ ◊ ◊ ◊ ◊ ◊ ◊ ◊ ◊ ◊ ◊ ◊ ◊ ◊ ◊ ◊ ◊ ◊ ◊ ◊ ◊ ◊ ◊ ◊ ◊ ◊ ◊ ◊ ◊ ◊ ◊ ◊ ◊ ◊ ◊ ◊ ◊ ◊ ◊ ◊ ◊ ◊ ◊ ◊ ◊ ◊ ◊ ◊ ◊ ◊ ◊ ◊ ◊ ◊ ◊ ◊ ◊ ◊ ◊ ◊ ◊ ◊ ◊ ◊ ◊ ◊ ◊ ◊ ◊ ◊ ◊ ◊ ◊ ◊ ◊ ◊ ◊ ◊ ◊


Super Envolvente (Bullish y Bearish)Identificador de Super-envolventes (SE), se encarga de darle un color verde a la SE alzista (Bullish) verde y rojo a la bajista (Bearish).

Bearish Trailing stopIt is a trailing SL. Works very well. Good good very good. Looks like my description needs more, so here is more random text.


Bearish signal using Point of Control (POC) with PAC by guruThis indicator code helps traders identify potential sell opportunities using several important technical indicators:
Point of Control (POC) – This is the price level where the most volume was traded over the past several days.
Previous Day's Low – This shows the lowest price reached during the previous day.
PAC (Price Action Channel) EMA – These are two moving averages (one based on the low price and one based on the close price) that help determine if the price is trending within a certain range.
Volume SMA – This is a 3-day simple moving average (SMA) of volume, which helps filter out signals based on market activity.
What the Script Does:
Point of Control (POC):
The script looks at the last 50 days (configurable) and calculates which price level had the highest trading volume.
It then plots a red line on the chart at the POC level. This is important because it helps identify areas where there was strong market interest in the past.
Volume Moving Average:
The script calculates a 3-day SMA of volume, but it excludes the current day to avoid premature signals based on today’s trading.
The volume SMA is used to ensure there’s enough market activity (with a threshold set to 25 units) before triggering a sell signal.
Price Action Channel (PAC) EMA:
The PAC consists of two exponential moving averages (EMAs):
The PAC Low EMA: This is based on the low prices over the last 34 periods (configurable).
The PAC Close EMA: This is based on the closing prices over the last 34 periods.
These EMAs help determine if the price is trending above or below certain price levels.
Sell Signal Logic: The script checks three conditions before displaying a "Sell" signal:
Price Below POC and Previous Day’s Low:
The close price must be below both the Point of Control (POC) and the previous day's low.
Volume SMA Above 25:
The 3-day volume SMA must be greater than 25. This ensures the signal only triggers when there’s enough trading volume in the market.
Today’s Low is Above PAC EMAs:
Today's low price must be above both the PAC low EMA and the PAC close EMA. This prevents sell signals when prices are already significantly below the PAC, indicating possible exhaustion in the downtrend.
If all three conditions are met, the script will display a red "Sell" label on the chart, signaling a potential selling opportunity.
No Sell Signal if Price Reverses:
If the price crosses back above the POC or the previous day's low, the script will remove the sell signal and reset for a new opportunity.
Summary of Conditions:
For the script to display a "Sell" label:
The close price must be below the Point of Control (POC) and the previous day’s low.
The 3-day volume SMA (excluding today) must be greater than 25 units.
The low price of the current day must be above both the PAC low EMA and the PAC close EMA.
If these conditions are met, a red sell label appears on the chart as a potential signal for a short (sell) trade.

Fast EMA Stack >XBT<Multi-timeframe EMA indicator displaying 9/20 EMA bands across 5M, 15M, 1H, and 4H timeframes simultaneously on a single chart.
Quickly assess trend alignment across multiple timeframes without switching charts. A built-in signal table provides instant visual confirmation of bullish or bearish conditions on each timeframe.
Features:
Multi-Timeframe Bands — View EMA 9/20 bands for 5M, 15M, 1H, and 4H all at once
Crossover Labels — Bull/Bear labels appear directly on the chart at each EMA crossover point
Stack Filter — Only show crossover signals that align with your higher timeframe bias (e.g. if 1H is bullish, only show bull signals on lower timeframes)
Individual Label Controls — Toggle crossover labels on/off independently for each timeframe
Label Limit — Set maximum labels per timeframe to keep charts clean (default 5)
Signal Table — Dark-mode table showing BULL/BEAR status with colour-coded indicators
Fully Customisable — Adjust EMA lengths, line thickness, colours, and band transparency per timeframe
Toggle Timeframes — Show or hide individual timeframe bands
Alert Conditions — Pre-built alerts for bullish and bearish EMA crossovers on all four timeframes
How to Use:
Look for alignment across timeframes to confirm trend direction. When multiple timeframes show the same signal (all green or all red), you have stronger confluence. Crossover labels mark exact entry/exit points where momentum shifts.
Stack Filter:
Enable the Stack Filter to only see signals that match your higher timeframe bias. Select your bias timeframe (15M, 1H, or 4H), then:
When bias is bullish → only bull crossovers appear on lower timeframes
When bias is bearish → only bear crossovers appear on lower timeframes
The bias timeframe always shows both directions so you can see when trend changes
This helps filter out counter-trend noise and keeps you trading with the flow.
Green = Bullish (EMA 9 above EMA 20)
Red = Bearish (EMA 9 below EMA 20)

Trinity Trend Dashboard"Trinity Trend Dashboard with Trend Alerts & Custom Colors" indicator
### Trading Dashboard – Quick User Guide
**Purpose**
This indicator displays a compact status dashboard showing how the current price relates to several key levels:
- Previous day's VWAP
- Current (session) VWAP
- Previous day's High
- Previous day's Low
- Donchian Channel basis line (midpoint of highest high / lowest low over chosen period)
Each level shows whether price is **Above** (bullish) or **Below** (bearish), with colored backgrounds to make it instantly readable.
An **overall trend summary** combines all five signals into one clear status:
- **Strong Bullish** → all 5 signals are bullish
- **Strong Bearish** → all 5 signals are bearish
- **Mixed Trend** → anything in between
**How to Read the Dashboard**
- **Left column** = name of the level
- **Right column** = current price position ("Above" or "Below")
- **Green background** = price is above the level (bullish signal)
- **Red background** → price is below the level (bearish signal)
- **Bottom merged row** = overall trend verdict + large colored background
**Key Settings You Can Change**
- **Table Position** → top-right (default), top-left, bottom-left, bottom-right
- **Font Size** → tiny / small (default) / normal / large
- **Donchian Channel Period** → default 20 bars (classic value; adjust for faster/slower basis line)
- **Colors** (fully customizable):
- Left column text color (default: yellow)
- Bullish background (default: lime green)
- Bearish background (default: red)
- Mixed trend background (default: gray)
- Header background & text color
- **Alert toggles** → turn on/off notifications for:
- Trend changed → Strong Bullish
- Trend changed → Strong Bearish
- Trend changed → Mixed Trend
**Alerts**
Alerts fire only when the **overall trend status changes** (e.g. Mixed → Strong Bullish).
Recommended setup in TradingView:
1. Add the indicator to chart
2. Create alert → select this indicator
3. Condition = "Any alert() function call"
4. Frequency = "Once Per Bar Close" (cleanest for daily/lower-timeframe use)
5. Add your preferred notification (popup, email, webhook, etc.)
**Tips for Best Use**
- Works on any timeframe, but shines on intraday charts (5 min – 1 hour) when using daily previous levels.
- Previous-day levels update automatically at the start of each new trading day.
- On very low-liquidity symbols, VWAP may behave differently — test first.
- For scalping/day trading: watch when overall status flips to Strong Bullish/Bearish — often strong momentum confirmation.
- Customize colors so they stand out clearly against your chart background (e.g. darker green/red if chart is bright).
Enjoy cleaner, faster decision-making — all important levels in one glance!

channeller proChanneller Pro - Statistical Price Channel Detection
What This Script Does
Channeller Pro identifies and draws price channels using pivot points, linear regression, and quality filters. It detects bullish and bearish channels and draws support/resistance lines with quality metrics.
Originality & Methodology
This script combines:
Pivot Point Detection: Uses TradingView's ta.pivothigh() and ta.pivotlow() with configurable left/right lookback to identify swing highs and lows.
Linear Regression Analysis: Fits a least-squares regression line through detected pivot points to determine channel slope and intercept.
R² Quality Scoring: Calculates the coefficient of determination (R²) to measure regression fit quality. R² values closer to 1.0 indicate stronger linear alignment of pivots. Channels below the minimum R² threshold are filtered out.
Pattern Validation:
Bullish channels require higher lows (ascending pivot lows)
Bearish channels require lower highs (descending pivot highs)
This ensures channels align with trend structure
ADX Trend Filter: Uses Average Directional Index (ADX) to show channels only when trend strength exceeds a threshold, reducing false signals in choppy markets.
Volume Confirmation (optional): Filters channels based on volume exceeding a moving average threshold.
Dynamic Channel Width: Calculates channel width by finding the maximum deviation from the regression line within the pivot range, then draws parallel support/resistance lines.
Channel Invalidation Logic: Tracks bounces and pierces. Channels are invalidated after multiple pierces through support/resistance, ensuring only active channels are displayed.
How It Works
Detection Process:
Identifies pivot highs/lows using the specified lookback periods
Stores recent pivots in arrays (configurable max count)
When minimum pivot count is reached, calculates linear regression through pivot points
Validates the channel by checking:
R² score meets minimum threshold (default 0.7)
Slope direction matches trend (positive for bullish, negative for bearish)
Pattern structure (higher lows for bullish, lower highs for bearish)
ADX exceeds threshold (if enabled)
Volume confirmation (if enabled)
If valid, draws support/resistance lines parallel to the regression line
Continuously monitors for channel breaks and invalidates when pierced multiple times
Mathematical Foundation:
Linear regression uses least squares: y = slope × x + intercept
R² calculation: R² = 1 - (SS_res / SS_tot) where SS_res is residual sum of squares and SS_tot is total sum of squares
Channel width = maximum price deviation from regression line within pivot range
How to Use
Basic Setup:
Apply the indicator to your chart
Adjust "Pivot Lookback Left/Right" to control pivot sensitivity (default 10 bars each)
Set "Min Pivots for Channel" (default 3) - higher values require more confirmation but reduce false signals
Configure "Min R² Score" (default 0.7) - higher values show only the best-fitting channels
Filter Configuration:
ADX Filter: Enable to show channels only during trending conditions (ADX > threshold)
Volume Filter: Enable to require volume confirmation for channel formation
HL/LH Pattern: Keep enabled to ensure channels follow proper trend structure
Trading Applications:
Support/Resistance: Use channel boundaries as dynamic support/resistance levels
Trend Following: Trade bounces off channel boundaries in the direction of the trend
Breakout Trading: Monitor for channel breaks as potential trend reversal signals
Channel Quality: Higher R² scores (displayed in labels) indicate stronger, more reliable channels
Display Options:
Toggle channel fills, mid-lines, pivot markers, and labels
Adjust projection length to extend channels into the future
Customize colors for bullish/bearish channels
Alerts:
The script includes alerts for:
New channel formation
Channel break/invalidation
New pivot detection
Important Notes
Channels are statistical constructs based on historical pivot points and do not guarantee future price action
R² scores indicate fit quality, not trading performance
Channels may be invalidated as market conditions change
Past channel performance does not predict future results
Always use proper risk management and combine with other analysis methods
Technical Details
Built-in Pine Script v6
Uses arrays for pivot storage and management
Implements custom linear regression calculation
Real-time channel validation and invalidation
Configurable quality thresholds and filters

Strategy2.2.1🇬🇧 Iceberg Strategy — Description (EN)
Iceberg Strategy is a multi-timeframe trend-following and liquidity-based trading indicator designed for crypto markets.
It combines H4 trend structure, MACD momentum, volume analysis, correlation filtering, and retest logic to identify high-probability entries aligned with institutional activity.
The indicator focuses on filtering out low-quality signals by using 24H USD volume, BTC correlation, and buyer/seller dominance (Volume Fight), while providing clear risk management visualization with automatic Stop Loss and Take Profit levels.
🔍 Core Logic
H4 MACD Trend Detection
Identifies bullish and bearish market regimes
Uses both standard and fast MACD to detect trend continuation and gray (transition) zones
Gray Zone Trend Re-entry
Detects pullbacks inside an active trend
Generates continuation entries when momentum resumes
Volume Fight (Liquidity Analysis)
Compares bullish vs bearish volume using VWMA
Detects accumulation and distribution zones
Optional background highlighting
24H USD Volume Filter
Ensures trading only high-liquidity assets
Filters out low-volume and manipulated markets
Correlation Filter
Filters signals when correlation with BTC (or selected symbol) is too high
Allows excluding specific symbols from correlation checks
H1 Retest Entries
Detects retests of key price levels after breakout
Confirms entries only after successful retest
📈 Signals & Visuals
BUY / SELL labels for main trend entries
Triangle signals for retest entries
Colored H4 candles
Green — bullish trend
Red — bearish trend
Gray — transition / pullback zone
Volume Fight background zones (optional)
Information table with:
H4 Trend direction
Fast MACD value
Correlation value
24H USD volume
🛡 Risk Management
Automatic Stop Loss
Based on ATR with configurable multiplier
Multiple Take Profit levels
RR-based targets (TP1–TP5)
SL and TP lines can be enabled or disabled from settings
⚙️ Fully Configurable
Enable / disable:
Correlation filter
Volume filter
Volume Fight background
Stop Loss / Take Profit lines
Adjustable parameters for:
ATR
Correlation
Volume thresholds
Retest logic
⚠️ This indicator does not repaint signals and is intended for educational and analytical purposes only. Always use proper risk management.

SA Range Rank WITH GRADE A SET UP 15 MIN NQI APPRECIATE YOUR SUPPORT PLEASE MESSAGE ME FOR ACCESS TO DIRECT AND POWERFUL SIGNALS. MORE TO COME !
NOTICE DEVELOPER NOTE: chatgpt.com
15 MINUTE — PREPARE / POSITION MODE
Developer Note: Bias & Position Framing
This daily view is preparatory, not executable.
The purpose of the Daily timeframe is to define directional bias, not entries. It helps frame which side of the market deserves attention and which activity should be ignored.
The goal here is context, not action.
---
Purpose on Daily
The Daily timeframe is used to:
· Define directional bias for the week
· Prepare position-building zones
· Identify environments where participation is unnecessary or elevated-risk
· Reduce overtrading by narrowing focus
Daily charts answer one question only:
“If I participate this week, which side makes sense?”
---
What Matters Most (Public View)
SA Range Indicator (RI): → Is the market transitioning or trending? → Is energy building, releasing, or rotating?
SA ZoneEngine (visual context only): → Are daily moves aligned with higher-timeframe structure? → Is price operating with or against dominant bias?
These visuals explain environment, not decisions.
---
How to Interpret Public Daily Posts
· Daily is not timing
· Daily is not execution
· Daily is not a signal
Daily charts prepare the trader mentally and structurally by clarifying:
· what deserves patience
· what deserves caution
· what deserves no attention at all
---
Messaging Line
“Daily charts prepare the trade — they don’t execute it.”
---
SEO Intent
daily equity bias, position preparation, market structure analysis
---
For Those Who Find Value
If these daily posts help you see the market more clearly:
· Follow, boost, and share my scripts, Ideas, and MINDS posts
· Feel free to message me directly with questions or build requests
· Constructive feedback and collaboration are always welcome
For traders who want to go deeper, optional memberships may include:
· Additional signal access
· Early previews
· Occasional free tools and upgrades
Membership & Signals trianchor.gumroad.com
---
---
⏱ 15-MIN — PREPARE / POSITION MODE
Developer Note: Setup Formation Phase
The 15-minute timeframe is where setups begin to form, not where they are acted on.
This view exists to separate developing structure from noise.
---
Purpose on 15-Minute
The 15-minute timeframe is used to:
· Spot trap-prone conditions
· Identify developing structure
· Observe compression, rotation, or early expansion
· Prepare for execution — without acting
This timeframe answers a different question:
“Is something forming — or is this noise?”
---
What Matters Most (Public View)
SA Range Indicator (RI): → Compression → expansion transitions → Energy buildup vs premature release
SA CloudRegimes (visual only): → Whether price behavior reflects continuation, pullback, or contraction → Whether movement is controlled or impulsive
These visuals describe behavior, not entries.
---
How to Interpret Public 15-Minute Posts
· 15m is setup formation
· 15m is environmental awareness
· 15m is not execution
Most errors occur when traders act before structure has finished forming.
This timeframe exists to slow that impulse down.
---
Messaging Line
“Preparation happens before the move — not during it.”
---
---
For Those Who Find Value
If these posts help you better recognize developing structure:
· Follow, boost, and share my scripts, Ideas, and MINDS posts
· Feel free to message me directly with questions or build requests
· Constructive feedback and collaboration are always welcome
For traders who want to go deeper, optional memberships may include:
· Additional signal access
· Early previews
· Occasional free tools and upgrades
Membership & Signals trianchor.gumroad.com
15 Minute (15m) — Tactical Entry Alignment / “Permission + Timing”
Goal: Convert higher-timeframe permission into tradable timing.
How to use:
· Trade the first clean reclaim after a pullback.
· Avoid taking a reclaim if price is already extended far beyond the wake edge (late reclaim).
Best conditions:
· Works extremely well when:
o 1H agrees
o session structure is active (open/close windows)
o reclaim occurs near VWAP or a key level you already respect
Settings:
· dispMult 0.75–1.05
· reclaimWindow 6–14
· cooldown 3–6
15-MINUTE — Intraday Structure & Session Logic
Range Indicator (RI)
· Session compression → impulse likely
· Expansion → follow, don’t fade
Use: Defines session behavior.
---
ZoneEngine (Structure)
· Filters session traps
· Explains failed breakouts
Use: Keeps you aligned with real participation.
---
Cloud / Reclaim (Behavior)
· Identifies pullback vs continuation
· Reclaim confirms acceptance
Use: Contextual confirmation.
---
Stop-Hunt Proxy
· Session liquidity sweeps
· Common near opens and transitions
Use: Stop-hunt + compression = likely session impulse.Execution Confirmation (Chart TF)
VWAP location
SMA(3) vs SMA(8)
Candle color (green/red)
WAIT State (NO CONFIRMED TRADE)
When the market is in a specific “trap regime,” the script blocks trades completely.
Grade-A setups (the only ones you trade)
✅ Grade-A Long = B+ Confirmed
A B+ print is your “Grade-A Long permission + execution alignment.”
B+ only fires when ALL are true:
Bull Permission is ON (macro score meets threshold)
WAIT is OFF
Candle is green (close > open)
Price is ABOVE VWAP
SMA(3) > SMA(8)
Translation:
Liquidity + rates are supportive, the market is positioned to move up, and price is already trading like institutions are pressing.
✅ Grade-A Short = B− Confirmed
A B− print is your “Grade-A Short permission + execution alignment.”
B− only fires when ALL are true:
Bear Permission is ON
WAIT is OFF
Candle is red (close < open)
Price is BELOW VWAP
SMA(3) < SMA(8)
Translation:
Liquidity + rates are pressuring, volatility is supportive of downside, and price is already trading under VWAP with downside momentum.
🟫 WAIT State = NO CONFIRMED TRADE
When the background turns gray (WAIT), you do nothing.
WAIT is the regime where:
downside breaks often fail
signals become unreliable
stop-hunts and reversals dominate
Your rule is simple:
WAIT = stand down until it clears.
This prevents “getting chopped to death” in the exact environment you identified as misdirection.
Step-by-step: how to use it on TradingView
Step 1 — Put it on the right instruments
Best use:
CME_MINI:NQ1! (primary)
CME_MINI:ES1!
CBOT_MINI:YM1!
CME_MINI:RTY1!
Works on equities too (SPY, QQQ, NVDA, AAPL), but it’s tuned for futures execution.
Step 2 — Use the right timeframes (this matters)
Best “Grade-A” workflow:
Chart TF (execution): 5m or 15m
Confirm TF (macro permission): 60m or 240m
Settings:
Confirm TF (intraday) = 60 for aggressive /NQ
Confirm TF = 240 for cleaner, fewer signals
If you want fewer but stronger signals: 240.
Step 3 — Confirm the data sources are valid
In Inputs:
Vol: CBOE:VIX
Dollar: TVC:DXY
Rates: CBOT:ZN1!
If that doesn’t work on your feed, change to TVC:US10Y
If these are wrong, the macro layer goes blind and signals degrade.
Step 4 — Interpret the background (your “regime map”)
Gray background: WAIT (do nothing)
Light green background: bull permission environment
Light red background: bear permission environment
Important:
Background alone is not a trade.
Only B+ / B− is a trade.
Step 5 — Execute ONLY on B+ / B− (Grade-A rule)
You do not anticipate.
You do not guess.
You do not trade “almost.”
You enter only when the indicator prints:
B+ for long
B− for short
Because those prints already include:
macro permission
VWAP location
SMA momentum alignment
candle confirmation
and WAIT suppression
Trade management (simple + effective)
For B+ (Long)
Entry: on the B+ bar close or next candle pullback that stays above VWAP
Invalidation: close back below VWAP or SMA3 falls under SMA8
Best targets (futures):
Target 1: recent swing high / session high
Target 2: VWAP band extension / next liquidity level
Hard stop: under last swing low (or your fixed points)
For B− (Short)
Entry: on the B− bar close or next candle retest that stays below VWAP
Invalidation: close back above VWAP or SMA3 crosses above SMA8
Best targets:
Target 1: recent swing low / session low
Target 2: next liquidity shelf / range low
Your “Grade-A Checklist” (print this mentally)
Before taking ANY trade:
Is WAIT OFF?
Did we get a B+ or B− print?
Is price on the correct side of VWAP?
Is SMA3 vs SMA8 aligned?
Is the candle color correct (green for B+, red for B−)?
If yes → take it.
If not → do nothing.
Why this works (the edge)
This indicator forces you to trade only when:
macro conditions allow follow-through
price action confirms institutional control (VWAP)
momentum confirms continuation (3/8 SMA)
and it blocks trades during the mischief regime (WAIT)
That combination is exactly what stops:
revenge trades
chop entries
shorting into bear traps
longing into liquidity tightening
Recommended default settings (Grade-A clean)
For /NQ:
Chart: 5m
Confirm TF: 60m
onlyOnFlip: true (less noise)
Keep VIX/DXY/ZN defaults
For “super clean”:
Chart: 15m
Confirm TF: 240m

Gold Master Analysis 2026The Gold Master Analysis 2026 is a high-performance technical indicator specifically optimized for high-volatility assets like XAUUSD. It combines Market Structure analysis with Momentum tracking to give traders a "clean" bird's-eye view of the current trend without cluttering the price action.
█ KEY FEATURES
Dynamic Market Baseline: Uses a 200-period EMA to define the primary trend. The line changes color dynamically based on whether price is in a "Bullish" or "Bearish" regime.
Visual Atmosphere: The chart background subtly tints green or red to give the trader instant psychological confirmation of the current market bias.
Professional Dashboard: A sleek, non-intrusive data table in the top-right corner providing real-time trend status, momentum strength, and precise RSI values.
Anti-Clutter Design: Unlike "spaghetti" indicators, this script uses a minimalist approach to keep your focus on the candles.
█ HOW IT WORKS
Trend Identification: As long as price stays above the Market Baseline, the trend is considered bullish. If it falls below, the script signals a bearish shift.
Momentum Exhaustion: The dashboard tracks the Relative Strength Index (RSI). If the RSI exceeds 70, the dashboard labels the market as "OVERBOUGHT," suggesting a potential pullback is coming.
Real-Time Calculations: The script uses logic to ensure the dashboard only updates on the most recent bar, preventing chart lag and maintaining high performance.

Fractal - VA (Dynamic Wicks)This indicator, which we’ve developed as the Frectal - VA (Multi-Timeframe Visual Analytics), is designed for traders who utilize multi-timeframe analysis but want to keep their main chart clean of overlapping candles.
It functions as a Projected Dashboard, pulling price action from a higher timeframe (HTF) and rendering it as a set of dynamic, solid objects in the right-hand margin of your chart.
Core Philosophy
The "Frectal - VA" is built on the principle of Nested Structure. In professional trading, the "Value Area" or the "Fractal" of a higher timeframe often dictates the trend of the lower timeframe. By projecting these candles into the future (the right side of the chart), you can monitor HTF trend shifts, volatility, and candle closes without the HTF candles obscuring your current "live" price action.
Key Components
Decoupled Visualization: Unlike standard MTF indicators that overlay large boxes behind your current bars, this indicator creates a side-by-side comparison in the chart's whitespace.
Real-Time Data Streaming: It doesn't just show historical candles; the "lead" candle in the dashboard updates with every tick of the current price, showing you exactly how the higher timeframe candle is forming.
Dynamic Color Sync: The body, border, and wick of each projected candle are linked. If a 1-hour candle flips from bullish to bearish on a 5-minute chart, the entire dashboard object changes color instantly.
Customizable Offset: You control the "Drop" (Vertical Offset) and the "Margin" (Horizontal Offset). This allows you to tuck the indicator into a corner of your screen as a heads-up display (HUD).
Strategic Use Cases
Trend Confirmation: If you are trading a 1-minute "scalp" but the 15-minute dashboard shows a solid, large-bodied bearish candle, you are alerted to trade with the HTF momentum.
Volatility Monitoring: By observing the size of the wicks in the dashboard, you can see if the higher timeframe is experiencing "rejection" at certain levels, even if your local timeframe looks like a steady trend.
Visual Backtesting: Because it maintains a queue of the last
X
candles, you can see the immediate history of the HTF structure (e.g., a "Morning Star" pattern or "Engulfing" candles) at a glance.
Technical Specifications
Pine Script Version: v6 (latest standard).
Drawing Engine: Uses box and line arrays for high-performance rendering that doesn't lag the UI.
Memory Management: Automatically deletes old objects to stay within TradingView’s script limits, ensuring stability during long trading sessions.

Ratnesh RSI TF Table (4 Color Zones)//@version=5
indicator("RAM RSI TF Table (4 Color Zones)", overlay=true)
// === Input ===
rsiPeriod = input.int(14, "RSI Period")
strongBull = input.float(60, "Strong Bullish Above")
mildBull = input.float(50, "Light Bullish Above")
weakBear = input.float(40, "Light Bearish Below")
strongBear = input.float(40, "Strong Bearish Below")
// === RSI Function ===
getRSI(tf) =>
request.security(syminfo.tickerid, tf, ta.rsi(close, rsiPeriod))
// === RSI Values ===
rsi1m = getRSI("1")
rsi5m = getRSI("5")
rsi15m = getRSI("15")
rsi30m = getRSI("30")
rsi1h = getRSI("60")
rsi4h = getRSI("240")
rsi1d = getRSI("D")
rsi1w = getRSI("W")
// === Background Color Function (4 Levels) ===
getBG(val) =>
val > 60 ? color.green : val >= 50 and val <= 60 ? color.lime : val >= 40 and val < 50 ? color.new(color.red, 60) :val < 40 ? color.red : na
// === Table Create ===
var table rsiTable = table.new(position.bottom_right, 2, 9, border_width=1)
// === Update Table ===
if barstate.islast
// Header
//table.cell(rsiTable, 0, 0, "TF", bgcolor=color.black, text_color=color.white, text_size=size.normal)
//table.cell(rsiTable, 1, 0, "RSI", bgcolor=color.black, text_color=color.white, text_size=size.normal)
// Rows
//table.cell(rsiTable, 0, 1, "1m", bgcolor=getBG(rsi1m))
//table.cell(rsiTable, 1, 1, str.tostring(rsi1m, "#.0"), bgcolor=getBG(rsi1m))
table.cell(rsiTable, 0, 2, "5m", bgcolor=getBG(rsi5m))
table.cell(rsiTable, 1, 2, str.tostring(rsi5m, "#.0"), bgcolor=getBG(rsi5m))
table.cell(rsiTable, 0, 3, "15m", bgcolor=getBG(rsi15m))
table.cell(rsiTable, 1, 3, str.tostring(rsi15m, "#.0"), bgcolor=getBG(rsi15m))
table.cell(rsiTable, 0, 4, "30m", bgcolor=getBG(rsi30m))
table.cell(rsiTable, 1, 4, str.tostring(rsi30m, "#.0"), bgcolor=getBG(rsi30m))
table.cell(rsiTable, 0, 5, "1h", bgcolor=getBG(rsi1h))
table.cell(rsiTable, 1, 5, str.tostring(rsi1h, "#.0"), bgcolor=getBG(rsi1h))
table.cell(rsiTable, 0, 6, "4h", bgcolor=getBG(rsi4h))
table.cell(rsiTable, 1, 6, str.tostring(rsi4h, "#.0"), bgcolor=getBG(rsi4h))
table.cell(rsiTable, 0, 7, "1D", bgcolor=getBG(rsi1d))
table.cell(rsiTable, 1, 7, str.tostring(rsi1d, "#.0"), bgcolor=getBG(rsi1d))
table.cell(rsiTable, 0, 8, "1W", bgcolor=getBG(rsi1w))
table.cell(rsiTable, 1, 8, str.tostring(rsi1w, "#.0"), bgcolor=getBG(rsi1w))

RSI + Fibonacci Levels📊 RSI + Dynamic Fibonacci Retracement Levels
An enhanced version of the classic RSI indicator combined with automatic Fibonacci retracement levels. This indicator dynamically calculates RSI's support and resistance zones, helping you identify precise entry and exit points with greater accuracy.
━━━━━━━━━━━━━━━━━━━━━━━━━━━━━━━━━━━━━━━━━━━━━━━
🎯 HOW TO USE
For optimal results, we highly recommend using this indicator in combination with EMA 200 on your main chart.
▸ LONG Setup:
• Price must be ABOVE EMA 200 (confirmed uptrend)
• Wait for RSI to pull back to Fib 0.382 or 0.5 level
• Enter when RSI shows reversal signs from these levels
▸ SHORT Setup:
• Price must be BELOW EMA 200 (confirmed downtrend)
• Wait for RSI to rally into Fib 0.618 or 0.786 level
• Enter when RSI shows rejection from these levels
━━━━━━━━━━━━━━━━━━━━━━━━━━━━━━━━━━━━━━━━━━━━━━━
📐 FIBONACCI LEVELS EXPLAINED
The indicator automatically plots Fibonacci levels based on RSI's highest and lowest values within the lookback period:
0 → Strong support (oversold zone)
0.236 → Minor support level
0.382 → Key support (Golden Pocket start)
0.5 → Equilibrium / Balance point
0.618 → Key resistance (Golden Ratio)
0.786 → Strong resistance level
1 → Strong resistance (overbought zone)
💡 Pro Tip: The Golden Pocket (0.382 - 0.618 range) is where the strongest reactions typically occur.
━━━━━━━━━━━━━━━━━━━━━━━━━━━━━━━━━━━━━━━━━━━━━━━
⚙️ SETTINGS
RSI Settings:
• RSI Length: Period for RSI calculation (default: 14)
• Source: Price source for calculation
• Calculate Divergence: Enable bullish/bearish divergence detection
Fibonacci Settings:
• Show Fibonacci Levels: Toggle Fib lines on/off
• Lookback Period: Bars to look back for High/Low (default: 50)
• Show Labels: Display level labels on the right side
• Label Size: Tiny / Small / Normal
• Custom colors for each Fibonacci level
Smoothing:
• Optional MA overlay (SMA, EMA, Bollinger Bands, etc.)
━━━━━━━━━━━━━━━━━━━━━━━━━━━━━━━━━━━━━━━━━━━━━━━
📈 RECOMMENDED STRATEGY: EMA 200 + RSI Fibonacci
Step-by-step setup:
1️⃣ Add EMA 200 to your main price chart
2️⃣ Add this indicator to a separate pane
3️⃣ Identify trend direction using EMA 200
4️⃣ Look for entries at RSI Fibonacci levels
🟢 In Uptrend (Price > EMA 200):
Look for LONG opportunities when RSI pulls back to 0.382 or 0.5 level.
• Entry: RSI bounces from Fib support
• Stop Loss: Below recent swing low
• Take Profit: Previous high or 1:2 Risk/Reward
🔴 In Downtrend (Price < EMA 200):
Look for SHORT opportunities when RSI rallies to 0.618 or 0.786 level.
• Entry: RSI rejects from Fib resistance
• Stop Loss: Above recent swing high
• Take Profit: Previous low or 1:2 Risk/Reward
━━━━━━━━━━━━━━━━━━━━━━━━━━━━━━━━━━━━━━━━━━━━━━━
⚠️ DISCLAIMER
This indicator is a tool to assist your analysis, not a standalone trading system. Always use proper risk management and confirm signals with price action. Past performance does not guarantee future results. Trade responsibly.
━━━━━━━━━━━━━━━━━━━━━━━━━━━━━━━━━━━━━━━━━━━━━━━
📌 FEATURES
✓ Dynamic Fibonacci levels on RSI
✓ Auto-updating labels with exact values
✓ Built-in divergence detection
✓ Multiple smoothing MA options
✓ Fully customizable colors and settings
✓ Clean, professional visualization
If you find this indicator useful, please leave a like and follow for more trading tools! 🚀
━━━━━━━━━━━━━━━━━━━━━━━━━━━━━━━━━━━━━━━━━━━━━━━

Markov 4-Bar with Option suggestion Markov 4 Bar Probability Study — Smarter Pattern Forecasting
The Markov 4 Bar Probability Study gives traders a data driven edge by analyzing the most recent four candles and comparing them to hundreds of historical matches. Instead of guessing what comes next, the study shows how similar patterns behaved in the past—revealing the probability of an up move, down move, average return, and how often the next bar produced a strong push.
A customizable Strong Threshold (%) lets you define what counts as a “strong” move. Lower values capture subtle momentum shifts, while higher values isolate only the most meaningful expansions, and this same strength read is used to suggest a directional options spread (for example, favoring a bullish credit spread when the pattern shows a strong upside edge, or a bearish one when downside odds dominate).
This tool is fast, visual, and built for real time decision making. If you want a clean statistical read on what usually follows your current 4 bar pattern—plus a suggested options spread aligned with that edge—this study delivers it with clarity and precision.

Multi-Session Volume Profile [MarkitTick]💡 This comprehensive Multi-Session Volume Profile indicator offers a sophisticated, array-based approach to Auction Market Theory. By simultaneously processing Daily, Weekly, Monthly, and Custom Session profiles, it empowers traders to visualize the migration of value across multiple timeframes without the performance overhead of standard heavy profile scripts. It is designed to identify key liquidity nodes, support/resistance zones defined by volume, and the directional bias of the market through Point of Control (POC) shifts.
✨ Originality and Utility
● Multi-Dimensional Value Analysis
Unlike standard volume profiles that often restrict users to a single timeframe or require multiple instances of an indicator, this script consolidates four distinct profile calculations into a single, efficient tool. It leverages Pine Script® arrays and custom types (`VPSlot`, `VolumeProfile`) to dynamically calculate volume distribution, ensuring minimal lag while maintaining high data granularity.
● Dynamic POC Shift Tracking
A standout feature of this utility is the "Shift Analysis." The indicator does not merely plot the current Point of Control; it calculates the delta between the current session's POC and the previous session's POC. This provides immediate visual feedback on "Value Migration"—whether the market is accepting higher prices (Bullish Shift) or lower prices (Bearish Shift).
● Granular Control via Custom Types
The script utilizes a custom quantitative structure (`type VolumeProfile`) to manage raw volume, highs, lows, and volatility slots independently for each timeframe. This allows for precise "row" calculations, ensuring that the volume distribution accurately reflects price action within the specific session, rather than broad approximations.
🔬 Methodology and Concepts
● Array-Based Bucketing
The core engine relies on a "Row Size" input to divide the session's price range into horizontal buckets (slots). As new price bars form, the script distributes the bar's volume across these slots. If a bar spans multiple slots, volume is distributed proportionally; if a bar is contained within a single slot, the total volume accumulates there. This mimics a true TPO (Time Price Opportunity) calculation using volume as the weight.
● Statistical Value Area Calculation
The Value Area (VA) is determined using a standard deviation proxy. The script identifies the POC (the slot with the highest accumulated volume) and then iteratively adds the next highest volume slots above or below the POC until the total accumulated volume reaches the user-defined percentage (default 70%).
● Session Logic and Reset
The indicator employs state-logic variables (`isNewDay`, `isNewWeek`, `isNewMonth`) to detect session boundaries. Upon a boundary cross, the `reset()` method clears the arrays and initializes a new profile, while the `draw()` method finalizes the visualization of the completed session. This ensures that the lines on the chart always represent the developing or completed structure of the specific time period.
🎨 Visual Guide
The indicator renders up to four distinct profiles, each color-coded for rapid identification.
● Daily Profile (Default: Yellow)
Solid Yellow Line: Represents the Daily POC (Point of Control)—the price level with the most volume traded today.
Dashed/Dotted Yellow Lines: Represent the Value Area High (VAH) and Value Area Low (VAL).
Yellow Background Box: Highlights the 70% Value Area, showing where the bulk of the day's trading occurred.
● Weekly Profile (Default: Blue)
Solid Blue Line: The Weekly POC. Use this to gauge the medium-term trend direction.
Blue Background: Encapsulates the weekly value area. A breakout from this zone often signals a significant trend continuation.
● Monthly Profile (Default: Purple)
Solid Purple Line: The Monthly POC. This is a high-timeframe magnet level, often acting as major support or resistance.
Purple Background: Shows the macro acceptance zone for the asset.
● Custom Session Profile (Default: Cyan)
Solid Cyan Line: Tracks the POC for a specific time window (e.g., 09:30-16:00). Ideal for isolating RTH (Regular Trading Hours) from electronic sessions.
● Labels and Shift Arrows
Right-Side Labels: Display the exact price of the POC for each active profile.
Shift Indicators (▲ / ▼): Located inside the label. A "▲" indicates the current POC is higher than the previous session's POC (Value Migration Up), while "▼" indicates the opposite.
📖 How to Use
● Trend Confirmation via Value Migration
Observe the Shift Arrows in the labels. If the Daily and Weekly profiles both show "▲" (Up Shift), it confirms that value is migrating higher, suggesting a healthy uptrend. Do not short the market when value is migrating up unless price breaks below the VAL.
● Mean Reversion Trades
When price extends far away from the POC but fails to establish value (volume) at those new levels, it often reverts back to the POC. Use the POC lines as profit targets for mean reversion strategies.
● Breakout Validation
A breakout is considered valid if price closes outside the Value Area (Background Box) and volume begins to build at the new levels. If price spikes out of the VAH but quickly returns inside the box, it is a "Failed Auction," and a rotation to the VAL is probable.
● Confluence Zones
Look for price levels where the Daily POC and Weekly VAL/VAH overlap. These "clusters" of volume act as reinforced support or resistance levels.
⚙️ Inputs and Settings
● General Settings
Row Size: Determines the resolution of the profile. Higher numbers (e.g., 100) give smoother, more precise profiles but use more resources. Lower numbers (e.g., 24) are blockier but faster.
Value Area %: The percentage of total volume to include in the VA. Standard is 70.0.
Show POC Shift Analysis: Toggles the display of the ▲/▼ drift comparison.
● Profile Toggles (Daily, Weekly, Monthly, Session)
Each section has individual toggles for Show Profile , Show Value Area , and Show Background .
Start of Week Day: Allows you to define when the weekly profile resets (e.g., Sunday or Monday).
● Alert Settings
Approach Distance (Ticks): Defines how close price must get to a POC/VAH/VAL level to trigger an "Approaching" alert.
Enable Alerts: Master switch to turn on internal alert condition checks.
🔍 Deconstruction of the Underlying Scientific and Academic Framework
● Auction Market Theory (AMT)
The script is grounded in Auction Market Theory, which posits that the market's primary purpose is to facilitate trade. Price advertises opportunity, and Volume records the acceptance of that opportunity. The "Value Area" represents the fair value established by buyers and sellers, while the POC represents the price of maximum consensus.
● Gaussian Distribution Application
The calculation of the Value Area at 70% is derived from the statistical properties of a Normal (Gaussian) Distribution, where approximately 68.2% of data points typically fall within one standard deviation of the mean. In this script, the POC acts as the mode (peak frequency), and the Value Area represents that first standard deviation of transactional volume.
● Volume-Price Integration
By integrating volume into price buckets (`VPSlot`), the indicator transforms two-dimensional time/price data into three-dimensional data (Time, Price, Volume). This reveals the "texture" of the market structure, distinguishing between high-volume nodes (strong acceptance) and low-volume nodes (rejection or emotional trading).
⚠️ Disclaimer
All provided scripts and indicators are strictly for educational exploration and must not be interpreted as financial advice or a recommendation to execute trades. I expressly disclaim all liability for any financial losses or damages that may result, directly or indirectly, from the reliance on or application of these tools. Market participation carries inherent risk where past performance never guarantees future returns, leaving all investment decisions and due diligence solely at your own discretion.

Piv X ProPiv X Pro - Advanced Pivot Detection with Multi-Timeframe Confluence Analysis
Overview
Piv X Pro identifies pivot highs and lows using a confluence scoring system. It combines pivot detection, volume-weighted analysis, Williams %R divergence, and multi-timeframe confirmation to highlight higher-probability pivot zones.
What Makes This Script Original
This script combines several components into a single workflow:
Dynamic pivot strength calculation based on ATR
Confluence scoring (10+ factors) to rank pivot quality
Multi-timeframe VWAP analysis (bottom/top extremes plus period-based VWAPs)
Williams %R divergence detection with anchored VWAPs
Market structure shift (CHoCH) identification
Real-time and confirmation modes for different trading styles
How It Works
Pivot Detection:
Uses ATR-based dynamic pivot strength (adjusts to volatility)
Filters pivots by significance (distance from recent averages)
Optional volume confirmation
Real-time mode for immediate detection or confirmation mode for verified pivots
Confluence Scoring System:
Each pivot receives a score (0-100+) based on:
Volume spikes (15 points)
Higher timeframe trend alignment (20 points)
RSI oversold/overbought conditions (25 points)
Price exhaustion signals (10 points)
RSI divergence (15 points)
Swing failure patterns (15 points)
Liquidity sweeps (10 points)
Candle reversal confirmation (10 points)
Key level alignment (10 points)
Fair value gap fills (10 points)
Session weighting (10 points)
Multi-timeframe pivot confluence (15 points)
Major Pivot Thresholds:
Real-time mode: 60+ confluence score
Confirmation mode: 80+ confluence score
Golden zones: 90+ score (highlighted differently)
VWAP Analysis:
Bottom/Top VWAPs: Anchored to absolute extremes within a lookback period
Period VWAPs: Weekly, Monthly, Yearly, plus 4D, 9D, 4H, 8H
Previous period VWAPs: Shows last period's VWAP for reference
Williams Divergence VWAPs: Anchored VWAPs triggered by bullish/bearish divergences
Market Structure:
Identifies Market Structure Shifts (CHoCH) when pivot sequences break
Draws structure lines connecting major pivots
Visual zones around major pivot levels
How to Use
Setup:
Apply to any timeframe (optimized for 1min, 5min, 15min, 1H)
Adjust pivot detection sensitivity via "ATR Pivot Strength Multiplier"
Choose Real-Time Mode (immediate) or Confirmation Mode (verified pivots)
Reading the Signals:
Major Pivot Low (PL): Green zones with confluence score
Major Pivot High (PH): Purple zones with confluence score
Golden Zones: Yellow highlights (90+ score)
CHoCH: Blue dashed lines marking structure breaks
Williams Divergence: Triangles + anchored VWAP lines
Trading Applications:
Support/Resistance: Use major pivot zones as key levels
Entry Timing: Combine confluence scores with price action
Trend Following: Use CHoCH signals for trend changes
Divergence Trading: Williams %R divergences with anchored VWAPs
Multi-Timeframe: Use HTF trend filter and VWAPs for context
Important Notes:
This is a technical analysis tool, not a trading system
Confluence scores indicate probability, not guarantees
Past performance does not predict future results
Always use proper risk management
Combine with your own analysis and strategy
Key Features
Pivot Quality Filters:
ATR-based significance filtering
Volume confirmation (optional)
Multi-timeframe confluence
Session-based weighting (optional)
Visual Elements:
Pivot zones (extendable boxes)
Structure lines (connecting major pivots)
CHoCH markers (market structure shifts)
Multiple VWAP overlays
Williams divergence markers
Customization:
Adjustable pivot strength multiplier
Enable/disable individual confluence factors
Customizable colors and visual styles
Alert system for major pivots and structure shifts
Technical Details
Open Source:
This script is open source. The code is available for review and modification. Users can see exactly how calculations are performed.
Calculations:
Pivot detection uses ta.pivothigh() and ta.pivotlow() with dynamic strength
VWAP calculations use cumulative price×volume / cumulative volume
Confluence scoring is additive based on multiple technical factors
Williams %R divergence uses pivot comparison logic
Limitations:
Historical data access limits apply (Pine Script constraints)
Structure lines limited to 500 bars for performance
Real-time mode may show pivots that later invalidate
Confirmation mode adds lag but increases reliability
Disclaimer
This script is for educational and informational purposes. It does not provide financial advice. Trading involves risk. Always do your own research and use proper risk management. Past performance does not guarantee future results.
