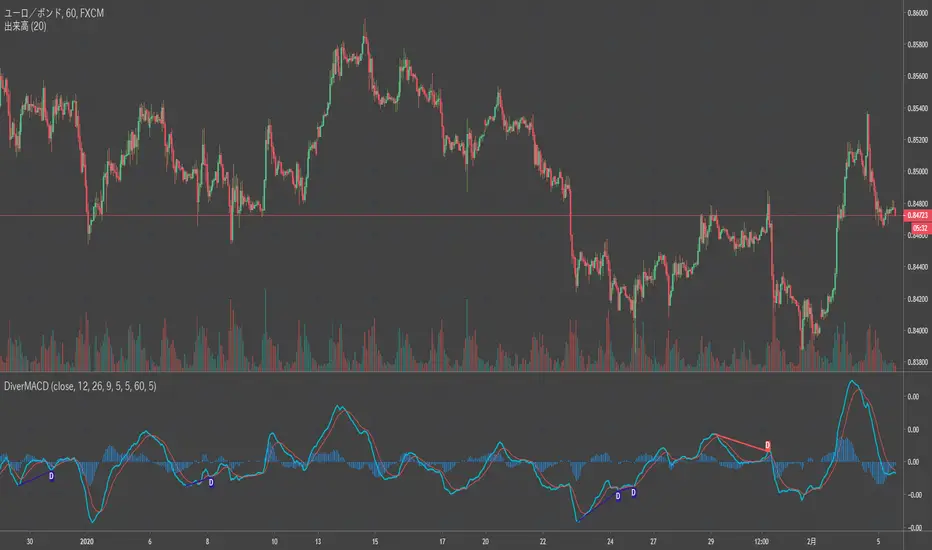
Divergence MACD [mado]Divergence screener for MACD
Regular Bullish: "D" navy label
Hidden Bullish: "H" navy label
Regular Bearish: "D" red label
Hidden Bearish: "H" red label
Cari dalam skrip untuk "bear"
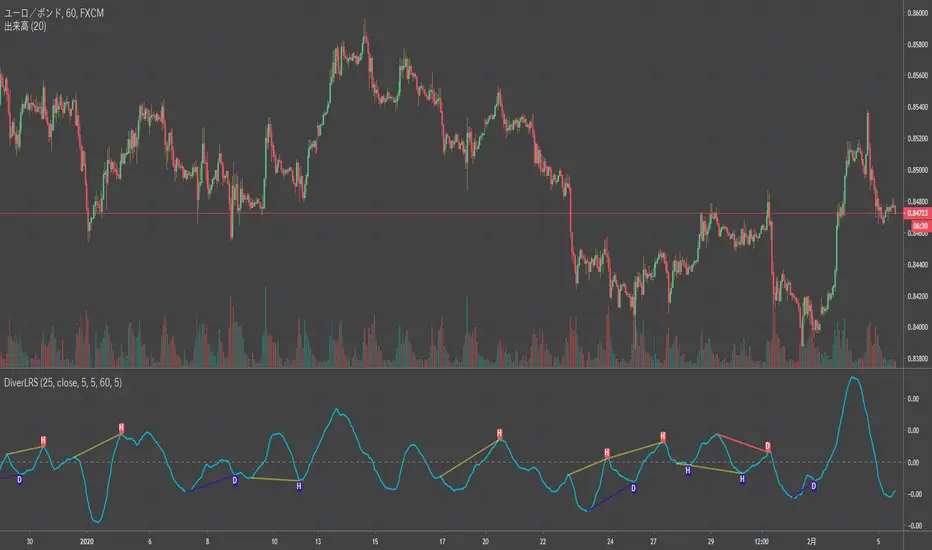
Divergence LinerRegressionSlope[mado]Divergence screener for LinerRegressionSlope
Regular Bullish: "D" navy label
Hidden Bullish: "H" navy label
Regular Bearish: "D" red label
Hidden Bearish: "H" red label
Divergence KlingerVolumeOscillator [mado]Divergence screener for KVO
Regular Bullish: "D" navy label
Hidden Bullish: "H" navy label
Regular Bearish: "D" red label
Hidden Bearish: "H" red label

Divergence CCI [mado]Divergence screener for CCI
Regular Bullish: "D" navy label
Hidden Bullish: "H" navy label
Regular Bearish: "D" red label
Hidden Bearish: "H" red label

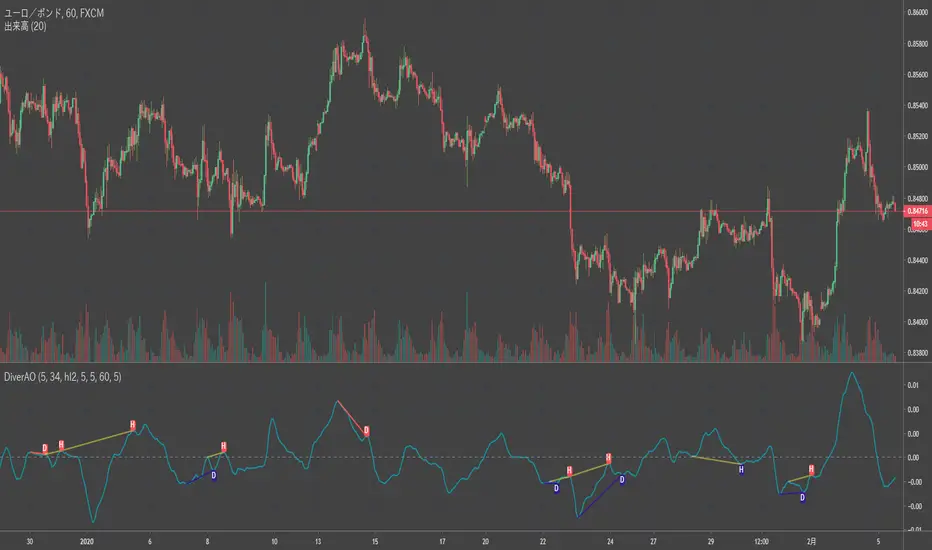
Divergence Awesome Oscillator [mado]Divergence screener for Awesome Oscillator
Regular Bullish: "D" navy label
Hidden Bullish: "H" navy label
Regular Bearish: "D" red label
Hidden Bearish: "H" red label
Elder impulse system with double exponential moving average dema
This version of impulse uses the double exponential moving average instead of the typical ema both to calculate macd and the moving slow and fast moving average that are plotted.
The impulse system :
The Impulse System combines two simple but powerful indicators.
One measures market inertia, the other its momentum. When both
point in the same direction, they identify an impulse worth following.
We get an entry signal when both indicators get in gear.
The Impulse System uses an exponential moving average to find
uptrends and downtrends. When the EMA rises, it shows that inertia
favors the bulls. When EMA falls, inertia works for the bears. The sec-
ond component is MACD-Histogram, an oscillator whose slope reflects
changes of power among bulls or bears. When MACD-Histogram rises,
it shows that bulls are becoming stronger. When it falls, it shows that
bears are growing stronger.
The Impulse System flags those bars where both the inertia and the
momentum point in the same direction. When both the EMA and
MACD-Histogram rise, they show that bulls are roaring and the uptrend
is accelerating.
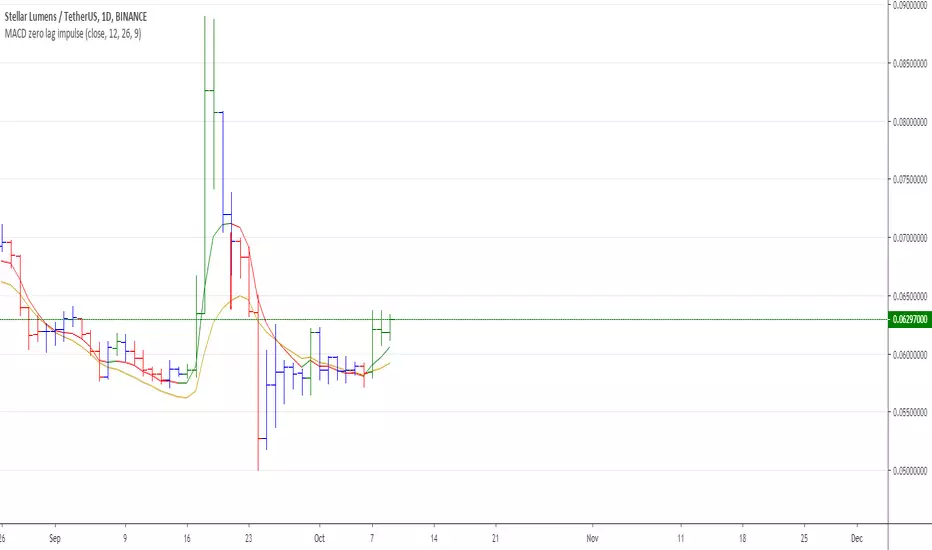
MACD Zero lag impulse systemThis version of impulse uses the double exponential moving average instead of the typical ema.
The impulse system :
The Impulse System combines two simple but powerful indicators.
One measures market inertia, the other its momentum. When both
point in the same direction, they identify an impulse worth following.
We get an entry signal when both indicators get in gear.
The Impulse System uses an exponential moving average to find
uptrends and downtrends. When the EMA rises, it shows that inertia
favors the bulls. When EMA falls, inertia works for the bears. The sec-
ond component is MACD-Histogram, an oscillator whose slope reflects
changes of power among bulls or bears. When MACD-Histogram rises,
it shows that bulls are becoming stronger. When it falls, it shows that
bears are growing stronger.
The Impulse System flags those bars where both the inertia and the
momentum point in the same direction. When both the EMA and
MACD-Histogram rise, they show that bulls are roaring and the uptrend
is accelerating.

Elder impulse system with barcolor + Safezone stops + emasThe impulse system :
The Impulse System combines two simple but powerful indicators.
One measures market inertia, the other its momentum. When both
point in the same direction, they identify an impulse worth following.
We get an entry signal when both indicators get in gear.
The Impulse System uses an exponential moving average to find
uptrends and downtrends. When the EMA rises, it shows that inertia
favors the bulls. When EMA falls, inertia works for the bears. The sec-
ond component is MACD-Histogram, an oscillator whose slope reflects
changes of power among bulls or bears. When MACD-Histogram rises,
it shows that bulls are becoming stronger. When it falls, it shows that
bears are growing stronger.
The Impulse System flags those bars where both the inertia and the
momentum point in the same direction. When both the EMA and
MACD-Histogram rise, they show that bulls are roaring and the uptrend
is accelerating.
The SafeZone Stop :
Once in a trade, where should you put your stop? This is one of the
hardest questions in technical analysis. After answering it, you’ll face
an even harder one—when and where to move that stop with the pas-
sage of time. Put a stop too close and it’ll get whacked by some mean-
ingless intraday swing. Put it too far, and you’ll have very skimpy
protection.
The Parabolic System, described in Trading for a Living, tried to
tackle this problem by moving stops closer to the market each day,
accelerating whenever a stock or a commodity reached a new extreme.
The trouble with Parabolic was that it kept moving even if the market
stayed flat and often got hit by meaningless noise.
SafeZone trails prices with stops tight enough to protect
capital but remote enough to keep clear of most random fluctuations.
Engineers design filters to suppress noise and allow the signal to come
through. If the trend is the signal, then the countertrend motion is the
noise. When the trend is up, we can define noise as that part of each
day’s range that protrudes below the previous day’s low. When the trend
is down, we can define noise as that part of each day’s range that pro-
trudes above the previous day’s high. SafeZone measures market noise
and places stops at a multiple of noise level away from the market.
We can make our lookback period 100 days or so if we want to aver-
age long-term market behavior.
SafeZone offers an original approach to placing stops. It monitors
changes in prices and adapts stops to the current levels of activity. It
places stops at individually tailored distances rather than at obvious
support and resistance levels.

DBT MoMo v.4DBT MOMO
Introduction: The MoMo is a TradingView indicator designed to evaluate momentum and give the user signals according to momentum shifts, strength, extensions, traps, and divergence. It’s an all in one oscillator that will make reading price action near term and long term much easier.
Part One: Strength
The MoMo consist of two major parts. A 3-candle back formula and a 24-candle back formula. The 3-candle back is called the Price Line (the histogram on the MoMo). The 24-candle back is called the Trend Line (the line on the MoMo). Both lines are placed into a range from 20 to -20. It can go higher than 20 or lower than -20, but this is extremely rare and short lived.
A positive number indicates a bullish bias, a negative number indicates a bearish bias. When the Price or Trend line are ascending while below 0 this indicates that the bearish momentum is weakening. When the Price or Trend line are descending while above 0 this indicates that the bullish momentum is weakening.
In a strong trend the Trend Line will likely flatten out around 15 or -15. While the Trend Line is flat the Price Line will likely shift rapidly, this can lead to bull and bear traps, we will discuss this in the Trap section.
A rare, but powerful signal from the MoMo is when the Price and Trend Lines “pinch” and begin to move in the same direction. If this is happening the trader should be looking to follow the direction of these lines.
Part Two: Extensions
When both Price and Trend Lines are above 10 or below -10 this will begin to signal an extension.
Purple: Indicates the bears are extended to the downside and a pullback or trend reversal upward is likely.
Gold: Indicates the bulls are extended to the upside and a pullback or trend reversal downward is likely.
When only the Trend Line is above 10 the MoMo will shade the upper range red. This indicates the Trend is becoming bullish or entering an extension. If the Trend Line cannot maintain above 10 for long and breaks below 10 this indicates it’s an extension and trend will most likely continue downward.
When only the Trend Line is below -10 the MoMo will shade the upper range green. This indicates the Trend is becoming bearish or entering an extension. If the Trend Line cannot maintain below -10 for long and breaks above -10 this indicates it’s an extension and trend will most likely continue upward.
When the green or purple shading have turned off take the lowest point, this is considered a support level or a local bottom.
When the red or gold shading have turned off take the highest point, this is considered a resistance level or a local top.
The trader can preemptively trade the purple or gold warnings but be warned these warnings can go on for a long time if the trend is very strong. It is the same mentality of an overbought or oversold RSI, except the MoMo extensions have a much higher strike rate.
To avoid preemptively trading these extensions the trader should wait for confirmation on the Price Line and on price action. The Price Line (histogram) should be moving upward during a purple extension to begin showing a bottom. The Price Line (histogram) should be moving downward during the gold extension to begin showing a top.
Part Three: Traps
The relation between the Price Line and Trend Line can create trading signals for bull and bear traps. When the Trend Line is flattened out around 15 or -15, indicating a strong trend is in place, and the Price Line is rapidly moving towards the midline this may indicate a trap is forming.
When the Trend Line is flat around 15 and the Price Line begins moving towards 0, if the Price Line reaches 0 or close to 0 and the Trend Line is still flat, a trap has begone. Once the Price Line shifts from decreasing (red) to increasing (green) the trap is playing out. Therefore, the trader should look to exit short positions or enter long positions.
When the Trend Line is flat around -15 and the Price Line begins moving towards 0, if the Price Line reaches 0 or close to 0 and the Trend Line is still flat, a trap has begone. Once the Price Line shifts from increasing (green) to decreasing (red) the trap is playing out. Therefore, the trader should look to exit long positions or enter short positions.
Part Four: Divergences
The MoMo is exceptional at finding divergences with the Price Line and occasionally the Trend Line.
To find a divergence with the MoMo the trader must look for when the histogram is not following price action completely.
Bullish Divergence: Price makes a lower low, MoMo makes a higher low.
Bearish Divergence: Price makes a higher high, MoMo makes a lower high.
Hidden Bull Divergence: Price makes a higher low, MoMo makes a lower low.
Hidden Bear Divergence: Price makes a lower high, MoMo makes a higher high.
For Access or Questions: Private message us. Thank you.

Absolute Strength MTF IndicatorIntroduction
The non-signal version of the absolute strength indicator from fxcodebase.com requested by ernie76 . This indicator originally from mt4 aim to estimate the bullish/bearish force of the market by using various methods.
The Indicator
Two lines are plotted, a bull line (blue) representing the bullish/buying force and a bear one (red) representing the bearish/selling force, when the bull line is greater than the bear line the market is considered to be strongly bullish, else strongly bearish.
The indicator use various method, Rsi, stochastic, adx. The Rsi method is the one by default.
The stochastic method is less reactive but smoother
The Adx method is way different, while the other two methods make the bull and bear lines somewhat uncorrelated, the adx method focus more on the overall market strength than individual buyer/seller strength.
The smoothing method use 3 different filters, SMA, EMA and LSMA, LSMA is more reactive than the two previous one while EMA is just more computer efficient.
It is possible to use price data of different time frames for the calculation of the indicator.
Stochastic method with 4 hour price close as source.
Conclusion
A classic indicator who can be derived into a lot of ways using a more adaptive architecture or recursion. Hope you find it a use :)
A big thanks to ernie76 for the request and the support/testing of the indicator
Feel free to pm me for any request.

fiercebitraderEl indicador fiercebitrader, es un indicador basado en el Índice Medio de Movimiento Direccional (ADX) es una herramienta de análisis técnico usada para medir la fuerza de la tendencia. El indicador direccional positivo ( DI) y el indicador direccional negativo (-DI) acompañan a la línea ADX. realzando la dirección de la tendencia.
Usados en conjunto forman un sistema de trading que es capaz de determinar tanto la dirección como la fuerza de la tendencia. El indicador consiste en tres líneas: la propia ADX (línea azul), una línea DI (línea verde), y una línea -DI (línea roja). El DI mide la fuerza de la tendencia alcista, mientras que el -DI mide la intensidad del movimiento bajista. La línea ADX muestra la fuerza de la tendencia en general creciendo tanto en las tendencias alcistas como bajistas.
Cuando el DI está por encima del -DI, se dice que los alcistas tienen el dominio direccional. De forma alternativa, cuando el -DI es más alto que el DI, el dominio direccional pertenece a los bajistas.
Es importante entender que el ADX (línea azul) muestra solo la fuerza de la tendencia y no la dirección de la tendencia. La dirección de la tendencia puede en cambio determinarse mirando al DI y el -DI (líneas roja y verde).
¿Cómo usarlo en el trading?
Operar con la tendencia reduce los riesgos e incrementa los beneficios potenciales. Es por esto que muchos traders prefieren consultar la fuerza de la tendencia con ayuda del ADX antes de invertir su dinero. Hay dos formas principales de usar el indicador:
El Cruce de DI
Cuando las líneas direccionales del positivo y negativo se cruzan, normalmente significa que la tendencia está cambiando. Esta información puede usarse para determinar puntos de entrada óptimos. Para los inversores que utilicen este sistema de trading, las señales son las siguientes:
(Compra) cuando el DI cruce el -DI , es mas efectivo, mas fuerte cuando toca o cruza la linea amarilla solida en el nivel de 27 y la tendencia general sea alcista.
El disparo se da en la linea de 20 punteada.
(Venta) cuando el -DI cruce el DI , es mas efectivo, más fuerte cuando toca o cruza la linea amarilla solida en el nivel de 27 y la tendencia sea bajista general sea bajista.
Valor de Fuerza Tendencia ADX
0-20 Tendencia Ausente o Débil
21-26 Disparo
27-50 Tendencia Fuerte
50-75 Tendencia muy Fuerte
75-100 Tendencia Extremadamente Fuerte
El fiercebitrader es un indicador de análisis técnico verdaderamente único, que combinado con otros indicadores, puede convertirse en la estrategia de trading definitiva en manos de un trader.
Recomendado para scalping en temporalidad de 5 min
swing day 1hora. Esta configurado para una operacion optima.
Acompañelo con el indicador bitradertracker.
Con mucho cariño Bitrader4.0
_________________________________
The fiercebitrader indicator, is an indicator based on the Mean Directional Movement Index (ADX) is a technical analysis tool used to measure the strength of the trend. The positive directional indicator (DI) and the negative directional indicator (-DI) accompany the ADX line. enhancing the direction of the trend.
Used together they form a trading system that is able to determine both the direction and strength of the trend. The indicator consists of three lines: the ADX itself (blue line), a DI line (green line), and a -DI line (red line). The DI measures the strength of the uptrend, while the -DI measures the intensity of the bearish movement. The ADX line shows the strength of the overall trend growing in both bullish and bearish trends.
When the DI is above the -DI, it is said that the bulls have the directional domain. Alternatively, when the -DI is higher than the DI, the directional domain belongs to the bears.
It is important to understand that the ADX (blue line) shows only the strength of the trend and not the direction of the trend. The direction of the trend can instead be determined by looking at the DI and the -DI (red and green lines).
How to use it in trading?
Operating with the trend reduces the risks and increases the potential benefits. This is why many traders prefer to consult the strength of the trend with the help of the ADX before investing their money. There are two main ways to use the indicator:
1) The Cross of DI
When the directional lines of the positive and negative intersect, it usually means that the trend is changing. This information can be used to determine optimal entry points. For investors who use this trading system, the signals are the following:
(Buy) when the DI crosses the -DI, it is more effective, stronger when it touches or crosses the solid yellow line at the level of 27 and the general trend is bullish.
The shot is given in the line of 20 dashed.
(Sale) when the -DI crosses the DI, it is more effective, stronger when it touches or crosses the solid yellow line at the level of 27 and the general bearish trend is bearish.
Strength Value ADX Trend
0-20 Absent or Weak Trend
21-26 Shot
27-50 Strong Trend
50-75 Very Strong Trend
75-100 Extremely Strong Trend
The fiercebitrader is a truly unique indicator of technical analysis, which combined with other indicators, can become the definitive trading strategy in the hands of a trader.
Recommended for scalping 5-minute and 1 hour.
It is configured for an optimal operation.
Accompany it with the bitradertracker indicator.
With love Bitrader4.0

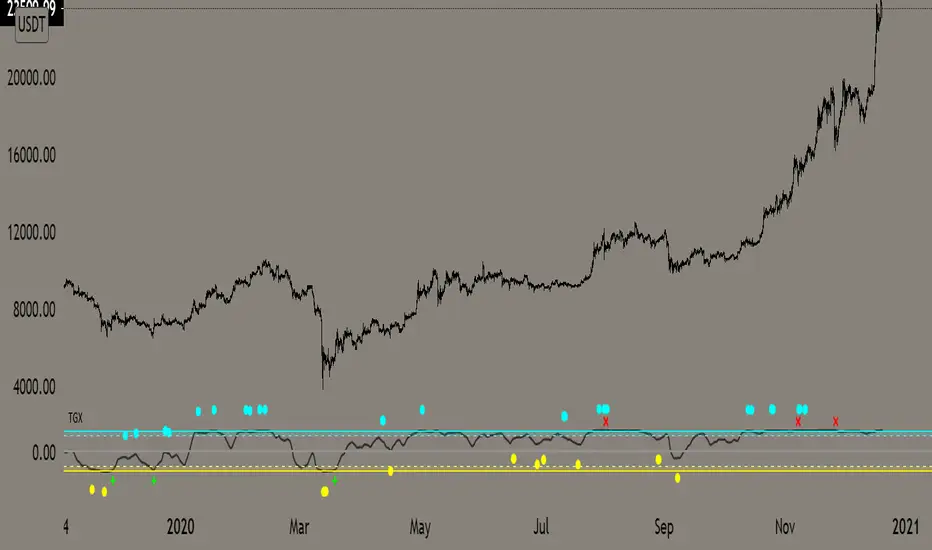
Top Goon X
Momentum based indicator
various signals for various parameters
bull/bear divergence will be seen as the dots with blue being bearish and yellow being bullish
the red X and green + are top and bottom signals per TGX
white flag appears respectably on top and bottom when all parameters are met bullshly or bearishly
Watch for TGX to reset while it rest just under resistance for a bullish set up
or
for TGX to run while sitting on top of support for bearish set up
TGX will trend in the upper parallel when bullish and bottom when bearish
towards the end of the trend is when you will see TGX "reset" for one last push up, albeit that push can run as long as it the market wants
@satoshiiheavy
Technical Analysis for www.cryptocurrentlyvip.com
Extremely Powerful Libra [Eric]This Indicator helps understand the Power shift between Bulls and Bears:
1. The volume is separated into bulls and bears power. For example, when we see a doji, we can check it for more inner information about who actually control the market.
2. The background is a prediction algo that predict the trending direction.
If you guys meet the:
Extremely Powerful Libra (3): Internal server study error
or Loop error,
Just check this button then switch my TF to 5 or bigger, normally 3 works well, but sometime the data is way too much that the server will reject to compile it.
prnt.sc

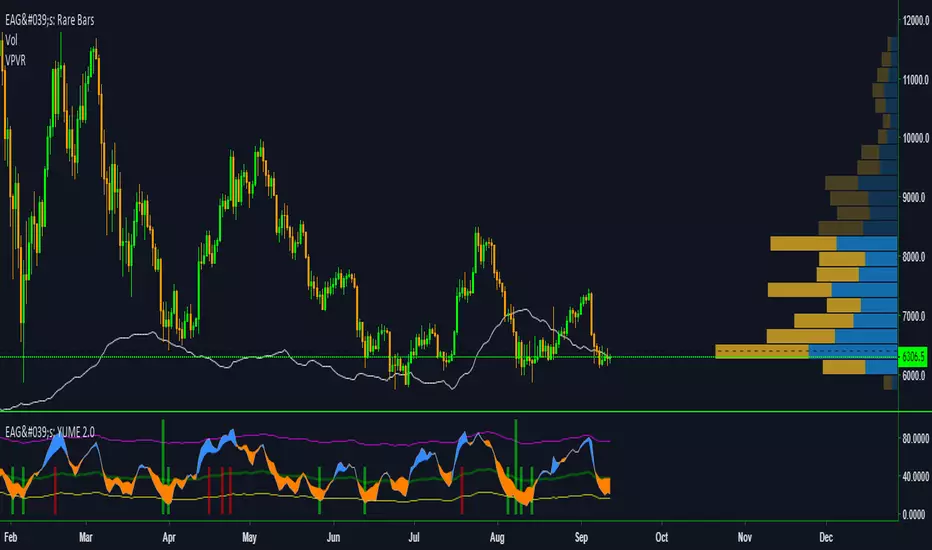
EdgeAnalysisGroup: Yume Wave 2.0This is a upgraded version of the wave with modified parameters for a higher success rate. 3 New Lengths and 75 more lines of code added to the overall algorithm. Also included are 2 sublevel signals based on the Fib MA and pattern trading.
The Wave:
+ The Yume is the Fast length
+ The Akume is the Slow length
+ The Miaku is a median weighted length
+ The Upper Limit is an overbought asset indication
+ The Lower Limit is an oversold asset indication
+ The Wave is the spread between Yume and Miaku
Bullish Indications:
+ The Yume is above the Akume
+ The Yume is above the Miaku
+ The Yume is below the Lower Limit
Bearish Indications:
+ The Yume is below the Akume
+ The Yume is below the Miaku
+ The Yume is above the Upper Limit
Signal Strength Weights:
+ 50 = Yume Wave crossed a Limit Line
+ 100 = Yume Wave crossed a Limit Line + Close to a Fib Moving Average
+ 100 = Edge's Market Bottom/Top Algorithm is marked 'True'
Setting up Signals (Based on a 100 Signal Height):
+ Set the "Bull Signal" to be at 50 or 100
+ Set the "Bear Signal" to be at 50 or 100
+ 50 is Agressive, 100 is Conservative.
+ Bull/Bear are separate so you can play conservative bull with aggressive bear.
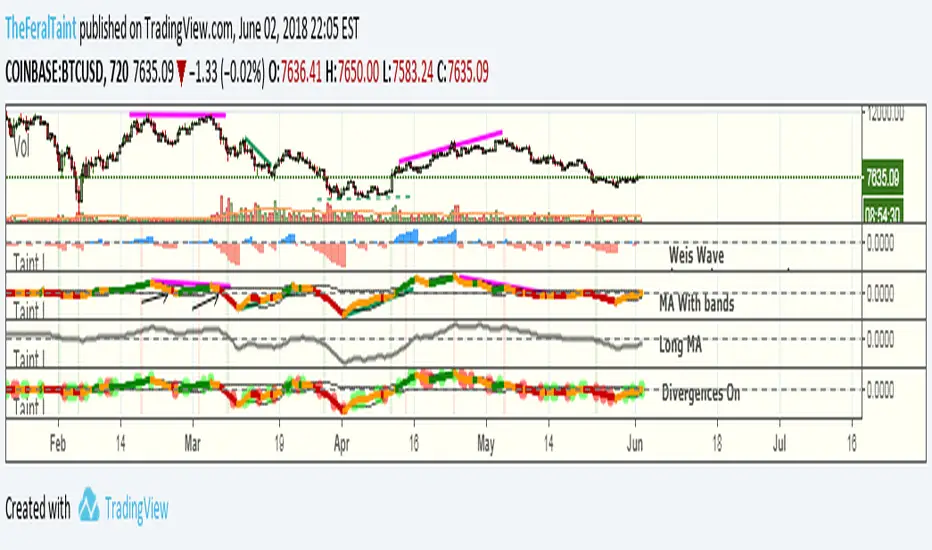
Taintalicious IndicatorThis indicator gathers data from the Weis Wave indicator (thanks to @LazyBear for the original code), and coverts it to something like a VPCI or a Chaikin Oscillator. This indicator is quite versatile. It can be ran with Weis Wave turned on and the Bands + MA turned on together, though I find the scaling becomes an issue. If it is the only indicator you're using, scaling isn't a problem as long as you enlarge it. I prefer to run the Bands + MA + Long MA as one setup, and flip to Weis Wave when I need to see the raw data underneath. You can use this indicator to spot momentum shifts, the strength of bullish or bearish moves, bull/bear divergences, trend reversals, consolidation/squeezes, and even Wyckoff springs. It will take some getting used to though.
Tips for interpretation:
--Bearish/Bearish Divergence: TI diverges from price. TI is making lower highs or higher lows while price is making higher highers or higher lows. You can turn on the setting to highlight some of these divergences, but I find it easier to simply look for them.
--As an Oscillator: TI crossing zero can indicate a shift in momentum. The deeper the initial rise or fall past zero, the stronger the momentum shift.
--Overbought/Oversold: When TI breaches the bands while they are wide--indicating high volatility in the same way Bollinger Bands do--this can be viewed as an overbought or oversold signal. Begin looking for an entry once TI forms a "v" shape, and begins moving back towards the bands. The best entry is typically when TI breaks back into the bands. These breaches are highlighted with either green or red.
--Long MA: This can be used for bull/bear divergence as well as a leading indicator for trend reversals or momentum shifts. TI crossing above or below the Long MA is one signal. Whether the Long MA is above or below zero indicates the market sentiment/trend over the last 100 periods--above zero being bullish and below zero being bearish.
Best setting for Trend Detection Length is 4
Feel free to contact me on Twitter if you have questions: @TheFeralTaint
420_Jpn_PatternsMy first iteration of a script that ID's japanese candlestick patterns including:
bullish_engulfing www.investopedia.com
bearish_engulfing www.investopedia.com
bullish_harami www.investopedia.com
bearish_harami www.investopedia.com
piercing_line (bullish) www.investopedia.com
dark_cloud_cover (bearish) www.investopedia.com
morning_star (bullish) www.investopedia.com
evening_star (bearish) www.investopedia.com
bullish_belt www.investopedia.com
bearish_belt www.investopedia.com
aka_sanpei (bullish) www.investopedia.com
sanba_garasu (bearish) www.investopedia.com
three_stars_south (bullish) www.investopedia.com
stick_sandwich www.investopedia.com
bullish_meeting_line www.thepatternsite.com
bearish_meeting_line www.thepatternsite.com
bullish_kicking www.thepatternsite.com
bearish_kicking thepatternsite.com
ladder_bottom (bullish) www.thepatternsite.com
inverted_hammer www.thepatternsite.com
shooting_star www.thepatternsite.com www.thepatternsite.com
hanging_man (bearish) www.thepatternsite.com
hammer (bullish) www.thepatternsite.com
xoxo
sn00p

Razzere Cloned! EzAlgo V.8.1showBuySell = input(true, "Show Buy & Sell", group="BUY & SELL SIGNALS")
hassasiyet = input.float(3, "Hassasiyet (1-6)", 0.1, 99999, group="BUY & SELL SIGNALS")
percentStop = input.float(1, "Stop Loss % (0 to Disable)", 0, group="BUY & SELL SIGNALS")
offsetSignal = input.float(5, "Signals Offset", 0, group="BUY & SELL SIGNALS")
showRibbon = input(true, "Show Trend Ribbon", group="TREND RIBBON")
smooth1 = input.int(5, "Smoothing 1", 1, group="TREND RIBBON")
smooth2 = input.int(8, "Smoothing 2", 1, group="TREND RIBBON")
showreversal = input(true, "Show Reversals", group="REVERSAL SIGNALS")
showPdHlc = input(false, "Show P.D H/L/C", group="PREVIOUS DAY HIGH LOW CLOSE")
lineColor = input.color(color.yellow, "Line Colors", group="PREVIOUS DAY HIGH LOW CLOSE")
lineWidth = input.int(1, "Width Lines", group="PREVIOUS DAY HIGH LOW CLOSE")
lineStyle = input.string("Solid", "Line Style", )
labelSize = input.string("normal", "Label Text Size", )
labelColor = input.color(color.yellow, "Label Text Colors")
showEmas = input(false, "Show EMAs", group="EMA")
srcEma1 = input(close, "Source EMA 1")
lenEma1 = input.int(7, "Length EMA 1", 1)
srcEma2 = input(close, "Source EMA 2")
lenEma2 = input.int(21, "Length EMA 2", 1)
srcEma3 = input(close, "Source EMA 3")
lenEma3 = input.int(144, "Length EMA 3", 1)
showSwing = input(false, "Show Swing Points", group="SWING POINTS")
prdSwing = input.int(10, "Swing Point Period", 2, group="SWING POINTS")
colorPos = input(color.new(color.green, 50), "Positive Swing Color")
colorNeg = input(color.new(color.red, 50), "Negative Swing Color")
showDashboard = input(true, "Show Dashboard", group="TREND DASHBOARD")
locationDashboard = input.string("Middle Right", "Table Location", , group="TREND DASHBOARD")
tableTextColor = input(color.white, "Table Text Color", group="TREND DASHBOARD")
tableBgColor = input(#2A2A2A, "Table Background Color", group="TREND DASHBOARD")
sizeDashboard = input.string("Normal", "Table Size", , group="TREND DASHBOARD")
showRevBands = input.bool(true, "Show Reversal Bands", group="REVERSAL BANDS")
lenRevBands = input.int(30, "Length", group="REVERSAL BANDS")
// Fonksiyonlar
smoothrng(x, t, m) =>
wper = t * 2 - 1
avrng = ta.ema(math.abs(x - x ), t)
smoothrng = ta.ema(avrng, wper) * m
rngfilt(x, r) =>
rngfilt = x
rngfilt := x > nz(rngfilt ) ? x - r < nz(rngfilt ) ? nz(rngfilt ) : x - r : x + r > nz(rngfilt ) ? nz(rngfilt ) : x + r
percWidth(len, perc) => (ta.highest(len) - ta.lowest(len)) * perc / 100
securityNoRep(sym, res, src) => request.security(sym, res, src, barmerge.gaps_off, barmerge.lookahead_on)
swingPoints(prd) =>
pivHi = ta.pivothigh(prd, prd)
pivLo = ta.pivotlow (prd, prd)
last_pivHi = ta.valuewhen(pivHi, pivHi, 1)
last_pivLo = ta.valuewhen(pivLo, pivLo, 1)
hh = pivHi and pivHi > last_pivHi ? pivHi : na
lh = pivHi and pivHi < last_pivHi ? pivHi : na
hl = pivLo and pivLo > last_pivLo ? pivLo : na
ll = pivLo and pivLo < last_pivLo ? pivLo : na
f_chartTfInMinutes() =>
float _resInMinutes = timeframe.multiplier * (
timeframe.isseconds ? 1 :
timeframe.isminutes ? 1. :
timeframe.isdaily ? 60. * 24 :
timeframe.isweekly ? 60. * 24 * 7 :
timeframe.ismonthly ? 60. * 24 * 30.4375 : na)
f_kc(src, len, hassasiyet) =>
basis = ta.sma(src, len)
span = ta.atr(len)
wavetrend(src, chlLen, avgLen) =>
esa = ta.ema(src, chlLen)
d = ta.ema(math.abs(src - esa), chlLen)
ci = (src - esa) / (0.015 * d)
wt1 = ta.ema(ci, avgLen)
wt2 = ta.sma(wt1, 3)
f_top_fractal(src) => src < src and src < src and src > src and src > src
f_bot_fractal(src) => src > src and src > src and src < src and src < src
f_fractalize (src) => f_top_fractal(src) ? 1 : f_bot_fractal(src) ? -1 : 0
f_findDivs(src, topLimit, botLimit) =>
fractalTop = f_fractalize(src) > 0 and src >= topLimit ? src : na
fractalBot = f_fractalize(src) < 0 and src <= botLimit ? src : na
highPrev = ta.valuewhen(fractalTop, src , 0)
highPrice = ta.valuewhen(fractalTop, high , 0)
lowPrev = ta.valuewhen(fractalBot, src , 0)
lowPrice = ta.valuewhen(fractalBot, low , 0)
bearSignal = fractalTop and high > highPrice and src < highPrev
bullSignal = fractalBot and low < lowPrice and src > lowPrev
// Bileşen...
source = close
smrng1 = smoothrng(source, 27, 1.5)
smrng2 = smoothrng(source, 55, hassasiyet)
smrng = (smrng1 + smrng2) / 2
filt = rngfilt(source, smrng)
up = 0.0, up := filt > filt ? nz(up ) + 1 : filt < filt ? 0 : nz(up )
dn = 0.0, dn := filt < filt ? nz(dn ) + 1 : filt > filt ? 0 : nz(dn )
bullCond = bool(na), bullCond := source > filt and source > source and up > 0 or source > filt and source < source and up > 0
bearCond = bool(na), bearCond := source < filt and source < source and dn > 0 or source < filt and source > source and dn > 0
lastCond = 0, lastCond := bullCond ? 1 : bearCond ? -1 : lastCond
bull = bullCond and lastCond == -1
bear = bearCond and lastCond == 1
countBull = ta.barssince(bull)
countBear = ta.barssince(bear)
trigger = nz(countBull, bar_index) < nz(countBear, bar_index) ? 1 : 0
ribbon1 = ta.sma(close, smooth1)
ribbon2 = ta.sma(close, smooth2)
rsi = ta.rsi(close, 21)
rsiOb = rsi > 70 and rsi > ta.ema(rsi, 10)
rsiOs = rsi < 30 and rsi < ta.ema(rsi, 10)
dHigh = securityNoRep(syminfo.tickerid, "D", high )
dLow = securityNoRep(syminfo.tickerid, "D", low )
dClose = securityNoRep(syminfo.tickerid, "D", close )
ema1 = ta.ema(srcEma1, lenEma1)
ema2 = ta.ema(srcEma2, lenEma2)
ema3 = ta.ema(srcEma3, lenEma3)
= swingPoints(prdSwing)
ema = ta.ema(close, 144)
emaBull = close > ema
equal_tf(res) => str.tonumber(res) == f_chartTfInMinutes() and not timeframe.isseconds
higher_tf(res) => str.tonumber(res) > f_chartTfInMinutes() or timeframe.isseconds
too_small_tf(res) => (timeframe.isweekly and res=="1") or (timeframe.ismonthly and str.tonumber(res) < 10)
securityNoRep1(sym, res, src) =>
bool bull_ = na
bull_ := equal_tf(res) ? src : bull_
bull_ := higher_tf(res) ? request.security(sym, res, src, barmerge.gaps_off, barmerge.lookahead_on) : bull_
bull_array = request.security_lower_tf(syminfo.tickerid, higher_tf(res) ? str.tostring(f_chartTfInMinutes()) + (timeframe.isseconds ? "S" : "") : too_small_tf(res) ? (timeframe.isweekly ? "3" : "10") : res, src)
if array.size(bull_array) > 1 and not equal_tf(res) and not higher_tf(res)
bull_ := array.pop(bull_array)
array.clear(bull_array)
bull_
TF1Bull = securityNoRep1(syminfo.tickerid, "1" , emaBull)
TF3Bull = securityNoRep1(syminfo.tickerid, "3" , emaBull)
TF5Bull = securityNoRep1(syminfo.tickerid, "5" , emaBull)
TF15Bull = securityNoRep1(syminfo.tickerid, "15" , emaBull)
TF30Bull = securityNoRep1(syminfo.tickerid, "30" , emaBull)
TF60Bull = securityNoRep1(syminfo.tickerid, "60" , emaBull)
TF120Bull = securityNoRep1(syminfo.tickerid, "120" , emaBull)
TF240Bull = securityNoRep1(syminfo.tickerid, "240" , emaBull)
TF480Bull = securityNoRep1(syminfo.tickerid, "480" , emaBull)
TFDBull = securityNoRep1(syminfo.tickerid, "1440", emaBull)
= f_kc(close, lenRevBands, 3)
= f_kc(close, lenRevBands, 4)
= f_kc(close, lenRevBands, 5)
= f_kc(close, lenRevBands, 6)
= wavetrend(hlc3, 9, 12)
= f_findDivs(wt2, 15, -40)
= f_findDivs(wt2, 45, -65)
wtDivBull = wtDivBull1 or wtDivBull2
wtDivBear = wtDivBear1 or wtDivBear2
// Renkler
cyan = #00DBFF, cyan30 = color.new(cyan, 70)
pink = #E91E63, pink30 = color.new(pink, 70)
red = #FF5252, red30 = color.new(red , 70)
// Plotlar
off = percWidth(300, offsetSignal)
plotshape(showBuySell and bull ? low - off : na, "Buy Label" , shape.labelup , location.absolute, cyan, 0, "Buy" , color.white, size=size.normal)
plotshape(showBuySell and bear ? high + off : na, "Sell Label", shape.labeldown, location.absolute, pink, 0, "Sell", color.white, size=size.normal)
plotshape(ta.crossover(wt1, wt2) and wt2 <= -53, "Mild Buy" , shape.xcross, location.belowbar, cyan, size=size.tiny)
plotshape(ta.crossunder(wt1, wt2) and wt2 >= 53, "Mild Sell", shape.xcross, location.abovebar, pink, size=size.tiny)
plotshape(wtDivBull, "Divergence Buy ", shape.triangleup , location.belowbar, cyan, size=size.tiny)
plotshape(wtDivBear, "Divergence Sell", shape.triangledown, location.abovebar, pink, size=size.tiny)
barcolor(up > dn ? cyan : pink)
plotshape(showreversal and rsiOs, "Reversal Buy" , shape.diamond, location.belowbar, cyan30, size=size.tiny)
plotshape(showreversal and rsiOb, "Reversal Sell", shape.diamond, location.abovebar, pink30, size=size.tiny)
lStyle = lineStyle == "Solid" ? line.style_solid : lineStyle == "Dotted" ? line.style_dotted : line.style_dashed
lSize = labelSize == "small" ? size.small : labelSize == "normal" ? size.normal : size.large
dHighLine = showPdHlc ? line.new(bar_index, dHigh, bar_index + 1, dHigh , xloc.bar_index, extend.both, lineColor, lStyle, lineWidth) : na, line.delete(dHighLine )
dLowLine = showPdHlc ? line.new(bar_index, dLow , bar_index + 1, dLow , xloc.bar_index, extend.both, lineColor, lStyle, lineWidth) : na, line.delete(dLowLine )
dCloseLine = showPdHlc ? line.new(bar_index, dClose, bar_index + 1, dClose, xloc.bar_index, extend.both, lineColor, lStyle, lineWidth) : na, line.delete(dCloseLine )
dHighLabel = showPdHlc ? label.new(bar_index + 100, dHigh , "P.D.H", xloc.bar_index, yloc.price, #000000, label.style_none, labelColor, lSize) : na, label.delete(dHighLabel )
dLowLabel = showPdHlc ? label.new(bar_index + 100, dLow , "P.D.L", xloc.bar_index, yloc.price, #000000, label.style_none, labelColor, lSize) : na, label.delete(dLowLabel )
dCloseLabel = showPdHlc ? label.new(bar_index + 100, dClose, "P.D.C", xloc.bar_index, yloc.price, #000000, label.style_none, labelColor, lSize) : na, label.delete(dCloseLabel )
plot(showEmas ? ema1 : na, "EMA 1", color.green , 2)
plot(showEmas ? ema2 : na, "EMA 2", color.purple, 2)
plot(showEmas ? ema3 : na, "EMA 3", color.yellow, 2)
plotshape(showSwing ? hh : na, "", shape.triangledown, location.abovebar, color.new(color.green, 50), -prdSwing, "HH", colorPos, false)
plotshape(showSwing ? hl : na, "", shape.triangleup , location.belowbar, color.new(color.green, 50), -prdSwing, "HL", colorPos, false)
plotshape(showSwing ? lh : na, "", shape.triangledown, location.abovebar, color.new(color.red , 50), -prdSwing, "LH", colorNeg, false)
plotshape(showSwing ? ll : na, "", shape.triangleup , location.belowbar, color.new(color.red , 50), -prdSwing, "LL", colorNeg, false)
srcStop = close
atrBand = srcStop * (percentStop / 100)
atrStop = trigger ? srcStop - atrBand : srcStop + atrBand
lastTrade(src) => ta.valuewhen(bull or bear, src, 0)
entry_y = lastTrade(srcStop)
stop_y = lastTrade(atrStop)
tp1_y = (entry_y - lastTrade(atrStop)) * 1 + entry_y
tp2_y = (entry_y - lastTrade(atrStop)) * 2 + entry_y
tp3_y = (entry_y - lastTrade(atrStop)) * 3 + entry_y
labelTpSl(y, txt, color) =>
label labelTpSl = percentStop != 0 ? label.new(bar_index + 1, y, txt, xloc.bar_index, yloc.price, color, label.style_label_left, color.white, size.normal) : na
label.delete(labelTpSl )
labelTpSl(entry_y, "Entry: " + str.tostring(math.round_to_mintick(entry_y)), color.gray)
labelTpSl(stop_y , "Stop Loss: " + str.tostring(math.round_to_mintick(stop_y)), color.red)
labelTpSl(tp1_y, "Take Profit 1: " + str.tostring(math.round_to_mintick(tp1_y)), color.green)
labelTpSl(tp2_y, "Take Profit 2: " + str.tostring(math.round_to_mintick(tp2_y)), color.green)
labelTpSl(tp3_y, "Take Profit 3: " + str.tostring(math.round_to_mintick(tp3_y)), color.green)
lineTpSl(y, color) =>
line lineTpSl = percentStop != 0 ? line.new(bar_index - (trigger ? countBull : countBear) + 4, y, bar_index + 1, y, xloc.bar_index, extend.none, color, line.style_solid) : na
line.delete(lineTpSl )
lineTpSl(entry_y, color.gray)
lineTpSl(stop_y, color.red)
lineTpSl(tp1_y, color.green)
lineTpSl(tp2_y, color.green)
lineTpSl(tp3_y, color.green)
var dashboard_loc = locationDashboard == "Top Right" ? position.top_right : locationDashboard == "Middle Right" ? position.middle_right : locationDashboard == "Bottom Right" ? position.bottom_right : locationDashboard == "Top Center" ? position.top_center : locationDashboard == "Middle Center" ? position.middle_center : locationDashboard == "Bottom Center" ? position.bottom_center : locationDashboard == "Top Left" ? position.top_left : locationDashboard == "Middle Left" ? position.middle_left : position.bottom_left
var dashboard_size = sizeDashboard == "Large" ? size.large : sizeDashboard == "Normal" ? size.normal : sizeDashboard == "Small" ? size.small : size.tiny
var dashboard = showDashboard ? table.new(dashboard_loc, 2, 15, tableBgColor, #000000, 2, tableBgColor, 1) : na
dashboard_cell(column, row, txt, signal=false) => table.cell(dashboard, column, row, txt, 0, 0, signal ? #000000 : tableTextColor, text_size=dashboard_size)
dashboard_cell_bg(column, row, col) => table.cell_set_bgcolor(dashboard, column, row, col)
if barstate.islast and showDashboard
dashboard_cell(0, 0 , "EzAlgo")
dashboard_cell(0, 1 , "Current Position")
dashboard_cell(0, 2 , "Current Trend")
dashboard_cell(0, 3 , "Volume")
dashboard_cell(0, 4 , "Timeframe")
dashboard_cell(0, 5 , "1 min:")
dashboard_cell(0, 6 , "3 min:")
dashboard_cell(0, 7 , "5 min:")
dashboard_cell(0, 8 , "15 min:")
dashboard_cell(0, 9 , "30 min:")
dashboard_cell(0, 10, "1 H:")
dashboard_cell(0, 11, "2 H:")
dashboard_cell(0, 12, "4 H:")
dashboard_cell(0, 13, "8 H:")
dashboard_cell(0, 14, "Daily:")
dashboard_cell(1, 0 , "V.8.1")
dashboard_cell(1, 1 , trigger ? "Buy" : "Sell", true), dashboard_cell_bg(1, 1, trigger ? color.green : color.red)
dashboard_cell(1, 2 , emaBull ? "Bullish" : "Bearish", true), dashboard_cell_bg(1, 2, emaBull ? color.green : color.red)
dashboard_cell(1, 3 , str.tostring(volume))
dashboard_cell(1, 4 , "Trends")
dashboard_cell(1, 5 , TF1Bull ? "Bullish" : "Bearish", true), dashboard_cell_bg(1, 5 , TF1Bull ? color.green : color.red)
dashboard_cell(1, 6 , TF3Bull ? "Bullish" : "Bearish", true), dashboard_cell_bg(1, 6 , TF3Bull ? color.green : color.red)
dashboard_cell(1, 7 , TF5Bull ? "Bullish" : "Bearish", true), dashboard_cell_bg(1, 7 , TF5Bull ? color.green : color.red)
dashboard_cell(1, 8 , TF15Bull ? "Bullish" : "Bearish", true), dashboard_cell_bg(1, 8 , TF15Bull ? color.green : color.red)
dashboard_cell(1, 9 , TF30Bull ? "Bullish" : "Bearish", true), dashboard_cell_bg(1, 9 , TF30Bull ? color.green : color.red)
dashboard_cell(1, 10, TF60Bull ? "Bullish" : "Bearish", true), dashboard_cell_bg(1, 10, TF60Bull ? color.green : color.red)
dashboard_cell(1, 11, TF120Bull ? "Bullish" : "Bearish", true), dashboard_cell_bg(1, 11, TF120Bull ? color.green : color.red)
dashboard_cell(1, 12, TF240Bull ? "Bullish" : "Bearish", true), dashboard_cell_bg(1, 12, TF240Bull ? color.green : color.red)
dashboard_cell(1, 13, TF480Bull ? "Bullish" : "Bearish", true), dashboard_cell_bg(1, 13, TF480Bull ? color.green : color.red)
dashboard_cell(1, 14, TFDBull ? "Bullish" : "Bearish", true), dashboard_cell_bg(1, 14, TFDBull ? color.green : color.red)
plot(showRevBands ? upperKC1 : na, "Rev.Zone Upper 1", red30)
plot(showRevBands ? upperKC2 : na, "Rev.Zone Upper 2", red30)
plot(showRevBands ? upperKC3 : na, "Rev.Zone Upper 3", red30)
plot(showRevBands ? upperKC4 : na, "Rev.Zone Upper 4", red30)
plot(showRevBands ? lowerKC4 : na, "Rev.Zone Lower 4", cyan30)
plot(showRevBands ? lowerKC3 : na, "Rev.Zone Lower 3", cyan30)
plot(showRevBands ? lowerKC2 : na, "Rev.Zone Lower 2", cyan30)
plot(showRevBands ? lowerKC1 : na, "Rev.Zone Lower 1", cyan30)
fill(plot(showRibbon ? ribbon1 : na, "", na, editable=false), plot(showRibbon ? ribbon2 : na, "", na, editable=false), ribbon1 > ribbon2 ? cyan30 : pink30, "Ribbon Fill Color")
// Alarmlar
alert01 = ta.crossover(ribbon1, ribbon2)
alert02 = bull
alert03 = wtDivBull
alert04 = wtDivBear
alert05 = bull or bear
alert06 = ta.crossover(wt1, wt2) and wt2 <= -53
alert07 = ta.crossunder(wt1, wt2) and wt2 >= 53
alert08 = ta.crossunder(ribbon1, ribbon2)
alert09 = rsiOb or rsiOs
alert10 = bear
alert11 = ta.cross(ribbon1, ribbon2)
alerts(sym) =>
if alert02 or alert03 or alert04 or alert06 or alert07 or alert10
alert_text = alert02 ? "Buy Signal EzAlgo" : alert03 ? "Strong Buy Signal EzAlgo" : alert04 ? "Strong Sell Signal EzAlgo" : alert06 ? "Mild Buy Signal EzAlgo" : alert07 ? "Mild Sell Signal EzAlgo" : "Sell Signal EzAlgo"
alert(alert_text, alert.freq_once_per_bar_close)
alerts(syminfo.tickerid)
alertcondition(alert01, "Blue Trend Ribbon Alert", "Blue Trend Ribbon, TimeFrame={{interval}}")
alertcondition(alert02, "Buy Signal", "Buy Signal EzAlgo")
alertcondition(alert03, "Divergence Buy Alert", "Strong Buy Signal EzAlgo, TimeFrame={{interval}}")
alertcondition(alert04, "Divergence Sell Alert", "Strong Sell Signal EzAlgo, TimeFrame={{interval}}")
alertcondition(alert05, "Either Buy or Sell Signal", "EzAlgo Signal")
alertcondition(alert06, "Mild Buy Alert", "Mild Buy Signal EzAlgo, TimeFrame={{interval}}")
alertcondition(alert07, "Mild Sell Alert", "Mild Sell Signal EzAlgo, TimeFrame={{interval}}")
alertcondition(alert08, "Red Trend Ribbon Alert", "Red Trend Ribbon, TimeFrame={{interval}}")
alertcondition(alert09, "Reversal Signal", "Reversal Signal")
alertcondition(alert10, "Sell Signal", "Sell Signal EzAlgo")
alertcondition(alert11, "Trend Ribbon Color Change Alert", "Trend Ribbon Color Change, TimeFrame={{interval}}")

Relative Volume Bollinger Band %
The Relative Volume Bollinger Band % indicator is a powerful tool designed for traders seeking insights into volume, Bollinger band and relative strength dynamics. This indicator assesses the deviation of a security's trading volume relative to the Bollinger band % indicator and the RSI moving average. Together, these shed light on potential zones of interests where market shifts have a high probability of occurring.
Key Features:
Period: Tailor the indicator's sensitivity by adjusting the period of the smooth moving average and/or the period of the Bollinger band.
How it Works:
Moving Average Calculation: The script computes the simple moving average (SMA) of the relative strength over a defined period. When the higher SMA (orange line) is in the top grey zone, the security is in a zone where it has a high probability of becoming bullish. When the higher SMA is in the lower grey zone, the security is in a zone where it has a high probability of becoming bearish.
-Bollinger Band %: The script also computes the BB% which is primarily used to confirm overbought and oversold areas. When overbought, it turns white and remains white until the overbuying pressure is released indicating that the security is about to become bearish. The script indicates a bearish reversal when the BB% and RVOL bars are both red or when there are no more yellow RVOL bars, if present. When the BB% is<0 and rising, it will also appear white with yellow RVOL bars above. This is a good indication that bulls are beginning to enter buying positions. Confirmation here is indicated when the yellow RVOL bars change to green.
Relative Volume: The indicator then also normalizes the difference volume to indicate areas of high and low volatility. This shows where higher than normal volumes are being traded and can be used as a good indication of when to enter or exit a trade when the above criterions are met.
Visual Representation: The result is visually represented on the chart using columns. Bright green columns signify bullish relative volume values that are much greater than normal. Green columns signify bullish relative volume values that are significant. Red columns represent bearish values that are significant. Blue columns on the BB% indicator represent significant bullish buying in overbought areas. Red columns on the BB% indicator that are < 0 represent a bearish trend that is in an oversold area. This is there to prevent early entry into the market.
Enhancements:
Areas of Interest: Optionally, Areas of interest are represented by red, yellow and green circles on the higher SMA line, aiding in the identification of significant deviations.

ICT Bias (Dynamic Timeframe By Hayk Trading)This indicator designed to offer context, not signals, helping traders stay aligned with the broader directional flow of the market.
Bias States:
Bullish: Market conditions favor higher prices during the trading day.
Bearish: Market conditions favor lower prices during the trading day.
Neutral: No clear directional advantage is present.
This tool is intended to support:
Directional filtering for intraday trading
Improved trade discipline
Reduced overtrading in unfavorable conditions
The Daily Bias does not predict price, provide entries, or guarantee outcomes. It simply highlights the prevailing directional environment for the session.
Use it as a decision-support tool, not as a standalone trading system.

able FRVP Reversal# able FRVP Reversal - Complete User Guide
## 📌 Overview
**able FRVP Reversal** is a professional-grade Volume Profile indicator with an integrated reversal detection system. It combines Fixed Range Volume Profile (FRVP) analysis with a confluence-based reversal scoring system to identify high-probability turning points at key volume levels.
---
## ✨ Key Features
| Feature | Description |
|---------|-------------|
| **Session-Based Volume Profile** | Automatically resets at the beginning of each regular trading session |
| **POC (Point of Control)** | Highest volume price level - strongest support/resistance |
| **VAH (Value Area High)** | Upper boundary of the 70% value area - resistance zone |
| **VAL (Value Area Low)** | Lower boundary of the 70% value area - support zone |
| **Confluence Scoring System** | 5-point scoring system for reversal detection |
| **Smart Cooldown** | Prevents signal spam with customizable cooldown period |
| **Real-time Info Table** | Displays all key metrics in a retro-style dashboard |
---
## 🔧 Installation
1. Open TradingView and go to **Pine Editor**
2. Delete any existing code and paste the indicator code
3. Click **"Add to Chart"**
4. Configure settings as needed
---
## ⚙️ Settings Explained
### 📊 Volume Profile Settings
| Setting | Default | Description |
|---------|---------|-------------|
| **Number of Rows** | 50 | Resolution of the volume profile (more rows = finer detail) |
| **Value Area %** | 70 | Percentage of volume to include in Value Area (industry standard: 70%) |
| **Profile Width** | 40 | Visual width of the histogram on chart |
| **Show Histogram** | ✓ | Display volume histogram bars |
| **Show POC/VAH/VAL** | ✓ | Display the three key levels |
| **Show Labels** | ✓ | Display price labels for each level |
| **Extend Lines** | ✓ | Extend levels to the right of current price |
| **Extend Length** | 100 | How far to extend the lines (in bars) |
### 🔄 Reversal Detection Settings
| Setting | Default | Description |
|---------|---------|-------------|
| **Enable Reversal Detection** | ✓ | Turn reversal signals on/off |
| **Min Confluence Score** | 3 | Minimum score required to trigger signal (1-5) |
| **Cooldown Bars** | 10 | Minimum bars between signals to prevent spam |
#### Understanding Min Confluence Score:
- **Score 1-2**: Very sensitive, many signals (not recommended)
- **Score 3**: Balanced - good for most traders ⭐ Recommended
- **Score 4**: Conservative - fewer but higher quality signals
- **Score 5**: Very strict - only strongest reversals
### 🎨 Color Settings
All colors are fully customizable:
- **POC Line**: Default Gold (#FFD700)
- **VAH Line**: Default Coral Red (#FF6B6B)
- **VAL Line**: Default Teal (#4ECDC4)
- **Bullish Reversal**: Default Green (#00E676)
- **Bearish Reversal**: Default Red (#FF5252)
---
## 📖 How to Read the Indicator
### Volume Profile Histogram
```
█████████████ ← High volume = Strong S/R
████████ ← Medium volume
████ ← Low volume = Weak S/R
██
```
- **Darker/Longer bars** = More trading activity at that price
- **Inside Value Area** = Colored based on session direction (Bull/Bear)
- **Outside Value Area** = Muted gray color
### Key Levels
| Level | Color | Meaning |
|-------|-------|---------|
| **POC** | Yellow | Price with highest volume - Strongest magnet |
| **VAH** | Red | Upper resistance - Look for bearish reversals |
| **VAL** | Teal | Lower support - Look for bullish reversals |
---
## 🔄 Reversal Detection System
### How the Scoring System Works
The indicator uses a **5-point confluence scoring system**. Each condition adds 1 point:
#### 🟢 Bullish Reversal Score (at VAL)
| Condition | Points | Description |
|-----------|--------|-------------|
| Price at VAL Zone | +1 | Price is within VAL ± 0.2 ATR |
| Bullish Candle | +1 | Close > Open (green candle) |
| RSI Oversold | +1 | RSI < 35 |
| Rejection Wick | +1 | Lower wick > 1.5× body size |
| Failed Breakdown | +1 | Touched below VAL but closed above |
#### 🔴 Bearish Reversal Score (at VAH)
| Condition | Points | Description |
|-----------|--------|-------------|
| Price at VAH Zone | +1 | Price is within VAH ± 0.2 ATR |
| Bearish Candle | +1 | Close < Open (red candle) |
| RSI Overbought | +1 | RSI > 65 |
| Rejection Wick | +1 | Upper wick > 1.5× body size |
| Failed Breakout | +1 | Touched above VAH but closed below |
### Signal Quality Ratings
| Score | Rating | Meaning |
|-------|--------|---------|
| 5/5 | ★★★ | Excellent - Highest probability |
| 4/5 | ★★ | Good - High probability |
| 3/5 | ★ | Acceptable - Moderate probability |
| <3 | - | No signal triggered |
---
## 📋 Info Table Explained
```
╔═ able-REV ═╗ 15 ████████ SCR
─────────────────────────────────────
ZONE UPPER VA ▒▒▓▓████ ▲
POC 4272.680 ██████·· ▲
VAH 4322.745 ████···· ·
VAL 4264.977 ██████·· ·
═ SCORE ═════════════════════════════
BULL 0/5 ········ ·
BEAR 1/5 ░······· ·
RSI 49 ▒▒▓▓···· ·
◄SIGNAL► WAIT ········ ·
```
| Row | Description |
|-----|-------------|
| **ZONE** | Current price position relative to Value Area |
| **POC/VAH/VAL** | Price levels with distance indicators |
| **BULL Score** | Current bullish confluence score |
| **BEAR Score** | Current bearish confluence score |
| **RSI** | RSI value with OB/OS status |
| **SIGNAL** | Current signal status (BUY/SELL/WAIT) |
### Zone Types
| Zone | Meaning | Bias |
|------|---------|------|
| ABOVE VAH | Price broke above resistance | Bullish (but watch for rejection) |
| ⚠ AT VAH | Price testing resistance | Watch for bearish reversal |
| UPPER VA | Price in upper value area | Slight bullish bias |
| LOWER VA | Price in lower value area | Slight bearish bias |
| ⚠ AT VAL | Price testing support | Watch for bullish reversal |
| BELOW VAL | Price broke below support | Bearish (but watch for rejection) |
---
## 📈 Trading Strategies
### Strategy 1: VAH Rejection (Bearish Reversal)
**Setup:**
1. Price approaches or touches VAH (red dashed line)
2. BEAR score reaches 3+ (or your minimum setting)
3. REV signal appears above the candle
**Entry:**
- Enter SHORT on signal candle close
- Or wait for confirmation candle
**Stop Loss:**
- Above the signal candle high
- Or above VAH + 0.5 ATR
**Take Profit:**
- First target: POC (yellow line)
- Second target: VAL (teal line)
---
### Strategy 2: VAL Bounce (Bullish Reversal)
**Setup:**
1. Price approaches or touches VAL (teal dashed line)
2. BULL score reaches 3+ (or your minimum setting)
3. REV signal appears below the candle
**Entry:**
- Enter LONG on signal candle close
- Or wait for confirmation candle
**Stop Loss:**
- Below the signal candle low
- Or below VAL - 0.5 ATR
**Take Profit:**
- First target: POC (yellow line)
- Second target: VAH (red line)
---
### Strategy 3: POC Bounce
**Setup:**
1. Price pulls back to POC after trending
2. POC acts as support/resistance
3. Watch for reversal candle patterns
**Entry:**
- Long if bullish candle at POC from below
- Short if bearish candle at POC from above
**Stop Loss:**
- Other side of POC ± buffer
---
## ⚠️ Important Notes
### When Signals Work Best
✅ **High Probability Setups:**
- Score 4-5 with clear rejection wick
- RSI confirms (oversold for long, overbought for short)
- First test of VAH/VAL in the session
- Clear trend before reversal
❌ **Low Probability Setups:**
- Score barely meeting minimum (3/5)
- Multiple tests of same level (level weakening)
- Low volume/choppy market
- News events pending
### Risk Management Rules
1. **Never risk more than 1-2% per trade**
2. **Always use stop loss** - place beyond the level
3. **Wait for candle close** - don't enter on wick touches
4. **Respect the cooldown** - avoid overtrading
5. **Consider the trend** - counter-trend reversals are riskier
---
## 🔔 Alerts
The indicator includes built-in alerts:
| Alert | Trigger |
|-------|---------|
| VAL Bullish Reversal | BULL score meets minimum at VAL |
| VAH Bearish Reversal | BEAR score meets minimum at VAH |
### Setting Up Alerts:
1. Right-click on the chart
2. Select "Add Alert"
3. Choose "able FRVP Reversal" as condition
4. Select desired alert type
5. Configure notification method
---
## 💡 Pro Tips
1. **Combine with trend analysis** - Reversals in trend direction are more reliable
2. **Watch for confluence with other S/R** - If VAH/VAL aligns with round numbers, previous highs/lows, or fib levels, the level is stronger
3. **Volume confirmation** - Higher volume on reversal candle = stronger signal
4. **Time of day matters** - Reversals during active trading hours are more reliable
5. **Adjust sensitivity by market** - Volatile assets may need higher Min Confluence Score
6. **Use multiple timeframes** - Check if reversal level aligns with higher timeframe levels
---
## 🔧 Recommended Settings by Trading Style
| Style | Min Confluence | Cooldown | Best For |
|-------|----------------|----------|----------|
| Scalping | 3 | 5-7 | Quick trades, more signals |
| Day Trading | 3-4 | 10-15 | Balanced approach |
| Swing Trading | 4-5 | 20+ | Fewer, higher quality signals |
---
## ❓ Troubleshooting
| Issue | Solution |
|-------|----------|
| No signals appearing | Lower Min Confluence Score or check if market is ranging |
| Too many signals | Increase Min Confluence Score or Cooldown Bars |
| Levels not showing | Enable Show POC/VAH/VAL in settings |
| Histogram too wide/narrow | Adjust Profile Width setting |
---
## 📞 Support
For questions, suggestions, or bug reports, please contact the developer.
---
**Version:** 1.0
**Last Updated:** 2024
**Platform:** TradingView (Pine Script v6)

MACD Nexus Pro [OXE]MACD Nexus Pro
Institutional-Grade Momentum Intelligence System
Transform How You Read Market Momentum
Standard MACD indicators show you what happened. MACD Nexus Pro shows you what's about to happen.
Built for serious traders who demand more than basic crossovers, this indicator combines 8 proprietary analysis engines into one powerful momentum intelligence system. Whether you trade forex, crypto, stocks, or commodities — MACD Nexus Pro gives you the institutional edge.
What Makes This Different?
Most MACD indicators are stuck in the 1970s. They show you two lines, a histogram, and leave you guessing. MACD Nexus Pro was engineered from the ground up to answer the questions professional traders actually ask:
"Is this signal confirmed across multiple timeframes?"
"Is this momentum move real or a fake-out?"
"Are smart money players accumulating or distributing?"
"Is this trend exhausted or just getting started?"
Core Benefits for Traders
🎯 Eliminate False Signals with MTF Confluence
Stop getting chopped up by single-timeframe noise. The Multi-Timeframe Confluence Matrix scans 4 timeframes simultaneously and calculates a unified alignment score from -5 to +5.
How it helps you:
Only take trades when multiple timeframes agree
See instantly if higher timeframes support your entry
Avoid counter-trend trades that fail 80% of the time
Build confidence knowing the "big picture" backs your trade
📊 Know Your Market Regime Instantly
Markets behave differently in trending vs ranging conditions. The Regime Detection Engine automatically classifies current conditions as TRENDING, VOLATILE, RANGING, or NEUTRAL.
How it helps you:
Adjust your strategy to match market conditions
Avoid momentum trades in choppy, ranging markets
Capitalize on trending markets with confidence
Stop forcing trades when conditions don't favor your style
🔄 Catch Reversals Early with Smart Divergence Detection
Divergences signal potential reversals before they happen — but spotting them manually is tedious and error-prone. The Divergence Engine automatically detects both Regular and Hidden divergences, then rates their strength.
How it helps you:
Get early warning of trend exhaustion
Find high-probability reversal entries
Use Hidden divergences for trend continuation trades
Prioritize strong divergences (★★★★) over weak ones
🏦 Trade Alongside Smart Money
Institutional players leave footprints. The Smart Money Momentum Zones detect when volume-weighted momentum enters extreme territory — signaling potential accumulation (buying) or distribution (selling) by large players.
How it helps you:
Identify where institutions are likely positioning
Buy in accumulation zones with smart money
Sell or short in distribution zones
Avoid buying into institutional selling
⚡ Distinguish Impulse Moves from Corrections
Not all momentum is created equal. The Impulse Wave Detection system identifies whether current momentum is an impulse (strong, directional) or a correction (weak, counter-trend).
How it helps you:
Enter on impulses, not corrections
Hold winners through corrections without panic
Recognize when a trend is resuming
Time entries at the start of new momentum waves
📍 Never Miss True Equilibrium
Static zero lines are outdated. The Dynamic Zero Line adapts to the market's true momentum equilibrium, shifting based on long-term bias.
How it helps you:
Understand the market's real neutral point
Recognize bullish/bearish bias at a glance
Better time zero-line crossover trades
Filter signals based on positioning above/below equilibrium
⚠️ Get Warned Before Momentum Dies
Chasing extended moves is how traders lose money. The Momentum Exhaustion Detector calculates the thrust-to-follow-through ratio and warns you when momentum is overextended.
How it helps you:
Avoid late entries into tired trends
Take profits before reversals hit
Spot when bulls/bears are running out of steam
Stay patient for better entries after exhaustion
🌈 Read Momentum Strength at a Glance
The Gradient Histogram Heatmap shows momentum acceleration through color intensity — brighter colors mean momentum is building, faded colors mean it's dying.
How it helps you:
Instantly see if momentum is accelerating or fading
Confirm breakouts with strengthening momentum
Spot weakening moves before price confirms
Make faster decisions with visual clarity
The Signal System You Can Trust
Every buy/sell signal comes with a Star Rating (★ to ★★★★★) based on:
Multi-timeframe alignment
Position relative to dynamic zero
Market regime confirmation
Volume confirmation
Exhaustion status
Choose your signal mode:
Standard: Classic MACD crossovers
Confluence: Only signals with MTF agreement (recommended)
Aggressive: Early entries with directional confluence
All signals are 100% non-repainting — what you see is what happened, permanently.
Two Professional Dashboards
MTF Confluence Panel (Top-Right)
TimeframeTrendAbove ZeroCurrent▲/▼✓/✗15min▲/▼✓/✗1H▲/▼✓/✗4H▲/▼✓/✗Daily▲/▼✓/✗
Nexus Status Panel (Bottom-Right)
Regime: TRENDING / VOLATILE / RANGING / NEUTRAL
Confluence: Net score (-5 to +5)
Zone: ACCUMULATION / DISTRIBUTION / NEUTRAL
Momentum: IMPULSE / CORRECTION / NORMAL
Exhaustion: BULL TIRED / BEAR TIRED / OK
Built-In Alerts
Never miss a trade. Set alerts for:
✅ Buy/Sell signals
✅ High-confluence signals (4+ stars)
✅ Momentum exhaustion warnings
✅ Impulse wave starts
✅ Zero line crosses
✅ Bullish/Bearish divergences
Who Is This For?
✓ Day Traders — Filter noise with MTF confluence, catch impulse moves early
✓ Swing Traders — Ride trends confidently with regime detection and exhaustion warnings
✓ Scalpers — Use aggressive mode with volume-confirmed signals
✓ Position Traders — Align with smart money accumulation/distribution zones
✓ Crypto Traders — Essential for volatile markets where exhaustion detection saves accounts
✓ Forex Traders — Multi-session momentum tracking across timeframes
What Traders Are Saying
"Finally, a MACD that tells me more than just 'line crossed line.' The exhaustion warnings alone have saved me from so many bad trades."
"The MTF confluence is a game-changer. I only trade 4+ star setups now and my win rate has never been better."
"I love how the regime detection stops me from forcing momentum trades in ranging markets. Should have had this years ago."
Summary: Your Edge in 8 Features
FeatureWhat It DoesYour BenefitMTF ConfluenceScans 4 timeframesHigher probability entriesRegime DetectionClassifies market conditionsRight strategy, right timeDivergence EngineFinds reversal signalsCatch turns earlySmart Money ZonesDetects institutional activityTrade with the big playersImpulse DetectionIdentifies momentum qualityEnter on strength, not weaknessDynamic Zero LineAdapts to market biasTrue equilibrium referenceExhaustion DetectorWarns of tired momentumAvoid late, losing tradesGradient HistogramShows acceleration visuallyInstant momentum read
Settings Overview
Fully customizable for any trading style:
MACD lengths (Fast/Slow/Signal)
4 MTF timeframes
Divergence sensitivity
Regime detection parameters
Signal mode selection
Minimum confluence threshold
Zone thresholds
Visual colors and toggles
Risk Disclaimer
No indicator guarantees profits. MACD Nexus Pro is a decision-support tool designed to improve your analysis — not replace sound risk management. Always use stop losses and never risk more than you can afford to lose.
Upgrade Your Momentum Analysis Today
Stop guessing. Start trading with institutional-grade momentum intelligence.
MACD Nexus Pro — See Momentum Differently.

Critical Advanced Multi-Divergence Dashboard
Complete Dashboard Interpretation Guide
Dashboard Metrics Explained
1. Timeframe
What it shows: Current chart timeframe (15m, 1H, 4H, 1D, etc.)
How to interpret:
The script auto-detects your chart timeframe
Higher timeframes (4H, 1D) = more reliable signals but fewer trades
Lower timeframes (5m, 15m) = more signals but higher noise
Best practice: Use multiple timeframes - get signal on 1H, confirm on 15m for entry
2. Signal Bias: BULLISH / BEARISH / NEUTRAL
What it shows: Overall market direction based on divergence consensus
Color coding:
🟢 BULLISH (Green) = Net strength > +10 → Expect upward move
🔴 BEARISH (Red) = Net strength < -10 → Expect downward move
⚪ NEUTRAL (Gray) = Net strength between -10 to +10 → No clear direction
How to interpret:
BULLISH: Multiple bullish divergences detected → Look for LONG entries
BEARISH: Multiple bearish divergences detected → Look for SHORT entries
NEUTRAL: Conflicting signals or weak divergences → WAIT, don't trade
Trading Action:
BULLISH + Strength > 60 = Strong BUY signal
BEARISH + Strength > 60 = Strong SELL signal
NEUTRAL = Stay out, wait for clarity
3. Signal Strength: 0-100
What it shows: Quantified power of the divergence signal
Strength Scale:
🔴 0-30 (Red): Weak signal → Don't trade
🟠 31-60 (Orange): Moderate signal → Trade with caution, reduce position size
🟢 61-100 (Green): Strong signal → High confidence trade
Calculation factors:
Number of divergences detected
Volume confirmation (1.3x multiplier if high volume)
Trend filter (ADX reduces counter-trend signals by 40%)
Weighted scoring (volume-based indicators get 1.5x weight)
How to use:
Strength > 70 + ADX < 20 = Best reversal trades
Strength > 60 + Volume HIGH = Excellent entry
Strength < 40 = Skip the trade
Example Scenarios:
Strength = 85 → Take full position size
Strength = 55 → Take 50% position, tight stop loss
Strength = 25 → No trade, wait for better setup
4. Quality Score: 0-100
What it shows: Overall reliability and confidence rating
Components (max 100 points):
Divergence count (40 points): More indicators confirming = higher quality
Volume confirmation (20 points): High volume adds 20, normal adds 10
Trend alignment (20 points): Signal aligning with trend = 20, against trend but weak ADX = 15
Detection timing (20 points): Confirmed signals = 20, early detection = 15
Quality Tiers:
80-100: Excellent - High probability setup
60-79: Good - Tradeable with proper risk management
40-59: Fair - Only for experienced traders
Below 40: Poor - Avoid trading
How to use:
Quality > 75 + Strength > 60 = Grade A setup
Quality > 60 + Strength > 50 = Grade B setup (reduce size)
Quality < 50 = Don't trade regardless of strength
5. Bullish Divs: 3R/2H (Example)
What it shows: Count of bullish divergences detected
R = Regular divergences (price LL, indicator HL)
H = Hidden divergences (price HL, indicator LL)
Interpretation:
Regular divergences = Reversal signals (more important)
Hidden divergences = Continuation signals (trend confirmation)
Examples:
4R/1H → Strong bullish reversal expected
1R/3H → Bullish trend continuation likely
5R/0H → Very strong reversal setup
Trading Logic:
High R count = Look for trend reversal
High H count = Trend is strong, look for pullback entries
R+H both high = Very strong signal, major move expected
6. Bearish Divs: 2R/1H (Example)
Same logic as Bullish Divs but for downside:
2R/1H → Moderate bearish reversal setup
0R/4H → Strong downtrend continuation
4R/3H → Extremely strong bearish signal
7. ADX (Trend): 35
What it shows: Average Directional Index - measures trend strength
ADX Scale:
0-20: Weak or no trend → Range-bound market
20-25: Emerging trend → Early trend formation
25-50: Strong trend → Trend is established
50-75: Very strong trend → Major directional move
75+: Extremely strong trend → Parabolic move, be cautious
Color Coding:
🟠 Orange (ADX > threshold): Strong trending market
⚪ Gray (ADX < threshold): Weak trend/ranging
How to interpret:
ADX < 20 + BULLISH Signal = Best for reversal trades (range breakout)
ADX > 25 + BEARISH Signal = Counter-trend, risky (signal strength reduced 40%)
ADX > 40 + Signal against trend = Dangerous, skip
ADX < 20 + High Strength = Perfect reversal setup
Trading Examples:
ADX = 15, BULLISH strength 75 → Perfect buy at bottom
ADX = 45, BEARISH strength 60 → Caution: Market in strong uptrend, bearish signal gets discounted
ADX = 50, BULLISH strength 80 → Trend continuation: Pullback in uptrend, good long entry
8. Volume: HIGH / Normal
What it shows: Current volume vs 20-period moving average
Volume Status:
🟡 HIGH (Yellow): Volume > 1.5x average → Signal multiplied by 1.3x
⚪ Normal (Gray): Volume ≤ 1.5x average → Signal multiplied by 0.8x
Why it matters:
High volume = More participation = More reliable signal
Normal/low volume = Weak conviction = Less reliable
Trading Rules:
HIGH volume + Strong signal = Take trade immediately
Normal volume + Strong signal = Wait for volume confirmation
HIGH volume + Weak signal = Still tradable (volume validates)
Normal volume + Weak signal = Definitely skip
Example:
Strength 50 + HIGH volume → Effective strength = 65 (tradable)
Strength 50 + Normal volume → Effective strength = 40 (skip)
9. Volatility: 2.35%
What it shows: ATR (Average True Range) as percentage of price
Volatility Scale:
< 1%: Very low volatility → Tight ranges, breakout coming
1-2%: Normal volatility → Standard market conditions
2-3%: Elevated volatility → Bigger moves expected
> 3%: High volatility → Large swings, wider stops needed
How to use:
Low volatility (< 1%) = Tighten stops, smaller targets
Normal (1-2%) = Standard position sizing
High (> 3%) = Reduce position size, wider stops
Impact on trading:
High volatility → Script auto-adjusts pivot periods (better divergence detection)
Stop loss placement: Use ATR × 2 for stop distance
Position sizing: Reduce size in high volatility
10. Detection: EARLY / Confirmed
What it shows: Whether signal detected before or after pivot confirmation
Detection Modes:
🟡 EARLY (Yellow): Signal detected before pivot confirms → Earlier entry but slightly less reliable
🟢 Confirmed (Green): Signal after pivot confirmation → More reliable but later entry
Trade-off:
EARLY mode:
+ Enter 2-5 bars earlier
+ Better risk/reward ratio
- 10-15% more false signals
Confirmed mode:
+ Higher reliability
+ Better for conservative traders
- May miss 10-20% of move
How to use:
Aggressive traders: Use EARLY mode + higher quality threshold (>70)
Conservative traders: Use Confirmed mode + moderate quality (>60)
🎯 Complete Trading Decision Matrix
STRONG BUY Signal ✅
Signal Bias: BULLISH
Signal Strength: > 70
Quality Score: > 75
Bullish Divs: ≥ 3 (preferably high R count)
ADX: < 25 (weak trend/reversal) OR > 30 with DI+ > DI-
Volume: HIGH
Action: Enter LONG with full position
STRONG SELL Signal ✅
Signal Bias: BEARISH
Signal Strength: > 70
Quality Score: > 75
Bearish Divs: ≥ 3 (preferably high R count)
ADX: < 25 (weak trend/reversal) OR > 30 with DI- > DI+
Volume: HIGH
Action: Enter SHORT with full position
Moderate Trade ⚠️
Signal Strength: 50-70
Quality Score: 60-75
Volume: Normal
Action: Enter with 50% position size, tight stop loss
NO TRADE ❌
Signal Bias: NEUTRAL
Signal Strength: < 50
Quality Score: < 60
ADX: > 40 (signal against strong trend)
Volume: Normal + Strength < 50
Action: Stay out, wait for better setup
📊 Real Trading Examples
Example 1: Perfect Bullish Setup
Timeframe: 1H
Signal Bias: BULLISH 🟢
Signal Strength: 82/100 🟢
Quality Score: 88/100
Bullish Divs: 5R/2H (excellent)
Bearish Divs: 0R/0H
ADX: 18 (weak trend, perfect for reversal)
Volume: HIGH 🟡
Volatility: 1.8%
Detection: EARLY 🟡
INTERPRETATION: Grade A+ setup
- Strong bullish consensus (5 regular divergences)
- Low ADX = perfect reversal condition
- High volume confirms the signal
- Quality 88 = highly reliable
ACTION:
✅ Enter LONG immediately with full position
✅ Stop loss: 2 × ATR below entry (3.6%)
✅ Target: Previous swing high or 2:1 R/R
Example 2: Risky Counter-Trend Signal
Timeframe: 15m
Signal Bias: BEARISH 🔴
Signal Strength: 55/100 🟠
Quality Score: 62/100
Bearish Divs: 2R/1H
ADX: 45 (very strong uptrend)
Volume: Normal
Detection: EARLY
INTERPRETATION: Dangerous setup
- ADX 45 = strong uptrend in place
- Bearish signal is counter-trend
- Script already reduced strength by 40%
- Moderate quality, normal volume
ACTION:
❌ SKIP this trade
⏸️ Wait for ADX to drop below 25
⏸️ Or wait for bearish strength > 70 with HIGH volume
Example 3: Wait and Watch
Signal Bias: NEUTRAL ⚪
Signal Strength: 35/100 🔴
Quality Score: 48/100
Bullish Divs: 1R/1H
Bearish Divs: 1R/0H
ADX: 22
Volume: Normal
INTERPRETATION: Conflicting signals
- Both bullish and bearish divergences present
- Low strength and quality
- No clear direction
ACTION:
⏸️ Don't trade - wait for clarity
👀 Watch for one side to dominate
📊 Check higher timeframe for context
🎓 Pro Tips for Dashboard Reading
Check Multiple Timeframes:
Signal on 4H + confirmation on 1H = Best trades
Higher TF gives direction, lower TF gives entry
Volume is King:
Never ignore HIGH volume signals (even if strength is moderate)
Be extra cautious with normal volume + weak signals
ADX Context Matters:
ADX < 20 + Divergence = Reversal opportunity
ADX > 40 + Counter-trend divergence = Dangerous
Quality Over Strength:
Quality 80 + Strength 60 > Quality 50 + Strength 80
High quality ensures the signal is real, not noise
Regular vs Hidden Divergences:
High R count = Reversal expected (more important)
High H count = Continuation (use for re-entries)
Early Detection Trade-off:
Use EARLY for swing trading (better R/R)
Use Confirmed for day trading (higher accuracy)
⚡ Quick Decision Flowchart
Step 1: Check Signal Bias
├─ NEUTRAL? → ❌ Don't trade
└─ BULLISH/BEARISH? → Continue
Step 2: Check Signal Strength
├─ < 50? → ❌ Don't trade
├─ 50-60? → Reduce position 50%
└─ > 60? → Continue
Step 3: Check Quality Score
├─ < 60? → ❌ Don't trade
└─ ≥ 60? → Continue
Step 4: Check ADX
├─ > 40 AND counter-trend? → ❌ Don't trade
└─ < 40 OR with-trend? → Continue
Step 5: Check Volume
├─ HIGH → ✅ Take trade (boost confidence)
└─ Normal → Check if strength > 60, then ✅ trade
Step 6: Position Sizing
├─ Strength > 70 + Quality > 75 → 100% position
├─ Strength 60-70 + Quality 60-75 → 75% position
└─ Strength 50-60 + Quality 60-70 → 50% position
This dashboard gives you a complete edge in divergence trading by quantifying what was previously subjective! 🚀
Only for Educational purpose

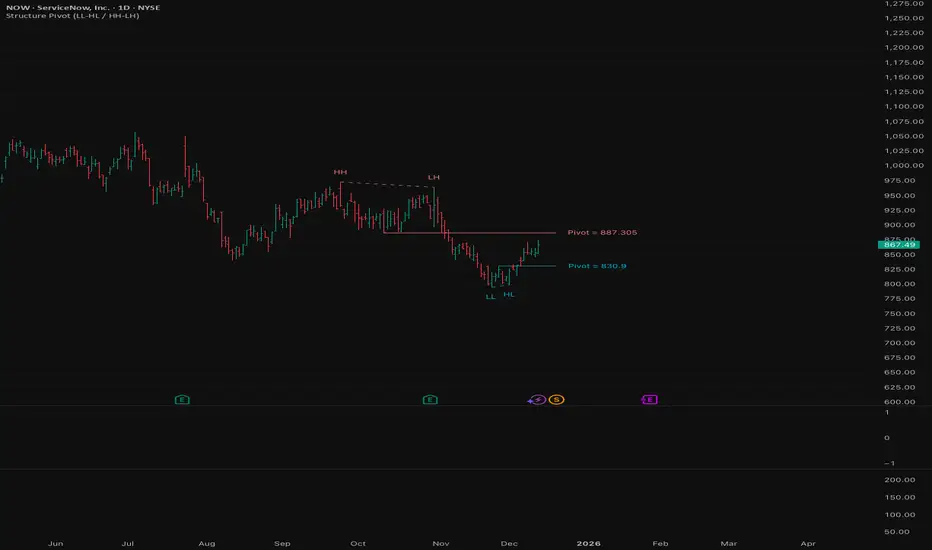
Structure Pivot (LL-HL / HH-LH)Structure Pivot (LL-HL / HH-LH) - Indicator Guide
This indicator scans for market structure pivot patterns—specifically the bullish Higher Low (LL–HL) and the bearish Lower High (HH–LH) —across multiple lengths simultaneously.
It automatically selects the most optimal pattern based on a "Priority Mode" and plots the structure and breakout/breakdown levels on the chart.
1. Basic Calculation Method
The indicator builds upon TradingView’s ta.pivotlow and ta.pivothigh functions to identify structural points.
Bullish Structure (LL–HL)
1.LL (Lowest Low): A standard Pivot Low is identified.
2.HL (Higher Low): A subsequent Pivot Low forms higher than the previous LL. This completes the setup.
3.Pivot Line (Resistance): The indicator finds the highest price (High) that occurred between the LL and the HL. This level becomes the breakout trigger.
Bearish Structure (HH–LH)
1.HH (Highest High): A standard Pivot High is identified.
2.LH (Lower High): A subsequent Pivot High forms lower than the previous HH. This completes the setup.
3.Pivot Line (Support): The indicator finds the lowest price (Low) that occurred between the HH and the LH. This level becomes the breakdown trigger.
2. Multi-Length Scanning
Unlike standard indicators that use a single fixed length (e.g., Length = 5), this indicator scans a range of lengths simultaneously.
・Settings: Defined by Min Length and Max Length.
・Mechanism: If set to Min=2 and Max=10, the indicator internally runs 9 separate calculations (Length 2 through 10) in parallel.
This allows it to capture everything from small, short-term pullbacks to larger, significant structural pivots without manual adjustment.
3. Priority Mode System
Since multiple lengths are scanned, multiple valid patterns may appear at the same time. The Priority Mode determines which single pattern is the "winner" and gets displayed.
A. Tightest Structure (Default)
・For Bullish (Long): Selects the pattern with the lowest Pivot Line (Resistance).
・For Bearish (Short): Selects the pattern with the highest Pivot Line (Support).
・Advantage: It finds the "tightest" contraction (like a VCP). This offers the entry point closest to the stop-loss level, providing the best Risk/Reward ratio.
B. Longest Length
・Selects the pattern detected by the longest length setting.
・Advantage: Focuses on major structural points, filtering out short-term noise. Best for trend confirmation.
C. Shortest Length
・Selects the pattern detected by the shortest length setting.
・Advantage: Extremely sensitive. Best for scalping or catching immediate micro-pullbacks.
4. Real-Time Logic & Features
Structure Invalidation (Failure)
・Bullish: If the current price drops below the HL (the support of the structure), the setup is considered failed.
・Bearish: If the current price rises above the LH (the resistance of the structure), the setup is considered failed.
・Result: All lines and labels for that structure are immediately deleted to keep the chart clean.
Pivot Line Extension
・As long as the structure remains valid (price hasn't violated the HL or LH), the Pivot Line extends to the right, acting as a live reference for breakouts or breakdowns.
Alerts
・Bullish Breakout: Triggered when the Close price crosses over the Pivot Line.
・Bearish Breakdown: Triggered when the Close price crosses under the Pivot Line.