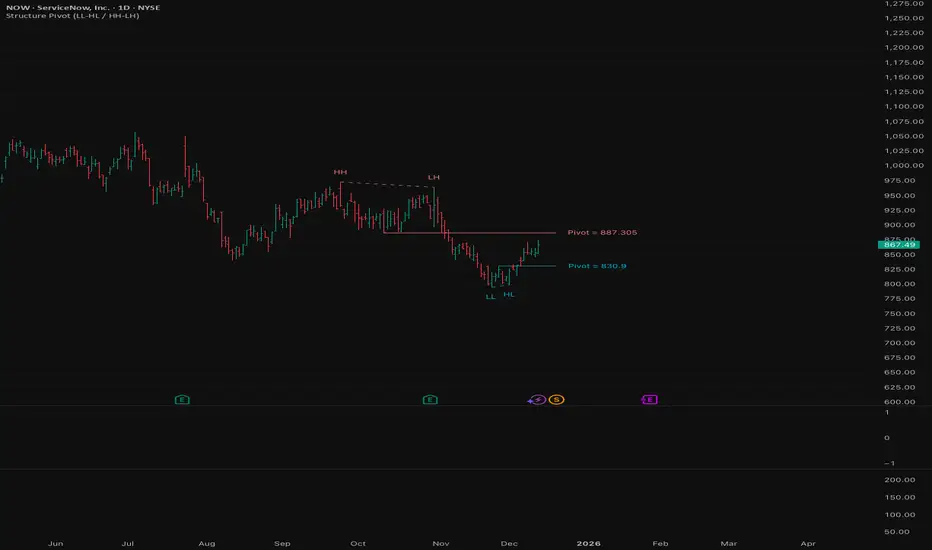
Structure Pivot (LL-HL / HH-LH)Structure Pivot (LL-HL / HH-LH) - Indicator Guide
This indicator scans for market structure pivot patterns—specifically the bullish Higher Low (LL–HL) and the bearish Lower High (HH–LH) —across multiple lengths simultaneously.
It automatically selects the most optimal pattern based on a "Priority Mode" and plots the structure and breakout/breakdown levels on the chart.
1. Basic Calculation Method
The indicator builds upon TradingView’s ta.pivotlow and ta.pivothigh functions to identify structural points.
Bullish Structure (LL–HL)
1.LL (Lowest Low): A standard Pivot Low is identified.
2.HL (Higher Low): A subsequent Pivot Low forms higher than the previous LL. This completes the setup.
3.Pivot Line (Resistance): The indicator finds the highest price (High) that occurred between the LL and the HL. This level becomes the breakout trigger.
Bearish Structure (HH–LH)
1.HH (Highest High): A standard Pivot High is identified.
2.LH (Lower High): A subsequent Pivot High forms lower than the previous HH. This completes the setup.
3.Pivot Line (Support): The indicator finds the lowest price (Low) that occurred between the HH and the LH. This level becomes the breakdown trigger.
2. Multi-Length Scanning
Unlike standard indicators that use a single fixed length (e.g., Length = 5), this indicator scans a range of lengths simultaneously.
・Settings: Defined by Min Length and Max Length.
・Mechanism: If set to Min=2 and Max=10, the indicator internally runs 9 separate calculations (Length 2 through 10) in parallel.
This allows it to capture everything from small, short-term pullbacks to larger, significant structural pivots without manual adjustment.
3. Priority Mode System
Since multiple lengths are scanned, multiple valid patterns may appear at the same time. The Priority Mode determines which single pattern is the "winner" and gets displayed.
A. Tightest Structure (Default)
・For Bullish (Long): Selects the pattern with the lowest Pivot Line (Resistance).
・For Bearish (Short): Selects the pattern with the highest Pivot Line (Support).
・Advantage: It finds the "tightest" contraction (like a VCP). This offers the entry point closest to the stop-loss level, providing the best Risk/Reward ratio.
B. Longest Length
・Selects the pattern detected by the longest length setting.
・Advantage: Focuses on major structural points, filtering out short-term noise. Best for trend confirmation.
C. Shortest Length
・Selects the pattern detected by the shortest length setting.
・Advantage: Extremely sensitive. Best for scalping or catching immediate micro-pullbacks.
4. Real-Time Logic & Features
Structure Invalidation (Failure)
・Bullish: If the current price drops below the HL (the support of the structure), the setup is considered failed.
・Bearish: If the current price rises above the LH (the resistance of the structure), the setup is considered failed.
・Result: All lines and labels for that structure are immediately deleted to keep the chart clean.
Pivot Line Extension
・As long as the structure remains valid (price hasn't violated the HL or LH), the Pivot Line extends to the right, acting as a live reference for breakouts or breakdowns.
Alerts
・Bullish Breakout: Triggered when the Close price crosses over the Pivot Line.
・Bearish Breakdown: Triggered when the Close price crosses under the Pivot Line.
Cari dalam skrip untuk "bear"
King OscillatorKing Oscillator is a streamlined, non-overlay indicator designed to capture bullish momentum and bear-pressure via:
A normalized Heikin-Ashi-based tradeable trend filter
A fast-reacting custom MA variant
EMA oscillators, each scaled for cross-timeframe consistency
A bear-pressure line (blend of intrabar and group-range bears)
Combined Volume Flow and Price vs. VWAP oscillators

ICT Breaker Blocks [Exponential-X]🔄 Breaker Blocks
Overview
Breaker Blocks automatically identifies failed order blocks that have reversed their polarity. When an order block gets broken, it often becomes a powerful support or resistance zone in the opposite direction. This indicator tracks these institutional "flips" based on ICT (Inner Circle Trader) concepts, helping identify where price is likely to find strong support or resistance after a structural break.
━━━━━━━━━━━━━━━━━━━━━━━━━━━━
🎯 What This Indicator Does
Detects Breaker Blocks:
• 🔵 Bullish Breaker Blocks (BB+) - Failed bearish order blocks that became support
• 🟣 Bearish Breaker Blocks (BB-) - Failed bullish order blocks that became resistance
• Tracks order blocks first, then monitors when they break
• Converts broken order blocks into breaker blocks automatically
• Shows when breakers get tested by price
How Breakers Form:
1. Order block forms (last opposite candle before strong move)
2. Price returns and breaks through the order block
3. Broken order block becomes a breaker block with flipped polarity
4. Old resistance becomes new support (or vice versa)
Visual Display: Smart Features:
• Auto-timeframe adjustment for optimal detection
• ATR-based strength filtering
• Active block highlighting
• Test tracking
• Distance calculator
• Duplicate prevention
━━━━━━━━━━━━━━━━━━━━━━━━━━━━
📚 Understanding Breaker Blocks
What Are Breaker Blocks?
Breaker blocks are failed order blocks that price has broken through. In ICT methodology:
• When institutions place orders creating an order block
• If that level fails and price breaks through
• The zone often becomes strong support/resistance in the opposite direction
• This represents institutional position flipping
Why Breakers Form:
• Failed Defense: Institutions couldn't defend the original level
• Position Flip: Institutions reversed their position
• Stop Hunt Complete: After sweeping stops, new levels form
• Polarity Change: Old resistance becomes new support (or vice versa)
Key Difference From Order Blocks: [/b>
• Order Block: Original institutional level (unbroken)
• Breaker Block: Failed order block that flipped polarity
• Breakers often provide STRONGER reactions than original OBs
• Represents where institutions changed their strategy
━━━━━━━━━━━━━━━━━━━━━━━━━━━━
🔵 Bullish Breaker Blocks Explained
Formation Process:
1. Step 1: Bearish order block forms (last bullish candle before drop)
2. Step 2: Price breaks ABOVE this bearish OB
3. Step 3: The broken bearish OB becomes a bullish breaker
4. Step 4: Now acts as SUPPORT when price returns
What It Means:
• Old resistance level failed
• Institutions flipped from selling to buying
• When price returns, zone acts as strong support
• Higher probability long setup than regular support
Trading Bullish Breakers:
Entry Setup:
• Wait for price to retrace back to bullish breaker
• Look for rejection/bounce from the breaker zone
• Enter long when price respects the breaker as support
• Stop loss: Below the breaker block
• Target: Recent high or opposite breaker
Why It Works:
Failed resistance becoming support is a strong technical signal indicating structural change in market sentiment.
━━━━━━━━━━━━━━━━━━━━━━━━━━━━
🟣 Bearish Breaker Blocks Explained
Formation Process:
1. Step 1: Bullish order block forms (last bearish candle before rally)
2. Step 2: Price breaks BELOW this bullish OB
3. Step 3: The broken bullish OB becomes a bearish breaker
4. Step 4: Now acts as RESISTANCE when price returns
What It Means:
• Old support level failed
• Institutions flipped from buying to selling
• When price returns, zone acts as strong resistance
• Higher probability short setup than regular resistance
Trading Bearish Breakers:
Entry Setup:
• Wait for price to retrace back to bearish breaker
• Look for rejection/reversal from the breaker zone
• Enter short when price respects the breaker as resistance
• Stop loss: Above the breaker block
• Target: Recent low or opposite breaker
Why It Works:
Failed support becoming resistance indicates structural change and often leads to continuation moves.
━━━━━━━━━━━━━━━━━━━━━━━━━━━━
📊 How To Use This Indicator
Strategy 1: Breaker Block Retest
Timeframes: 15min, 1H, 4H
Style: [/b> Swing trading, reversal entries
Rules:
1. Identify active breaker block (bright color, not gray)
2. Wait for price to return to the breaker zone
3. Look for reversal confirmation (pin bar, engulfing, rejection)
4. Enter in the direction the breaker suggests
5. Stop: Beyond opposite side of breaker
6. Target: 2-3R or previous structure
Example - Bullish Breaker:
• Bullish breaker at $48,000-$48,500
• Price drops to $48,200 (enters breaker)
• Bullish pin bar forms
• Enter long at $48,600, stop at $47,800
• Target: $50,000+
Strategy 2: Multi-Timeframe Breakers
Timeframes: Combine 1H + 4H or 15min + 1H
Style: [/b> High-probability setups
Rules:
1. Identify breaker on higher timeframe (4H or Daily)
2. Switch to lower timeframe (1H or 15min)
3. Look for lower TF breaker WITHIN higher TF breaker
4. Trade the lower TF breaker in same direction as HTF
5. Stop: Below lower TF breaker
6. Target: Edge of higher TF breaker or beyond
Why It Works: Alignment across timeframes increases probability
Strategy 3: Breaker + Order Block Confluence
Timeframes: 1H, 4H
Style: High-conviction trades
Rules:
1. Find breaker block that overlaps with fresh order block
2. This creates double institutional zone
3. Wait for price to reach confluence area
4. Enter on first touch with confirmation
5. Stop: Beyond confluence zone
6. Target: 3-5R
Why It Works: Two ICT concepts aligned = maximum probability
Strategy 4: Breaker Breakout
Timeframes: [/b> 5min, 15min, 1H
Style: Trend continuation
Rules:
1. Price approaches breaker block
2. Instead of respecting it, price breaks THROUGH
3. This indicates very strong momentum
4. Enter breakout in direction of break
5. Stop: Back inside the breaker
6. Target: 2-3R
Why It Works: When breakers fail, momentum is extremely strong
━━━━━━━━━━━━━━━━━━━━━━━━━━━━
⚙️ Settings Explained
Core Settings
Auto-Adjust for Timeframe (Default: ON)
• Automatically optimizes detection for current chart
• 1min: 3 bars lookback
• 5min: 4 bars lookback
• 15min: 5 bars lookback
• 1H: 6 bars lookback
• 4H+: 8-12 bars lookback
• Recommended: Keep ON
Manual Detection Length (Default: 5)
• Only used when Auto-Adjust is OFF
• Lookback period for finding order blocks
• Lower = more sensitive
• Higher = more selective
Display Settings
Show Bullish/Bearish Breaker Blocks
• Toggle each type independently
• Customize colors (default: cyan and fuchsia)
• Tip: Use colors that stand out from order blocks
Max Breaker Blocks to Display (Default: 10) [/b>
• Limits visible breakers
• Lower (5-8): Cleaner chart
• Higher (15-30): More context
• Recommended: 10-15
Show Breaker Block Labels [/b>
• Displays BB+ and BB- text
• Shows 🎯 on active (nearest) breaker
• Turn OFF for minimal appearance
Extend Blocks (bars) (Default: 50)
• How far to extend boxes to the right
• Recommended: 40-60 bars
Filters
Block Strength Filter (Default: Medium)
• Low: 0.5x ATR - More breakers, more noise
• Medium: 1x ATR - Balanced
• High: 1.5x ATR - Only strongest breakers
• Note: Breakers are naturally less common than OBs
• For learning: Use Low to see more examples
• For trading: Use Medium or High
Min Block Size % (Default: 0.1)
• Minimum breaker size as % of price
• Filters tiny insignificant blocks
• Adjust based on instrument volatility
Advanced
Show Tested Blocks (Default: OFF) [/b>
• When ON: Shows gray boxes for tested breakers
• When OFF: Breakers disappear after test
• Use ON: For learning and analysis
• Use OFF: For clean active trading
Highlight Active Block (Default: ON)
• Highlights nearest breaker to current price
• Active block shown with brighter color and 🎯
• Recommended: Keep ON
━━━━━━━━━━━━━━━━━━━━━━━━━━━━
📱 Info Panel Guide
Bullish BB Count Bearish BB Count
• Number of active (untested) bearish breaker blocks
• More bearish breakers = More resistance zones above
Bias Indicator [/b>
• ⬆ Bullish: More bullish breakers (support > resistance)
• ⬇ Bearish: More bearish breakers (resistance > support)
• ↔ Neutral: Equal breakers on both sides
Near Indicator
• Shows nearest active breaker and distance
• Example: "Bull BB -1.5%" = Bullish breaker 1.5% below price
━━━━━━━━━━━━━━━━━━━━━━━━━━━━
📱 Alert Setup
This indicator includes 2 alert types:
1. Price Entering Bullish Breaker [/b>
• Fires when price touches bullish breaker block
• Action: Watch for bounce/support
2. Price Entering Bearish Breaker
• Fires when price touches bearish breaker block
• Action: Watch for rejection/resistance
To Set Up Alerts:
1. Click "Alert" button (clock icon)
2. Select "Breaker Blocks"
3. Choose alert type
4. Configure notifications
5. Click "Create"
━━━━━━━━━━━━━━━━━━━━━━━━━━━━
💎 Pro Tips & Best Practices
✅ DO:
• Wait for confirmation before entering at breakers
• First touch of breaker has highest reliability
• Use breakers with trend direction for best results
• Combine with order blocks and FVGs for confluence
• Check multiple timeframes for breaker alignment
• Respect breakers - they're stronger than regular S/R
• Use proper stop placement beyond the breaker
⚠️ DON'T:
• Don't trade every breaker - quality over quantity
• Don't ignore breaker breaks - very strong momentum signal
• Don't use tight stops - allow room for wicks
• Don't expect all breakers to hold
• Don't trade against strong momentum through breakers
• Don't confuse breakers with regular order blocks
🎯 Best Timeframes:
• Scalping: 5min, 15min (quick breaker tests)
• Day Trading: 15min, 1H (balanced)
• Swing Trading: 1H, 4H, Daily (major breakers)
🔥 Best Markets:
• Excellent: BTC, ETH, Forex majors, ES, NQ
• Good: Gold, Oil, Major indices
• Note: Breakers need volatility to form
━━━━━━━━━━━━━━━━━━━━━━━━━━━━
🎓 Advanced Concepts
Breaker Strength Hierarchy
From weakest to strongest:
1. Support/Resistance lines
2. Order Blocks (unbroken)
3. Breaker Blocks (broken OBs) ← Often strongest
4. Multiple breakers stacked together
Breaker vs Order Block Priority
If breaker and order block overlap:
• Breaker takes precedence
• Failed levels are more significant
• Price respects breakers more reliably
Nested Breakers [/b>
When lower timeframe breaker exists within higher timeframe breaker:
• Trade lower TF breaker first
• Use higher TF breaker as final target
• Highest probability setups
Multiple Breaker Tests [/b>
• First test: Highest probability
• Second test: Still valid but weaker
• Third test: Likely to break through
Breaker Breakouts [/b>
When price breaks through breaker:
• Extremely strong momentum signal
• Old level completely invalidated
• Trade the breakout aggressively
━━━━━━━━━━━━━━━━━━━━━━━━━━━━
📈 Common Patterns [/b>
Pattern 1: The Perfect Flip
• Bearish OB forms
• Price breaks above it cleanly
• Becomes bullish breaker
• First retest bounces perfectly
• High-probability setup
Pattern 2: The Double Break
• Bullish OB breaks down (becomes bearish breaker)
• Price tests it and rejects
• Later breaks back up through breaker
• Very strong momentum signal
Pattern 3: The Breaker Ladder [/b>
• Multiple breakers stacked like stairs
• Price bounces from one to next
• Each breaker provides support/resistance
Pattern 4: The Failed Breaker
• Breaker forms but gets broken immediately
• Shows extreme momentum
• Don't fight it - trade the breakout
━━━━━━━━━━━━━━━━━━━━━━━━━━━━
🙏 If You Find This Helpful
• ⭐ Leave your feedback
• 💬 Share your experience in the comments
• 🔔 Follow for updates and new tools
Questions about breaker blocks? Feel free to ask in the comments.
━━━━━━━━━━━━━━━━━━━━━━━━━━━━
Version History [/b>
• v1.0 - Initial release with auto-timeframe detection and polarity flip tracking

SMC-Math by Thomas v1📌 SMC-Math by Thomas v1 — Description
SMC-Math by Thomas v1 is a complete Smart Money Concepts toolkit designed for traders who want a clean, mathematical, and structured view of market mechanics.
Rather than relying on abstract concepts or subjective drawings, this indicator focuses on rules-based detection of:
✔ Order Blocks (OB)
✔ Fair Value Gaps (FVG)
✔ Market Structure shifts (BoS / CHoCH)
✔ HTF trend confirmation
✔ Premium / Discount arrays
✔ Equal High & Equal Low Liquidity Zones (no hinting — expiry only)
This version is engineered for stability, clarity, and performance — with fully optimized array management, timestamp-based cleanup, and a clean visual presentation suitable for both discretionary and systematic trading.
📌 Key Features
🔹 1. Order Blocks (Bullish & Bearish)
Auto-detected using fractal swing highs/lows
Optional displacement + high volume filters
Midline display option
HTF trend alignment filter
Smart expiry + broken OB cleanup
Custom opacity, buffer, and extension controls
🔹 2. Fair Value Gaps (FVG)
Bullish and bearish gap detection
HTF confirmation-based dimming
No border for a clean ICT-style visuals
Auto remove when filled
Fully rule-based
🔹 3. Market Structure (BoS / CHoCH)
Based on fractal highs/lows
Automatic labeling (small, unobtrusive)
Direction validated by HTF option
Each structure level plotted with a projected line
Smooth, clean BOS/CHOCH flow
🔹 4. Premium / Discount Zones
Auto-calculated from most recent swing high & swing low
Box shading dynamically updates each bar
Helps identify optimal trade areas (OB → FVG → PD array)
🔹 5. Liquidity Zones (Equal Highs & Equal Lows)
This tool highlights where liquidity is likely resting:
Detects Equal Highs and Equal Lows using your tolerance or max difference
Auto-creates borderless shaded boxes
Adjustable box height and extension
NO hinting logic — the box remains for exactly cleanupDelay bars, then expires
Clean and predictable behavior, ideal for rule-based setups
This is especially useful for:
identifying buy-side and sell-side liquidity pools
anticipating runs on liquidity
targeting sweeps
🔹 6. HTF Status Panel
Shows higher-timeframe trend status on the live bar:
Bullish
Bearish
Or “HTF Not Required”
Useful for aligning entries with larger market flow.
📌 How to Use SMC-Math by Thomas v1
1️⃣ Identifying Direction
Start by reading:
HTF Trend Label
BOS & CHOCH reactions
Bullish: look for HL → HH structure + bullish OBs + bullish FVGs
Bearish: look for LH → LL structure + bearish OBs + bearish FVGs
This creates your directional bias.
2️⃣ Using Order Blocks
An OB is valid when:
It appears in line with structure
HTF alignment supports it (optional toggle)
Price returns after a displacement
OB is not “broken” (indicator handles this visually)
Use OBs as:
Rebalance targets
Entry areas
Stop placement logic
3️⃣ Fair Value Gaps
FVGs appear when price dislocates and leaves inefficiency.
Use them to:
Refine entries inside OBs
Project premium/discount zones
Identify continuation zones
The indicator auto-removes FVGs when filled.
4️⃣ Liquidity Zones
Liquidity zones identify resting orders at equal highs/lows.
This version uses simple expiry logic:
Box is created when EQH/EQL forms
It remains visible for 20 bars (default)
It disappears automatically after expiry
No hint/confirmation triggers deletion
Usage tips:
Expect price to run toward these zones
Use them as targets or continuation markers
Combine with OB/FVG for confluence
5️⃣ Premium / Discount Zones
Use PD arrays to gauge:
Premium = optimal shorting zones
Discount = optimal long zones
Not trade “in the middle” unless a clear BOS or CHoCH happens
📌 Recommended Workflow
HTF Bias → Check the HTF panel
Market Structure → Identify trend continuation or reversal
Liquidity → Mark where price is likely to target
FVG → Identify imbalance zones
OB → Confirm institutional origin points
PD Arrays → Determine optimal trade location
Execute with confluence
📌 Who Is This Indicator For?
✔ Traders using ICT / SMC logic
✔ Traders wanting rule-based, non-subjective markups
✔ Traders who want automated detection without repainting
✔ Anyone who uses OB, FVG, liquidity sweeps, and structure shifts

TedAlpha – Structure / FVG / OB Sessions:
Only looks for trades when price is inside your defined London or NY time blocks.
CHOCH:
Uses pivots to track swing highs/lows, then flags a bullish CHOCH when structure flips from LL/LH to HH/HL, and vice versa for bearish.
FVG:
Detects 3-candle imbalance and keeps the zone “active” for fvgLookback bars, then checks if price trades back into it.
Order Blocks:
On a CHOCH, grabs the last opposite candle (bearish before bull CHOCH = bullish OB, bullish before bear CHOCH = bearish OB) and marks its body as the OB zone.
Signal:
A valid long = bull CHOCH + in session + (price inside bullish FVG and/or bullish OB, depending on toggles).
Short is the mirror image.
RR 1:3:
SL uses the last swing low (for longs) or last swing high (for shorts), TP is auto-set at 3× that distance and plotted as lines.

FANBLASTERFANBLASTER
Methodology & Rules (Live Trading Version)
Purpose
Catch the exact moment the market flips from chop into a high-conviction trending move using a clean, stacked Fib EMA ribbon + volatility + volume confirmation.
Core Idea
When the 5-8-13-21-34-55 EMA stack suddenly “fans out” in perfect order with significant separation, a real trend is being born. Most retail traders chase late – FANBLASTER alerts you on the very first bar the fan opens.
What Triggers a “FAN BLAST” Alert
Perfect EMA Alignment
Bullish: 5 > 8 > 13 > 21 > 34 > 55
Bearish: 5 < 8 < 13 < 21 < 34 < 55
(Has to flip from NOT aligned on the previous bar → aligned on this bar)
Significant Separation
Distance between EMA 5 and EMA 55 ≥ 1.3 × ATR(14)
(1.3 is the ES sweet spot – filters fake little wiggles)
Trend Strength Confirmation
ADX(14) ≥ 22
(Ensures the move isn’t just noise; ES trends explode while ADX is still climbing)
Volume Conviction
Current volume > 1.4 × 20-period EMA of volume
(Real moves have real participation)
When ALL FOUR conditions are true on the same bar → you get the green or red circle + phone alert.
How to Trade It (Live Rules)
Alert fires → look at the chart immediately
If price is pulling back to the 8 or 13 EMA in the direction of the fan → enter on touch or close above/below
Initial stop: opposite side of the fan (below the 55 for longs, above the 55 for shorts)
Target: 2–4 R minimum, trail with the 21 or 34 once in profit
No alert = stay flat. This is a “trend birth” sniper, not a scalping tool.
Best Instruments & Timeframes (2025)
ES & NQ futures
2 min, 5 min, 15 min (all work with the exact same settings)
Works on MES/MNQ too (same params)
Bottom Line
FANBLASTER sits silent 90 % of the day and only screams when the market is actually about to run 20–100+ points.
One alert = one high-probability trend. That’s it.
Lock it, load it, and let the phone do the hunting.
Good luck, stay disciplined, and stack those points.
— Your edge is now live.

SMC Pro+ ICT v4 Enhanced - FINAL🎯 SMC Pro+ ICT v4 Enhanced - Complete Smart Money Trading System📊 Professional All-in-One Indicator for Smart Money Concepts & ICT MethodologyThe SMC Pro+ ICT v4 Enhanced is a comprehensive trading system that combines Smart Money Concepts (SMC) with Inner Circle Trader (ICT) methodology. This indicator provides institutional-grade market structure analysis, liquidity mapping, and volume profiling in one powerful package.✨ CORE FEATURES🏗️ Advanced Market Structure Detection
MSS (Market Structure Shift) - Identifies major trend reversals with precision
BOS (Break of Structure) - Confirms trend continuation moves
CHoCH (Change of Character) - Detects internal structure shifts
Modern LuxAlgo-Style Lines - Clean, professional visualization
Dual Sensitivity System - External structure (major swings) + Internal structure (minor swings)
Customizable Labels - Tiny, Small, or Normal sizes
Structure Break Visualization - Clear break point markers
💎 Supply & Demand Zones (POI - Point of Interest)
Institutional Order Blocks - Where smart money enters/exits
ATR-Based Zone Sizing - Dynamically adjusted to market volatility
Smart Overlap Detection - Prevents cluttered charts
Historical Zone Tracking - Maintains up to 50 zones
POI Central Lines - Pinpoint entry/exit levels
Auto-Extension - Zones extend to current price
Auto-Cleanup - Removes broken zones automatically
📦 Fair Value Gap (FVG) Detection
Bullish & Bearish FVGs - Institutional inefficiencies
Consequent Encroachment (CE) - 50% fill levels
Auto-Delete Filled Gaps - Keeps charts clean
Customizable Lookback - 1-30 days of history
Color-Coded Zones - Easy visual identification
CE Line Styles - Dotted, Dashed, or Solid
🚀 Enhanced PVSRA Volume Analysis
This is one of the most powerful features:
200% Volume Candles - Extreme institutional activity (Lime/Red)
150% Volume Candles - High institutional interest (Blue/Fuchsia)
Volume Climax Detection - Major reversal signals with 2.5x+ volume
Exhaustion Signals - Identifies buying/selling exhaustion with high accuracy
Enhanced Volume Divergence - NEW! High-quality reversal detection
Price makes lower low, Volume makes higher low = Bullish Divergence
Price makes higher high, Volume makes lower high = Bearish Divergence
Strict trend context filtering for accuracy
Rising/Falling Volume Patterns - Momentum confirmation (allows 1 exception in 3 bars)
Volume Spread Analysis - Price range × Volume for true strength
Body/Wick Ratio Analysis - Candle structure quality
ATR Normalization - Adjusts for different market volatility
Volume Profile Indicators - 🔥 EXTREME, ⚡ VERY HIGH, 📈 HIGH, ✅ ABOVE AVG
💧 Advanced Liquidity System
Smart money targets these levels:
Weekly High/Low Liquidity - Major institutional targets
Daily High/Low Liquidity - Intraday key levels
4H Session Liquidity - Short-term targets
Distance Indicators - Shows % distance from current price
Strength Indicators - Identifies high-probability sweeps
Swept Level Detection - Tracks executed liquidity grabs
Customizable Line Styles - Width, length, offset controls
Color-Coded Levels - Easy visual hierarchy
🎯 Master Bias System
Data-driven directional bias with 9-factor scoring:
Bull/Bear Bias Calculation - 0-100% scoring system
Multi-Timeframe Analysis - Daily, 4H, 1H trend alignment
Kill Zone Integration - London (2-5 AM) & NY (8-11 AM) sessions
EMA Alignment Factor - Trend confirmation
Volume Confirmation - Adds 5% when volume supports direction
Range Filter Integration - Adds 10% for trending markets
Session Context - Above/below session midpoint scoring
Bias Strength Rating - STRONG (>75%), MODERATE (60-75%), WEAK (<60%)
Real-Time Updates - Dynamic recalculation
📈 Premium & Discount Zones
Fibonacci-based institutional pricing:
Extreme Premium - Above 78.6% (Overvalued)
Premium Zone - 61.8% - 78.6% (Expensive)
Equilibrium - 38.2% - 61.8% (Fair Value)
Discount Zone - 21.4% - 38.2% (Cheap)
Extreme Discount - Below 21.4% (Undervalued)
Visual Zone Boxes - Color-coded for instant recognition
200-500 Bar Lookback - Customizable range calculation
🔄 Range Filter
Advanced trend detection:
Smoothed Range Calculation - Eliminates noise
Dynamic Support/Resistance - Auto-adjusting levels
Upward/Downward Counters - Measures trend strength
Color-Coded Line - Green (uptrend), Red (downtrend), Orange (ranging)
Adjustable Period - 1-200 bars
Multiplier Control - Fine-tune sensitivity (0.1-10.0)
🌊 Liquidity Zones (Vector Zones)
PVSRA-based horizontal liquidity:
Above Price Zones - Resistance clusters
Below Price Zones - Support clusters
Maximum 500 Zones - Professional-grade capacity
Body/Wick Definition - Choose zone boundaries
Auto-Cleanup - Removes cleared zones
Color Override - Custom styling options
Transparency Control - 0-100% opacity
📊 EMA System
Triple EMA trend confirmation:
Fast EMA (9) - Green line - Immediate trend
Medium EMA (21) - Blue line - Short-term trend
Slow EMA (50) - Red line - Major trend
EMA Alignment Detection - Bull/Bear stack confirmation
Dashboard Integration - Status: 📈 BULL ALIGN, 📉 BEAR ALIGN, 🔀 MIXED
Adjustable Lengths - Customize all three EMAs (5-200)
🎯 IDM (Institutional Decision Maker) Levels
Key institutional price levels:
Latest IDM Detection - 20-bar pivot lookback
Extended Lines - Projects 50 bars into future
Customizable Styles - Solid, Dashed, or Dotted
Line Width Control - 1-5 pixels
Color Selection - Match your chart theme
Price Label - Shows exact level with tick precision
📱 Professional Dashboard
Real-time market intelligence panel:
🎯 SIGNAL - 🟢 LONG, 🔴 SHORT, ⏳ WAIT, 🛑 NO TRADE
🎲 BIAS - Bull/Bear with STRONG/MODERATE/WEAK rating
📊 BULL/BEAR Scores - 0-100% percentage display
💎 ZONE - Current premium/discount location
🕐 KZ - Kill Zone status (🇬🇧 LONDON/🇺🇸 NY/⏸️ OFF)
🏗️ STRUCT - Market structure status (BULLISH/BEARISH/NEUTRAL)
⚡ EVENT - Last structure event (MSS/BOS)
⚡ INT - Internal structure trend
🎯 IDM - Latest institutional level
📊 EMA - EMA alignment status
🔄 RF - Range Filter direction
📊 PVSRA - Volume status (🚀 CLIMAX/📈 RISING/📉 FALLING)
📅 MTF - Multi-timeframe alignment (✅ FULL/⚠️ PARTIAL/❌ CONFLICT)
💪 CONF - Confidence score (0-100%)
📊 VOL - Volume ratio (e.g., 1.8x average)
Advanced Metrics (Toggle On/Off):
📏 RSI - Value + Status (OVERBOUGHT/STRONG/NEUTRAL/WEAK/OVERSOLD)
📈 MACD - Value + Direction (BULL/BEAR)
🌪️ VOL - Volatility state (⚠️ EXTREME/🔥 HIGH/📊 NORMAL/😴 LOW)
🔊 VOL PROF - Volume profile ratio
⏱️ TF - Current timeframe
Dashboard Customization:
4 Positions - Top Left, Top Right, Bottom Left, Bottom Right
3 Sizes - Small, Normal, Large
2 Modes - Compact (MTF combined) or Full (separate rows)
Professional Design - Dark theme with color-coded cells
🎮 TRADING SIGNALS & SETUP SCORING🟢 LONG Setup Requirements (9-Factor Confidence Score)
MTF Alignment - Daily/4H/1H/Structure all bullish (+2 points for full, +1 for partial)
Volume Confirmation - Above 1.2x average (+1 point)
Structure Event - MSS or BOS bullish (+2 points)
EMA Alignment - 9 > 21 > 50 (+1 point)
Kill Zone Active - London/NY + Bull bias >75% (+2 points)
Bias Match - Master bias matches structure trend (+1 point)
Confidence Threshold - >60% minimum for signal
🔴 SHORT Setup Requirements
Same 9-factor system but inverted for bearish conditions.💪 Confidence Levels
75-100% - ⭐ HIGH CONFIDENCE (Strong setup, all factors aligned)
50-74% - ⚠️ MODERATE (Good setup, partial alignment)
0-49% - ❌ LOW CONFIDENCE (Wait for better setup)
🎯 Signal Output
🟢 LONG - Bull bias + Bullish structure + >60% confidence
🔴 SHORT - Bear bias + Bearish structure + >60% confidence
⏳ WAIT LONG - Bull bias but low confidence
⏳ WAIT SHORT - Bear bias but low confidence
🛑 NO TRADE - Neutral bias or conflicting signals
🔔 COMPREHENSIVE ALERT SYSTEM (12 Alerts)Structure Alerts
⚡ MSS Bullish - Major bullish reversal
⚡ MSS Bearish - Major bearish reversal
📈 BOS Bullish - Bullish continuation
📉 BOS Bearish - Bearish continuation
⚠️ CHoCH Bullish - Internal bullish shift
⚠️ CHoCH Bearish - Internal bearish shift
Bias & Confidence Alerts
🟢 Bias Shift Bull - Master bias turns bullish
🔴 Bias Shift Bear - Master bias turns bearish
⭐ High Confidence - Setup reaches 75%+ confidence
Volume Alerts (High Probability)
🚀 Volume Climax Buy - Extreme bullish volume spike
💥 Volume Climax Sell - Extreme bearish volume spike
⚠️ Selling Exhaustion - Potential bullish reversal
⚠️ Buying Exhaustion - Potential bearish reversal
📊 Bullish Volume Divergence - High-quality bullish reversal signal
📊 Bearish Volume Divergence - High-quality bearish reversal signal
🎨 EXTENSIVE CUSTOMIZATIONColors & Styling
✅ All colors customizable for every component
✅ Supply/Demand zone colors + outlines
✅ FVG colors (bullish/bearish)
✅ PVSRA candle colors (6 types)
✅ Liquidity level colors (Weekly/Daily/4H/Swept)
✅ Structure line colors
✅ Premium/Equilibrium/Discount zone colorsDisplay Controls
✅ Toggle each feature on/off independently
✅ Adjustable sensitivities (Structure: 5-30, Internal: 3-15)
✅ Label size controls (Tiny/Small/Normal)
✅ Line width adjustments (1-5 pixels)
✅ Transparency controls (0-100%)
✅ Extension lengths (20-100 bars)
✅ Lookback periods (50-500 bars)Volume Settings
✅ PVSRA symbol override (trade one asset, analyze another)
✅ Climax threshold (2.0-5.0x)
✅ Rising volume bar count (2-5 bars)
✅ Divergence filters (Strict/Lenient)
✅ Divergence minimum bars (10-30)
✅ Volume threshold multiplier (1.0-2.0x)Dashboard Settings
✅ Position (4 corners)
✅ Size (Small/Normal/Large)
✅ Compact/Full mode
✅ Show/Hide advanced metrics
✅ Show/Hide EMA status💡 BEST PRACTICES & USAGE TIPS⏰ Optimal Timeframes
Scalping - 1m, 5m (Use Kill Zones, Volume Climax, FVG)
Day Trading - 5m, 15m, 1H (Use Structure, Liquidity, Bias)
Swing Trading - 4H, Daily (Use MTF, Premium/Discount, Structure)
Position Trading - Daily, Weekly (Use major structure, liquidity)
🎯 Asset Classes
✅ Forex - All pairs (especially majors during Kill Zones)
✅ Crypto - BTC, ETH, altcoins (24/7 liquidity)
✅ Stocks - All stocks and indices (use session times)
✅ Commodities - Gold, Silver, Oil (high volume periods)
✅ Indices - S&P 500, NASDAQ, DAX, etc.🔥 High-Probability Setups
The Perfect Storm
MSS in direction of daily trend
Kill Zone active
Volume climax
Confidence >75%
Price in discount (long) or premium (short)
Volume Divergence Play
Enhanced volume divergence signal
CHoCH confirms direction change
Price near liquidity level
FVG forms for entry
Liquidity Sweep
Price sweeps weekly/daily high/low
Immediate rejection (selling/buying exhaustion)
Structure shift (MSS)
Volume confirmation
Structure Retest
BOS breaks structure
Price returns to POI/FVG
Volume confirms (>1.2x)
Kill Zone active
📊 Multi-Timeframe Analysis
Higher Timeframe - Identify trend & structure (Daily/4H)
Trading Timeframe - Find entries (15m/1H)
Lower Timeframe - Precise entries (1m/5m)
Look for MTF alignment - Dashboard shows ✅ FULL or ⚠️ PARTIAL
⚠️ Risk Management
Always use stop-loss (below/above recent structure)
Position size: 1-2% risk per trade
Target liquidity levels for take profit
Use supply/demand zones for SL placement
Watch for exhaustion signals near targets

Intermarket Swing Projection [LuxAlgo]The Intermarket Swing Projection allows traders to plot price movement swings from any user-selected asset directly onto the chart in the form of zigzags and/or horizontal support and resistance levels.
This tool rescale the external asset price on the user chart, enabling traders to make direct comparisons.
It answers the question of how different the price behavior is between two assets, accounting for each asset's volatility.
🔶 USAGE
This tool is based on swing detection of two different assets: the chart and a user-selected asset. It allows traders to compare two assets on an equal footing while accounting for volatility and price behavior.
Traders can customize the detection by selecting a custom ticker, timeframe, the number of swings and length for swing detection. This makes the tool a Swiss army knife for asset comparison.
As we can see in the image below, the Show Last, Pivot Length, and Spread parameters are key to defining the final output of the tool.
"Show Last" defines how many pivots are displayed. "Pivot Length" is used for pivot detection; a larger value will detect larger market structures. "Spread" defines how far apart the horizontal levels will be from their original location in terms of volatility.
🔹 Comparing different assets
This image shows the Nasdaq 100 futures contract compared to four other futures contracts: S&P 500, gold, bitcoin, and euro/U.S. dollar.
Plotting all of these assets in Nasdaq 100 terms makes it easy to compare and analyze price behaviors and identify key levels.
In the top left chart, we have NQ vs. ES. It's no surprise that they are practically an exact match; a large portion of the S&P 500 is technology.
In the top right chart, NQ vs. GC, we see totally different behaviors. We can clearly see the summer consolidation in gold and the resumption of the uptrend, which took gold above 29,200 NQ points, up from 21,200.
In the bottom right chart, we see bitcoin making new highs, way above the Nasdaq in May, July, and October. However, the last high was way below the Nasdaq prices on October 27—the first lower high in a while. Sellers are pushing down.
Finally, the bottom left chart is NQ vs. 6E. We can see large volatility in the uptrend since February, with NQ unable to catch up until now. The last swing low was almost a match, and 6E is in a range.
As we can see, this tool allows us to perform intermarket analysis properly by accounting for each asset's volatility and price behavior. Then, we plot them on the same scale on equal terms, which makes performing this kind of analysis easy.
As we can see in the chart above, the assets are the same as in the previous image, but the timeframe is 1H with different settings.
Note the horizontal levels acting as support and resistance, as well as how NQ prices react to the zones marked with white circles. These levels are derived from custom assets selected by the user.
🔹 Displaying Elements
Zig-zag allows traders to clearly see the path that the selected asset's price took, as well as its turning points.
Horizontal levels are displayed from those turning points to the present and can be used as support or resistance. Traders can adjust the spread parameter in the settings panel to expand or contract those levels' volatility.
There are two color modes for the levels: average and pivots. In the first mode, green is used for levels below the average and red for levels above the average. The second uses green for swing lows and red for swing highs.
The backpaint feature is enabled by default and allows the swings to be displayed in the correct location. With this feature disabled, the swings will be displayed in the current location when a new swing is detected.
🔶 DETAILS
On a more technical note, the rescaling is formed by calculating three main elements from all the swings detected on the custom and chart assets:
The chart asset's average of all swing points
The chart asset's standard deviation of all swing points
The custom asset's z-score for each swing point
Then, the re-scaled swing point is calculated as the average plus the z-score multiplied by the standard deviation. This makes it possible to plot AAPL swings on an NQ chart, for example.
Thanks to re-scaling, we can directly compare the price behavior of two assets with different price ranges and volatility on the same chart.
🔶 SETTINGS
🔹 Trendlines
Ticker: Select the custom ticker.
Timeframe: Select a custom timeframe.
Show Last: Select how many swing points to display.
Pivot Length: Select the size for swing point detection.
Spread: Volatility multiplier for horizontal levels. Larger values mean the levels are farther apart.
Backpaint: Enable or disable the backpaint feature. When enabled, the drawings will be displayed where they were detected. When disabled, the drawings will be displayed at the moment of detection.
🔹 Style
Show ZigZag: Enable or disable the ZigZag display and choose a line style.
Show Levels: Enable or disable the levels display and choose a line style.
Color Mode: Choose between Average Mode, which colors all levels below the average bullish and all levels above bearish, and Pivot Mode, which colors swing highs bearish and swing lows bullish.
Bullish: Select a bullish color.
Bearish: Select a bearish color.
ZigZag: Select the ZigZag color.

Apex IndicatorThe Apex Indicator is a physics-based momentum tool designed to measure the 2nd Derivative (Acceleration) of both Price and Volume.
Unlike standard oscillators which often lag, this indicator uses Kinematics to identify the subtle shifts in momentum before price makes a major move. It answers the critical questions: Is the selling pressure fading? and Is there fresh fuel (Volume) entering to support a turn?
This script uses Hull Moving Average (HMA) smoothing for low-latency calculation, and Z-Score Normalization to force Price and Volume onto a shared, readable scale.
Visual Guide
The Histogram (Price Acceleration)
Bright Green: Strong Bullish Acceleration (High Velocity).
Dark Green: Developing Bullish Momentum (or Waning Bullishness depending on context).
Bright Red: Strong Bearish Acceleration (Panic/Dump).
Dark Red: Developing Bearish Momentum (or Waning Bearishness).
The Line (Volume Acceleration)
Yellow: Volume is accelerating (Interest is entering).
Purple: Volume is decelerating (Interest is leaving).
The Background Highlights
Green/Red Background: These mark Statistical Extremes (>1 Standard Deviation). While these show maximum power, they often mark the climax of a move rather than the start.
How to Trade: Reading the Subtleties
The power of the Apex Indicator is not in chasing the spikes, but in reading the Transitions.
1. The Turn (The Reversal Entry)
Don't wait for the explosion; look for the "braking" action.
The Setup: Price has been moving down strongly (Bright Red bars).
The Signal: The histogram shifts to Dark Red and begins moving up toward the zero line (less negative). This means the selling acceleration is dying.
The Trigger: A Dark Green bar prints, accompanied by the Volume Line turning Yellow/Rising.
Why it works: You are entering when the bearish energy is exhausted and fresh volume is stepping in to lift the price, often before the main breakout occurs.
2. The Second Wind (Trend Continuation)
The Setup: You are already in a trend (Green bars), but the bars fade to Dark Green or near Zero (a pullback or pause).
The Trigger: The next bar flips Bright Green and the Volume Line spikes Yellow.
Why it works: This confirms that the pause was just a breather, and buyers are stepping back on the gas.
3. The "Hollow Move" (Trap Avoidance)
The Scenario: Price is moving up (Green bars), but the Volume Line is Purple or dropping.
Interpretation: This is a drift, not a drive. Without volume acceleration support, these moves are prone to rapid reversal.
4. The Climax (Exits)
If the Background flashes Green (Alert Trigger), be aware that price acceleration has hit a statistical extreme (Z-Score > 1).
If you are in a position, this is often a good place to Take Profit, as maintaining that level of acceleration is mathematically difficult for the market to sustain.
Settings
Analysis Length (21): The lookback period for the HMA smoothing.
Normalization Lookback (21): The historical window used to calculate the Z-Score. A setting of 21 allows the indicator to self-adjust quickly to recent volatility conditions.

Point of Control + Momentum CandlesPOINT OF CONTROL + MOMENTUM CANDLES
A comprehensive technical analysis indicator combining volume-based Point of Control detection, momentum-graded candle coloring, higher timeframe buy/sell signals, and order block identification.
━━━━━━━━━━━━━━━━━━━━━━━━━━━━━━━━━━━━━━━━━━━━━━━━━━━━━━━━━━━━━━━━━━
WHAT THIS INDICATOR DOES
This indicator identifies key price levels where the most trading activity has occurred (Point of Control), colors candles based on momentum strength, generates buy/sell signals from a user-selected timeframe, and detects order blocks that may act as future support/resistance zones.
━━━━━━━━━━━━━━━━━━━━━━━━━━━━━━━━━━━━━━━━━━━━━━━━━━━━━━━━━━━━━━━━━━
FEATURES
1. POINT OF CONTROL (POC)
The POC represents the price level with the highest traded volume over a lookback period. This indicator calculates a volume profile by distributing volume across price levels and identifying where the most activity occurred.
- Orange horizontal line shows the current POC level
- Yellow box highlights the candles used in the POC calculation
- Break detection identifies when price closes decisively beyond the POC
- Rejection detection identifies when price tests but fails to break the POC
2. MOMENTUM CANDLE COLORING
Candles are colored based on a 6-level momentum system using EMA positioning and RSI values:
Bullish Levels (price above both EMAs):
- Bull Level 3 (Royal Blue): Strong momentum, RSI above 70
- Bull Level 2 (Cyan): Medium momentum, RSI above 60
- Bull Level 1 (Green): Weak momentum, above EMAs
Bearish Levels (price below both EMAs):
- Bear Level 1 (Yellow): Weak momentum, below EMAs
- Bear Level 2 (Orange): Medium momentum, RSI below 40
- Bear Level 3 (Red): Strong momentum, RSI below 30
Neutral (White): No clear directional momentum
3. BUY/SELL SIGNALS
Signals are generated from a user-selectable timeframe (default: 10 minutes) and appear on your current chart. This allows you to see higher timeframe signals while trading on lower timeframes.
Buy Signal Conditions:
- EMA crossover (fast crosses above slow) OR RSI exits oversold
- Bullish candle on the signal timeframe
- Close above both EMAs
Sell Signal Conditions:
- EMA crossunder (fast crosses below slow) OR RSI exits overbought
- Bearish candle on the signal timeframe
- Close below both EMAs
4. ORDER BLOCKS
Order blocks identify potential institutional entry zones that may act as future support or resistance.
- Bullish Order Block (Green zone): The last bearish candle before a bullish impulse move
- Bearish Order Block (Red zone): The last bullish candle before a bearish impulse move
- Blocks automatically extend forward and can be set to delete when mitigated (price closes through the zone)
5. DASHBOARD
A customizable info panel displays:
- Current POC price
- Distance from POC (percentage)
- Position relative to POC (Above/Below/At)
- Lookback period
- Current RSI value
- Current momentum level
- Signal timeframe
- Active order block count
━━━━━━━━━━━━━━━━━━━━━━━━━━━━━━━━━━━━━━━━━━━━━━━━━━━━━━━━━━━━━━━━━━
HOW TO USE
POC Trading:
- Watch for breaks above POC for potential long entries
- Watch for breaks below POC for potential short entries
- Rejections at POC can indicate reversal opportunities
Momentum Reading:
- Use candle colors to gauge trend strength at a glance
- Level 3 colors indicate strong momentum (potential continuation)
- Level 1 colors indicate weakening momentum (potential reversal)
- Neutral/white candles suggest consolidation or indecision
Signal Confirmation:
- Use buy/sell signals from a higher timeframe to confirm entries on your trading timeframe
- Combine signals with POC breaks/rejections for higher probability setups
Order Block Strategy:
- Look for price to return to bullish order blocks for potential long entries
- Look for price to return to bearish order blocks for potential short entries
- Mitigated blocks (price closes through) lose their significance
━━━━━━━━━━━━━━━━━━━━━━━━━━━━━━━━━━━━━━━━━━━━━━━━━━━━━━━━━━━━━━━━━━
SETTINGS OVERVIEW
POC Settings:
- Lookback Period: Number of bars for POC calculation (default: 20)
- Volume Resolution: Price level granularity (default: 50)
- Recalculation Frequency: How often POC updates (default: every 3 bars)
Break/Rejection Detection:
- Break Threshold: Minimum percentage move to confirm a break (default: 0.3%)
- Rejection Wick Ratio: Minimum wick-to-body ratio for rejections (default: 0.5)
Momentum Settings:
- Fast/Slow EMA lengths for trend determination
- RSI length and threshold levels for momentum grading
Buy/Sell Signals:
- Signal Timeframe: The timeframe used for signal calculation
- Separate EMA and RSI parameters for signal generation
Order Blocks:
- Order Block Timeframe: Timeframe for OB detection
- Max Blocks Per Side: Limits displayed order blocks
- Delete Mitigated: Automatically removes invalidated blocks
All visual elements (colors, sizes, line styles) are fully customizable.
━━━━━━━━━━━━━━━━━━━━━━━━━━━━━━━━━━━━━━━━━━━━━━━━━━━━━━━━━━━━━━━━━━
ALERTS
10 alert conditions are available:
- Bullish/Bearish POC Break
- Bullish/Bearish POC Rejection
- Any POC Break
- Any POC Rejection
- Buy Signal
- Sell Signal
- Bullish Order Block Formed
- Bearish Order Block Formed
━━━━━━━━━━━━━━━━━━━━━━━━━━━━━━━━━━━━━━━━━━━━━━━━━━━━━━━━━━━━━━━━━━
NOTES
- The indicator uses request.security() to fetch data from the signal and order block timeframes. This is designed to work when viewing charts at timeframes equal to or lower than your selected signal/OB timeframes.
- POC calculations are based on the visible volume data. Assets with limited volume data may produce less reliable POC levels.
- Order blocks are detected using a simplified algorithm based on candle patterns and displacement. They represent potential zones of interest, not guaranteed support/resistance levels.
━━━━━━━━━━━━━━━━━━━━━━━━━━━━━━━━━━━━━━━━━━━━━━━━━━━━━━━━━━━━━━━━━━
DISCLAIMER
This indicator is provided for educational and informational purposes only. It does not constitute financial advice or a recommendation to buy or sell any security. Trading involves substantial risk of loss. Past performance is not indicative of future results. Always conduct your own analysis and consider your risk tolerance before making trading decisions. Use this tool as part of a comprehensive trading strategy, not as a standalone signal generator.

Fractal MTF MA System Overview Unlock the fractal nature of the market with a single, clean indicator. This tool allows you to visualize the exact same Moving Average length (default: 50) across 5 different timeframes simultaneously. By comparing "apples to apples" across time dimensions, you get a clear, immediate view of the overall market trend and momentum health.
No more switching charts or manually adding 5 different indicators. This script does it all with a single global setting.
Key Features
🧩 Fractal Logic: Applies one consistent calculation (e.g., 50 Period) to 15m, 30m, 1H, 2H, and 4H timeframes.
🎛️ Global Control: Change the Length or MA Type once, and it instantly updates all 5 lines. No need to adjust each line individually.
🚀 3 Calculation Modes: Switch between DEMA (Double Exponential - Default/Fast), EMA (Standard), or SMA (Smooth) to fit your trading style.
🎨 Visual Clarity: Choose between Step mode (for precise MTF levels) or Line mode (for a smoother, cleaner look).
How to Use This Indicator
1. Trend Following (The Fan) When the market is trending strongly, the lines will stack in perfect order:
Bullish: Price > 15m > 30m > 1H > 2H > 4H.
Bearish: Price < 15m < 30m < 1H < 2H < 4H.
Strategy: Ride the trend as long as the "Fan" is open and orderly.
2. Mean Reversion (The Snap-Back) When the price moves too far from the anchor line (the 4H line) and the gaps between the lines become extreme, the market is "overextended" (like a stretched rubber band).
Strategy: Watch for price to stall and cross back over the fastest line (15m) as an early sign of a correction towards the slower averages.
3. Dynamic Support & Resistance During a trend, price often pulls back to test the 1H or 2H lines before continuing. These lines act as dynamic support zones.
Settings
Global Length: Sets the lookback period for ALL lines (Default: 50).
MA Type: Select DEMA, EMA, or SMA.
Line Style: Toggle between Step (precise) or Line (smooth).
Individual Toggles: You can hide specific timeframes via the settings menu if you want a cleaner chart.
Enjoy the clean charts! Feedback and likes are appreciated. 🚀

ICT Order Block Identifier [Eˣ]📦 Order Block Identifier
Overview
The Order Block Identifier automatically detects and displays institutional order blocks on your charts - zones where banks, hedge funds, and market makers place their orders. This indicator helps identify where institutions are likely to defend their positions and where price often finds support or resistance, based on ICT (Inner Circle Trader) concepts.
━━━━━━━━━━━━━━━━━━━━━━━━━━━━
🎯 What This Indicator Does
Detects Order Blocks:
• 🟢 Bullish Order Blocks (OB+) - Last bearish candle before strong bullish move
• 🔴 Bearish Order Blocks (OB-) - Last bullish candle before strong bearish move
• Automatically identifies institutional buying/selling zones
• Tracks up to 30 order blocks simultaneously
• Works on all timeframes and instruments
Smart Features:
• Auto-Timeframe Adjustment - Optimizes detection for 1min to Weekly charts
• Active Block Highlighting - Shows which OB price is approaching
• Touch Tracking - Knows when blocks are tested
• ATR-Based Detection - Adapts to each instrument's volatility
• Strength Filtering - Choose Low/Medium/High to control sensitivity
━━━━━━━━━━━━━━━━━━━━━━━━━━━━
📚 Understanding Order Blocks
What Are Order Blocks?
Order blocks are the "footprints" left behind by institutional traders (banks, hedge funds, market makers) when they enter large positions. Because institutions can't fill massive orders at once without moving the market, they:
1. Place orders gradually over time
2. Leave zones where their buy/sell orders are concentrated
3. Defend these zones when price returns
4. Create reliable support and resistance levels
The ICT Concept:
Developed by Michael Huddleston (Inner Circle Trader), order block theory states that:
• The last opposite-colored candle before a strong move contains institutional orders
• Price often returns to test these zones before continuing
• These zones act as strong support (bullish OB) or resistance (bearish OB)
• Smart money defends their positions at these levels
Why Order Blocks Work:
• Unfilled Orders: Institutions may still have pending orders in the block
• Position Defense: They protect their entries by adding to positions
• Stop Placement: Retail stops cluster near these zones (liquidity for institutions)
• Market Structure: Price respects these levels due to order flow dynamics
━━━━━━━━━━━━━━━━━━━━━━━━━━━━
🟢 Bullish Order Blocks Explained
How They Form:
1. Price is consolidating or declining
2. Institutions begin accumulating (buying)
3. A strong bullish move erupts
4. The last bearish candle before this move = Bullish Order Block
5. This candle represents where institutions were buying aggressively
Why The Last Bearish Candle?
• Institutions absorbed all selling pressure at this level
• Their buy orders filled as price was declining
• When price returns, they defend this zone with more buying
• It becomes a demand zone / support level
Trading Bullish Order Blocks:
Setup:
• Wait for price to retrace back to bullish OB (green box)
• Look for rejection/reversal pattern (pin bar, engulfing, etc.)
• Enter long when price bounces from the OB zone
• Stop loss: Below the order block
• Target: Recent high or opposite order block
Best Scenarios:
• OB aligns with other support (trendline, fibonacci, round number)
• First touch of OB (unmitigated) has highest probability
• Occurs during high-volume sessions (London/NY)
• Trend is bullish on higher timeframe
Example Trade:
• Bullish OB forms at $50,000 (last red candle before rally)
• Price rallies to $52,000 then retraces
• Price drops back to $50,100 (touching OB)
• Bullish pin bar forms on the OB
• Enter long at $50,200, stop at $49,800
• Target: $52,000+ (previous high)
━━━━━━━━━━━━━━━━━━━━━━━━━━━━
🔴 Bearish Order Blocks Explained
How They Form:
1. Price is consolidating or rising
2. Institutions begin distributing (selling)
3. A strong bearish move erupts
4. The last bullish candle before this move = Bearish Order Block
5. This candle represents where institutions were selling aggressively
Why The Last Bullish Candle?
• Institutions absorbed all buying pressure at this level
• Their sell orders filled as price was rising
• When price returns, they defend this zone with more selling
• It becomes a supply zone / resistance level
Trading Bearish Order Blocks:
Setup:
• Wait for price to retrace back to bearish OB (red box)
• Look for rejection/reversal pattern (shooting star, bearish engulfing)
• Enter short when price rejects from the OB zone
• Stop loss: Above the order block
• Target: Recent low or opposite order block
Best Scenarios:
• OB aligns with other resistance (trendline, fibonacci, round number)
• First touch of OB (unmitigated) has highest probability
• Occurs during high-volume sessions (London/NY)
• Trend is bearish on higher timeframe
Example Trade:
• Bearish OB forms at $48,000 (last green candle before drop)
• Price drops to $46,000 then retraces
• Price rallies back to $47,900 (touching OB)
• Bearish engulfing forms at the OB
• Enter short at $47,800, stop at $48,200
• Target: $46,000- (previous low)
━━━━━━━━━━━━━━━━━━━━━━━━━━━━
📊 How To Use This Indicator
Strategy 1: Order Block Retest (Classic)
Best For: Swing trading, capturing reversals
Timeframes: 15min, 1H, 4H, Daily
Win Rate: 60-70% (first touch)
Entry Rules:
1. Identify unmitigated order block (bright color, not gray)
2. Wait for price to return to the OB zone
3. Look for price action confirmation:
• Bullish OB: Pin bar, bullish engulfing, hammer
• Bearish OB: Shooting star, bearish engulfing, doji
4. Enter in the direction of the OB
5. Stop loss: Beyond the opposite side of OB (20-30 pips)
6. Target: 2-3R or opposite OB
Example:
• Bullish OB at $100-$102
• Price drops to $101.50 (enters OB)
• Bullish pin bar forms with low at $100.80
• Enter long at $102 (OB high), stop at $99.50
• Risk: $2.50, Target: $107.50 (3R)
Strategy 2: Break & Retest
Best For: Trend trading, breakout confirmation
Timeframes: 5min, 15min, 1H
Win Rate: 65-75%
Entry Rules:
1. Price breaks through an order block
2. Wait for pullback to the broken OB
3. The OB now acts as support (if broken up) or resistance (if broken down)
4. Enter when price respects the flipped OB
5. Stop: Inside the OB zone
6. Target: Next OB or structure level
Why It Works: Broken OBs flip polarity - support becomes resistance and vice versa
Strategy 3: Multi-Timeframe Confirmation
Best For: High-probability setups
Timeframes: Combine 1H + 4H or 15min + 1H
Win Rate: 70-80%
Entry Rules:
1. Identify order block on higher timeframe (4H or Daily)
2. Switch to lower timeframe (1H or 15min)
3. Wait for lower TF order block to form within higher TF OB
4. Trade the lower TF OB in direction of higher TF OB
5. Stop: Below lower TF OB
6. Target: Edge of higher TF OB or beyond
Why It Works: Alignment across timeframes = institutional consensus
Strategy 4: Order Block to Order Block
Best For: Range trading, swing entries
Timeframes: 1H, 4H
Win Rate: 55-65%
Entry Rules:
1. Identify both bullish OB below and bearish OB above
2. Price is ranging between these OBs
3. Enter long at bullish OB, target bearish OB
4. Enter short at bearish OB, target bullish OB
5. Stop: Beyond the trading OB
6. Exit at opposite OB
Why It Works: Price moves from one institutional zone to another
Strategy 5: Mitigation Fade
Best For: Aggressive scalping
Timeframes: 5min, 15min
Win Rate: 50-60% (higher risk)
Entry Rules:
1. Price approaches an order block
2. Instead of bouncing, price breaks through (mitigates it)
3. Enter immediately in direction of breakout
4. Stop: Back inside the mitigated OB
5. Quick target: 1-1.5R
Why It Works: When OB fails, it often leads to strong continuation
━━━━━━━━━━━━━━━━━━━━━━━━━━━━
⚙️ Settings Explained
Core Settings
Auto-Adjust for Timeframe (Default: ON)
• Automatically optimizes detection for current chart timeframe
• 1min: 3 bars lookback
• 5min: 4 bars lookback
• 15min: 5 bars lookback
• 1H: 6 bars lookback
• 4H: 8 bars lookback
• Daily+: 10-12 bars lookback
• Recommended: Keep ON for best results
Manual Detection Length (Default: 5)
• Only used when Auto-Adjust is OFF
• Number of bars to look back for the "last opposite candle"
• Lower (2-4): More sensitive, more blocks, more noise
• Higher (6-10): Less sensitive, fewer blocks, higher quality
• Recommended: Use Auto-Adjust instead
Display Settings
Show Bullish/Bearish Order Blocks
• Toggle each type on/off independently
• Customize colors for each OB type
• Tip: Match colors to your chart theme
Max Order Blocks to Display (Default: 10)
• Limits how many OBs are shown at once
• Lower (5-8): Cleaner chart, only recent blocks
• Higher (15-30): More historical context
• Recommended: 8-12 for most trading
Show Order Block Labels (Default: ON)
• Displays "OB+" and "OB-" text on blocks
• Shows 🎯 on active (nearest) block
• Turn OFF for minimal chart appearance
• Recommended: Keep ON for clarity
Extend Blocks (bars) (Default: 50)
• How far to extend OB boxes to the right
• Lower (20-30): Shorter boxes, less clutter
• Higher (100+): Longer boxes, easier to see
• Blocks auto-extend until mitigated or limit reached
• Recommended: 40-60 bars
Filters
Block Strength Filter (Default: Medium)
• Controls how strong a move must be to create an OB
• Low: 0.5x ATR move required - Many blocks, more noise
• Medium: 1x ATR move required - Balanced quality/quantity
• High: 1.5x ATR move required - Only strongest institutional moves
• Recommended for beginners: High
• Recommended for experienced: Medium
• Recommended for scalpers: Low
Min Block Size % (Default: 0.1)
• Minimum size of OB as percentage of price
• Filters out tiny, insignificant blocks
• Crypto: 0.1-0.3%
• Forex: 0.05-0.15%
• Stocks: 0.1-0.5%
• Adjust based on instrument volatility
Advanced Settings
Show Mitigated Blocks (Default: OFF)
• When ON: Shows gray boxes for "used" order blocks
• When OFF: Blocks disappear after mitigation
• Use ON: For learning and analysis
• Use OFF: For clean, active trading
Highlight Active Block (Default: ON)
• Highlights the nearest order block to current price
• Active block shown with 🎯 emoji and brighter color
• Helps focus on most relevant trading opportunity
• Recommended: Keep ON
━━━━━━━━━━━━━━━━━━━━━━━━━━━━
📱 Info Panel Guide
Bullish OB Count
• Number of active (unmitigated) bullish order blocks
• Higher number = More support zones below price
• Multiple bullish OBs = Strong demand structure
Bearish OB Count
• Number of active (unmitigated) bearish order blocks
• Higher number = More resistance zones above price
• Multiple bearish OBs = Strong supply structure
Bias Indicator
• ⬆ Bullish: More bullish OBs than bearish (demand > supply)
• ⬇ Bearish: More bearish OBs than bullish (supply > demand)
• ↔ Neutral: Equal OBs on both sides
• Trade in direction of bias for higher probability
Near Indicator
• Shows which OB price is closest to
• Displays distance as percentage
• Example: "Bull OB 0.85%" = Bullish OB is 0.85% below current price
• Watch for "Near" alerts to time entries
━━━━━━━━━━━━━━━━━━━━━━━━━━━━
📱 Alert Setup
This indicator includes 4 alert types:
1. Price Entering Bullish OB
• Fires when price touches a bullish order block
• Action: Watch for bounce/reversal pattern
• High-probability long setup developing
2. Price Entering Bearish OB
• Fires when price touches a bearish order block
• Action: Watch for rejection/reversal pattern
• High-probability short setup developing
3. New Bullish OB Detected
• Fires when a new bullish order block forms
• Action: Mark the zone for future retest
• New demand zone identified
4. New Bearish OB Detected
• Fires when a new bearish order block forms
• Action: Mark the zone for future retest
• New supply zone identified
To Set Up Alerts:
1. Click "Alert" button (clock icon)
2. Select "Order Block Identifier"
3. Choose your alert condition
4. Configure notification method
5. Click "Create"
Pro Tip: Set "Price Entering" alerts to catch trading opportunities in real-time
━━━━━━━━━━━━━━━━━━━━━━━━━━━━
💎 Pro Tips & Best Practices
✅ DO:
• First touch is best - Unmitigated OBs have highest win rate (60-70%)
• Wait for confirmation - Don't buy/sell just because price touched OB
• Use multiple timeframes - Higher TF OBs are stronger than lower TF
• Combine with structure - OB + trendline/support = high probability
• Trade with the bias - More bullish OBs = favor longs
• Respect mitigation - Once OB is mitigated, it's less reliable
• Use proper stop loss - Always place stops beyond the OB zone
• Consider session timing - OBs work best during London/NY sessions
⚠️ DON'T:
• Don't blindly buy/sell at OBs - Wait for confirmation
• Don't ignore mitigation - Gray blocks are much weaker
• Don't trade every OB - Quality over quantity
• Don't fight strong trends - OBs can be run through in strong momentum
• Don't use alone - Combine with price action, support/resistance
• Don't expect 100% win rate - Even best OBs fail sometimes (30-40% of time)
• Don't overtrade - Wait for A+ setups with confluence
🎯 Best Timeframes By Trading Style:
• Scalpers: 1min, 5min (quick OB touches)
• Day Traders: 5min, 15min, 1H (balanced view)
• Swing Traders: 1H, 4H, Daily (major institutional zones)
• Position Traders: 4H, Daily, Weekly (strongest OBs)
🔥 Best Instruments:
• Excellent: Forex major pairs (EUR/USD, GBP/USD), BTC, ETH, ES, NQ
• Good: Gold, Oil, Major indices, Large-cap stocks
• Moderate: Altcoins, small-cap stocks (more noise)
• Avoid: Very low liquidity instruments (OBs less reliable)
⏰ Best Times To Trade OBs:
• London Session (03:00-12:00 EST): Highest OB respect rate
• NY Session (08:00-17:00 EST): Strong OB reactions
• London-NY Overlap (08:00-12:00 EST): Best probability
• Asian Session: Lower probability, wait for London
━━━━━━━━━━━━━━━━━━━━━━━━━━━━
🎓 Advanced Order Block Concepts
Order Block Flips (Polarity Change)
When price breaks through an OB and closes beyond it:
• Bullish OB that's broken becomes bearish (support becomes resistance)
• Bearish OB that's broken becomes bullish (resistance becomes support)
• Trading: Watch for retest of broken OB from opposite side
Order Block Refinement
When multiple OBs form at similar level:
• Later OB "refines" or "replaces" the earlier one
• Use the most recent OB as the active zone
• Older OBs become less relevant
Order Block Clusters
Multiple OBs stacked close together:
• Creates a "super zone" of institutional interest
• Higher probability of reversal
• Wider zone for entries (more room for confirmation)
Fair Value Gaps + Order Blocks
When OB aligns with Fair Value Gap:
• Extremely high probability setup
• Price is drawn to fill the gap AND test the OB
• Double confluence = institutional magnet
Order Block Mitigation Types
• Full Mitigation: Price fully enters and closes inside OB
• Partial Mitigation: Price wicks into OB but closes outside
• False Mitigation: Quick touch then immediate rejection
• Partial/false mitigation = OB still somewhat valid
━━━━━━━━━━━━━━━━━━━━━━━━━━━━
📈 Common Order Block Patterns
Pattern 1: The Perfect Retest
• OB forms during strong move
• Price continues 100-200+ pips
• Price retraces back to OB
• Clean bounce with confirmation candle
• Highest probability pattern
Pattern 2: The Double Tap
• Price tests OB, bounces weakly
• Price tests same OB again
• Second test produces stronger reaction
• Second touch often better entry
Pattern 3: The Fake-Out
• Price breaks through OB
• Immediately reverses back
• "Stop hunt" or liquidity grab
• Enter after price reclaims OB
Pattern 4: The Ladder
• Multiple OBs stacked like stairs
• Price steps from one OB to next
• Each OB provides support/resistance
• Trade OB-to-OB movements
Pattern 5: The Failed OB
• Price crashes through OB without pause
• OB completely invalidated
• Often signals strong momentum
• Don't fight it, trade the breakout
━━━━━━━━━━━━━━━━━━━━━━━━━━━━
🚀 What Makes This Different?
Unlike basic support/resistance indicators, Order Block Identifier:
• ICT Methodology - Based on proven institutional concepts
• Auto-Timeframe Optimization - Works perfectly on all timeframes
• ATR-Based Detection - Adapts to each instrument's volatility
• Mitigation Tracking - Knows when blocks are no longer valid
• Active Block Highlighting - Shows most relevant opportunity
• Smart Filtering - Only shows high-quality institutional zones
• Visual Clarity - Clean, professional appearance
• Real-Time Updates - Blocks update as price action develops
Based On Professional Concepts:
• ICT Smart Money Concepts (SMC)
• Institutional order flow analysis
• Market maker behavior patterns
• Supply and demand zone theory
━━━━━━━━━━━━━━━━━━━━━━━━━━━━
🙏 If You Find This Helpful
• ⭐ Leave your feedback
• 💬 Share your experience in the comments
• 🔔 Follow for updates and new tools
Questions about Order Blocks? Feel free to ask in the comments.
━━━━━━━━━━━━━━━━━━━━━━━━━━━━
Version History
• v1.0 - Initial release with auto-timeframe detection and ATR-based strength filtering

LiquidityPulse Higher Timeframe Consecutive Candle Run LevelsLiquidityPulse Higher Timeframe Consecutive Candle Run Levels
Research suggests that financial markets can alternate between trend-persistence and mean-reversion regimes, particularly at short (intraday) or very long timeframes. Extended directional moves, whether prolonged intraday rallies or sell-offs, also carry a statistically higher chance of retracing or reversing (Safari & Schmidhuber, 2025). In addition, studies examining support and resistance behaviour show that swing highs or lows formed after strong directional moves may act as structurally and psychologically important price levels, where subsequent price interactions have an increased likelihood of stalling or bouncing rather than passing through directly (Chung & Bellotti, 2021). By highlighting higher-timeframe candle runs and marking their extremal levels, this indicator aims to display areas where directional momentum previously stopped, providing contextual "watch levels" that traders may incorporate into their broader analysis.
How this information is used in the indicator:
When a sequence of consecutive higher-timeframe candles prints in the same direction, the indicator highlights the lower-timeframe chart with a green or red background, depending on whether the higher-timeframe run was bullish or bearish. The highest high (for a bull run) or lowest low (for a bear run) of that sequence forms a recent extremum, and this value is plotted as a swing-high or swing-low level. These levels appear only after the required number of consecutive higher-timeframe candles (set by the user) have closed, and they continue updating as long as the higher-timeframe streak remains intact. A level "freezes" and stops updating only when an opposite-colour higher-timeframe candle closes (e.g., a red candle ending a bull run, or a green candle ending a bear run). Once frozen, the level remains fixed to preserve that structural information for future analysis or retests. The number of past bull/bear levels displayed on the chart is also adjustable in the settings.
Why capture a level after a long directional run:
When price moves in one direction for several consecutive candles (e.g. 4, 5, or more), it reflects strong directional bias, often associated with momentum, liquidity imbalance, or liquidity grabs. Once that sequence breaks, the final level reached marks a point of exhaustion or structural resistance/support, where that bias failed to continue. These inflection points are often used by traders and trading algorithms to assess potential reversals, retests, or breakout setups. By freezing these levels once the run ends, the indicator creates a map of historically significant price zones, allowing traders to observe how price behaves around them over time.
Additional information displayed by the indicator:
Each detected run includes a label showing the run length (the number of consecutive higher-timeframe candles in the streak) along with the source timeframe used for detection. The indicator also displays an overstretch marker: this numerical value appears when the total size of the candle bodies within the run exceeds a user-defined multiple of the average higher-timeframe body size (default: 1.5x). This helps highlight runs that were unusually strong or extended relative to typical volatility. You can also enable alerts that trigger when this overstretch ratio exceeds a higher threshold.
Key Settings
Timeframe: Choose which HTF to analyse (e.g., 15m, 1h, 4h)
Minimum Candle Run Length: Define how many consecutive candles are needed to trigger a level (e.g., 4)
Overstretch Settings: Customize detection threshold and alert trigger (in multiples of average body size)
Background Tints: Enable/disable visual highlights for bull and bear runs
Display Capacity: Choose how many past bull/bear levels to show
How Traders Can Use This Indicator
Traders can:
-Watch levels for retests, reversals, breakouts, or consolidation
-Identify areas where price showed strong directional conviction
-Spot extended or aggressive moves based on overstretch detection
-Monitor how price reacts when retesting prior run levels
-Build confluence with your existing levels, zones, or indicators
Disclaimer
This tool does not reflect true order flow, liquidity, or institutional positioning. It is a visual aid that highlights specific candle behaviour patterns and does not produce predictive signals. All analysis is subject to interpretation, and past price behaviour does not imply future outcomes.
References:
Trends and Reversion in Financial Markets on Time Scales from Minutes to Decades (Sara A. Safari & Christof Schmidhuber, 2025)
Evidence and Behaviour of Support and Resistance Levels in Financial Time Series (Chung & Bellotti, 2021)

Brahmastra Basic1. Core Purpose and Strategy
This is a multi-timeframe (MTF) indicator designed to identify high-probability entry points for a specific trend-following options selling strategy. It works by confirming a trend on higher timeframes (Daily and Hourly) before waiting for a precise entry trigger on a lower timeframe (15-Minute).
The core principle is confluence: ensuring that the Daily trend bias and the Hourly trend momentum are aligned before looking for a trade. This filters out many false signals that can occur when trading on a single timeframe.
IMPORTANT: This indicator MUST be applied to a 15-minute chart to function correctly.
2. How to Read the Visual Signals on Your Chart
The indicator provides several visual cues to guide you through the trading setup from start to finish.
A. Candle Colors: The "Setup is Ready" Signal
The primary signal to start paying attention is the change in candle color.
Aqua Candles: The market is in a Bullish Alignment. This means both the Daily and Hourly trends are bullish. You should now be preparing for a Put Sell entry. The very first aqua candle in a sequence is your "alert candle."
Yellow Candles: The market is in a Bearish Alignment. This means both the Daily and Hourly trends are bearish. You should now be preparing for a Call Sell entry. The very first yellow candle in a sequence is your "alert candle."
B. Entry Signals: The "Execute Trade" Signal
These signals appear only after the alert candle's level has been breached.
Green "PUT SELL" Label (below candle): This is your signal to enter a Put Sell (or a long position). It appears on the close of the 15-minute candle that breaks above the high of the first aqua alert candle.
Red "CALL SELL" Label (above candle): This is your signal to enter a Call Sell (or a short position). It appears on the close of the 15-minute candle that breaks below the low of the first yellow alert candle.
C. Exit Signals: The "Close Position" Signal
Red 'X' (above candle): This is the signal to close your Put Sell position. It appears when the primary daily trend has reversed to bearish.
Green 'X' (below candle): This is the signal to close your Call Sell position. It appears when the primary daily trend has reversed to bullish.
D. Background & EMA Lines: The "Context"
EMA Lines: The indicator plots two key EMAs from the higher timeframes onto your 15-minute chart so you can see the context.
Orange Line: Daily 5 EMA
Blue Line: Hourly 51 EMA
Faint Background Color: After an entry signal appears, the background will remain faintly colored (green for a bullish trade, red for a bearish trade) to remind you that you are in a hypothetical position.
3. The Step-by-Step Strategy Logic
Here is the precise set of rules the indicator follows to generate its signals:
For a PUT Sell (Bullish Trade):
Alignment Check: The indicator first confirms that:
The Daily Close is above the Daily 5 EMA.
AND the Hourly Close is above the Hourly 51 EMA.
Alert Phase: As soon as this alignment is true, the 15-minute candles turn aqua. The indicator internally notes the high of the very first aqua candle.
Entry Trigger: The indicator waits for a 15-minute candle to close above the high of that first alert candle. When this happens, the green "PUT SELL" label is plotted.
Exit Condition: The position is held until the Daily Close crosses back below the Daily 5 EMA. When this happens, the red 'X' exit signal is plotted.
For a CALL Sell (Bearish Trade):
Alignment Check: The indicator first confirms that:
The Daily Close is below the Daily 5 EMA.
AND the Hourly Close is below the Hourly 51 EMA.
Alert Phase: As soon as this alignment is true, the 15-minute candles turn yellow. The indicator internally notes the low of the very first yellow candle.
Entry Trigger: The indicator waits for a 15-minute candle to close below the low of that first alert candle. When this happens, the red "CALL SELL" label is plotted.
Exit Condition: The position is held until the Daily Close crosses back above the Daily 5 EMA. When this happens, the green 'X' exit signal is plotted.

FVG Maxing - Fair Value Gaps, Equilibrium, and Candle Patterns
What this script does
This open-source indicator highlights 3-candle fair value gaps (FVGs) on the active chart timeframe, draws their midpoint ("equilibrium") line, tracks when each gap is mitigated, and optionally marks simple candle patterns (engulfing and doji) for confluence. It is intended as an educational tool to study how price interacts with imbalances.
3-candle bullish and bearish FVG zones drawn as forward-extending boxes.
Equilibrium line at 50% of each gap.
Different styling for mitigated vs unmitigated gaps.
Compact statistics panel showing how many gaps are currently active and filled.
Optional overlays for bullish/bearish engulfing patterns and doji candles.
1. FVG logic (3-candle gaps)
The script focuses on a strict 3-candle definition of a fair value gap:
Three consecutive candles with the same body direction.
The wick of candle 3 is separated from the wick of candle 1 (no overlap).
A bullish gap is created when price moves up fast enough to leave a gap between candle 1 and 3. A bearish gap is the mirror case to the downside.
In Pine, the core detection looks like this:
// Three candles with the same body direction
bull_seq = close > open and close > open and close > open
bear_seq = close < open and close < open and close < open
// Wick gap between candle 1 and candle 3
bull_gap = bull_seq and low > high
bear_gap = bear_seq and high < low
// Final FVG flags
is_bull_fvg = bull_gap
is_bear_fvg = bear_gap
For each detected FVG:
Bullish FVG range: from high up to low (gap below current price).
Bearish FVG range: from low down to high (gap above current price).
Each zone is stored in a custom FVGData structure so it can be updated when price later trades back inside it.
2. Equilibrium line (0.5 of the gap)
Every FVG box gets an optional equilibrium line plotted at the midpoint between its top and bottom:
eq_level = (top + bottom) / 2.0
right_index = extend_boxes ? bar_index + extend_length_bars : bar_index
bx = box.new(bar_index - 2, top, right_index, bottom)
eq_ln = line.new(bar_index - 2, eq_level, right_index, eq_level)
line.set_style(eq_ln, line.style_dashed)
line.set_color(eq_ln, eq_color)
You can use this line as a neutral “fair value” reference inside the zone, or as a simple way to think in terms of premium/discount within each gap.
3. Mitigation rules and styling
Each FVG stays active until price trades back into the gap:
Bullish FVG is considered mitigated when the low touches or moves below the top of the gap.
Bearish FVG is considered mitigated when the high touches or moves above the bottom of the gap.
When that happens, the script:
Marks the internal FVGData entry as mitigated.
Softens the box fill and border colors.
Optionally updates the label text from "BULL EQ / BEAR EQ" to "BULL FILLED / BEAR FILLED".
Can hide mitigated zones almost completely if you only want to see unfilled imbalances.
This allows you to distinguish between current areas of interest and zones that have already been traded through.
4. Candle pattern overlays (engulfing and doji)
For additional confluence, the script can mark simple candle patterns on top of the FVG view:
Bullish engulfing — current candle body fully wraps the previous bearish body and is larger in size.
Bearish engulfing — current candle body fully wraps the previous bullish body and is larger in size.
Doji — candles where the real body is small relative to the full range (high–low).
The detection is based on basic body and range geometry:
curr_body = math.abs(close - open)
prev_body = math.abs(close - open )
curr_range = high - low
body_ratio = curr_range > 0 ? curr_body / curr_range : 1.0
bull_engulfing = close > open and close < open and open <= close and close >= open and curr_body > prev_body
bear_engulfing = close < open and close > open and open >= close and close <= open and curr_body > prev_body
is_doji = curr_range > 0 and body_ratio <= doji_body_ratio
On the chart, they appear as:
Small triangle markers below bullish engulfing candles.
Small triangle markers above bearish engulfing candles.
Small circles above doji candles.
All three overlays are optional and can be turned on or off and recolored in the CANDLE PATTERNS group of inputs.
5. Inputs overview
The script organizes settings into clear groups:
DISPLAY SETTINGS : Show bullish/bearish FVGs, show/hide mitigated zones, box extension length, box border width, and maximum number of boxes.
EQUILIBRIUM : Toggle equilibrium lines, color, and line width.
LABELS : Enable labels, choose whether to label unmitigated and/or mitigated zones, and select label size.
BULLISH COLORS / BEARISH COLORS : Separate fill and border colors for bullish and bearish gaps.
MITIGATED STYLE : Opacity used when a gap is marked as mitigated.
STATISTICS : Toggle the on-chart FVG statistics panel.
CANDLE PATTERNS : Show engulfing patterns, show dojis, colors, and the body-to-range threshold that defines a doji.
6. Statistics panel
An optional table in the corner of the chart summarizes the current state of all tracked gaps:
Total number of FVGs still being tracked.
Number of bullish vs bearish FVGs.
Number of unfilled vs mitigated FVGs.
Simple fill rate: percentage of tracked FVGs that have been marked as mitigated.
This can help you study how a particular market tends to treat gaps over time.
7. How you might use it (examples)
These are usage ideas only, not recommendations:
Study how often your symbol mitigates gaps and where inside the zone price tends to react.
Use higher-timeframe context and then refine entries near the equilibrium line on your trading timeframe.
Combine FVG zones with basic candle patterns (engulfing/doji) as an extra visual anchor, if that fits your process.
Hope you enjoy, give your feedback in the comments!
- officialjackofalltrades

Ultimate Trend System — FINAL MASTER EDITIONUltimate Trend System — FINAL MASTER EDITION
A complete, multi‑layered trend‑detection engine designed for precision execution and clarity.
This final edition fuses trend, momentum, volatility, and filtering into one symmetrical logic system — enabling traders to instantly visualize directional strength and avoid false signals during choppy markets.
🔹 System Overview
The Ultimate Trend System consolidates several classic trading frameworks into a unified model.
It dynamically generates BUY, SELL, and STOP tags directly on the chart — each derived from clean, interlinked conditions that measure both momentum and structure.
In addition, a built‑in information panel summarizes live indicator states for quick decision‑making without checking multiple indicators.
⚙️ Core Logic Components
SMA (20‑period): Identifies trend slope; rising → bullish bias, falling → bearish bias.
VWAP: Defines fair‑value position — Above, Below, or Inside volume‑weighted average price.
QQE‑Lite (RSI): Tracks internal momentum shifts by comparing RSI to its EMA smoothing.
ATR Strength: Classifies current volatility regime as Turbo, Strong, or Weak.
SuperTrend: Confirms structural trend direction using an ATR‑based trailing model.
Choppiness Filter: Suppresses signals when short‑term volatility contracts or range noise dominates.
Fakeout Detection: Prevents false triggers after deceptive breakouts or reversals.
🧩 Execution Logic
BUY Signal: All major trend engines align bullishly, with clean structure and momentum.
SELL Signal: All major engines align bearishly, with clean structure and momentum.
STOP Phase: Appears once per cycle to mark neutral or transition zones; automatically locks further stops until a new entry signal is confirmed.
🟩🟥 Visual Elements
Green Labels: Confirmed bullish entry (BUY).
Red Labels: Confirmed bearish entry (SELL).
Yellow Labels: STOP state (trend exhaustion or consolidation).
Panel: Displays live readings for VWAP, SMA, QQE, ATR regime, and SuperTrend direction.
🧠 Design Philosophy
Built for simplicity, speed, and precision — the Final Master Edition strips away noise without losing analytical depth.
It can serve as a standalone trend system or foundation layer for more advanced frameworks like auto‑execution or multi‑engine HUDs.

EMA SMA Rhythmic Lite Public V1.0 by SRT📌 EMA SMA Rhythmic Lite Public V1.0 by SRT
A clean, fast, non-repainting trend-rhythm indicator designed for swing traders, reversal reads, and structure-based entries. Built on fixed EMAs + SMAs, it offers Engulfing Bars (EB), Long-Tail Body (LTB) signals, rhythmic Flush Dots, and a real-time Bias Table.
Perfect for traders who want clear directional guidance without clutter or over-optimization.
🔶 Key Features
1. Fixed MA Rhythm Engine
MA1: EMA
MA2: EMA
MA3: SMA
MA4: SMA
Stacking forms the core “trend rhythm” for quick bias reading.
2. Engulfing Bars (EB) — Non-Repainting
Detects previous bar only, filters weak signals using ATR size and minimum body %. Outputs EBull and EBear with 20-label cap.
3. Long-Tail Body (LTB)
Identifies exhaustion/reversal areas with tail % thresholds, body position filters, optional body size filter, and ATR thresholds. Produces LTB Bull and LTB Bear.
4. MA Flush Dots
Rhythmic compression markers: bullish at the bottom, bearish at the top — ideal for spotting MA squeezes and momentum resets.
5. Bias Table (Top-Right)
Compact real-time sentiment showing:
MA Bias (Bullish / Bearish / Neutral)
LTB presence (Yes / No)
🔶 Alerts Included
Signal Bar Formed
Bullish Combo
Bearish Combo
All non-repainting (previous bar logic).
🔶 Ideal For
Swing traders
Trend continuation setups
Reversal exhaustion reads
Structure-based entries
Clean, non-spammy signals
🔶 Premium Version Intro
For traders seeking the full rhythm engine, consider the EMA SMA Rhythmic Trend Premium V1.0 by SRT.
It includes advanced rhythm alerts, enhanced LTB logic, optional EMA/SMA dynamic switching, extra visualization features, and customizable MA stacking, providing a comprehensive toolset for serious trend and reversal strategies.
🔶 Notes
Fully non-repainting
Flush markers, labels, and MA visibility are fully user-controlled
Code is locked to preserve original logic and prevent redistribution
Enjoy the rhythm.
- SRT

80% EDGE Rule - TPO Based═════════════════════════════════════════════════════════════
80% EDGE RULE - TPO BASED
═════════════════════════════════════════════════════════════
█ OVERVIEW
The 80% Edge Rule is a high-probability Market Profile concept that identifies when price is likely to traverse the prior session's Value Area. This indicator automates the detection, confirmation, and tracking of 80% EDGE Rule setups using true TPO (Time Price Opportunity) calculations—not volume profile.
When price opens outside the previous day's Value Area and then re-enters and is "accepted" back inside, there is an 80% statistical probability that price will travel to the opposite side of the Value Area. This indicator does all the heavy lifting: calculating the prior session's Value Area, detecting valid setups, confirming acceptance, and tracking progress toward the target.
█ THE 80% EDGE RULE EXPLAINED
The 80% Edge Rule is based on Market Profile theory developed by J. Peter Steidlmayer at the Chicago Board of Trade. The rule states:
❶ If price OPENS OUTSIDE the prior day's Value Area...
❷ And then ENTERS and is ACCEPTED back into the Value Area...
❸ There is an 80% chance price will rotate to the OTHER SIDE of the Value Area.
"Acceptance" is defined as price spending TWO OR MORE TPO periods (typically 30-minute blocks) inside the Value Area. This indicates that the market has accepted these prices as fair value, and the auction process will likely continue through to the opposite boundary.
BULLISH SETUP: Price opens BELOW the prior VAL → Enters and is accepted → Target is VAH
BEARISH SETUP: Price opens ABOVE the prior VAH → Enters and is accepted → Target is VAL
█ HOW THIS INDICATOR WORKS
This indicator performs several automated functions:
1. TPO VALUE AREA CALCULATION
• Analyzes the prior RTH (Regular Trading Hours) session
• Builds a true TPO distribution using 30-minute time blocks
• Each price level receives +1 TPO for each period it was touched
• Calculates POC (Point of Control) as the price with highest TPO count
• Expands from POC using the CME/CBOT standard "two-price" method until 70% of TPOs are captured
• This defines VAH (Value Area High) and VAL (Value Area Low)
2. SETUP DETECTION
• Monitors the RTH open (default 9:30 AM ET)
• Detects if price opened outside the prior Value Area
• Determines setup direction (Bullish or Bearish)
3. ACCEPTANCE MONITORING
• Tracks TPO blocks where price remains inside the Value Area
• Confirms setup when required number of blocks is reached (default: 2)
• Resets count if price exits VA before confirmation
4. TARGET & INVALIDATION TRACKING
• Monitors for target completion (opposite VA boundary)
• Monitors for invalidation (price moves beyond entry VA boundary + buffer)
• Visual feedback on outcome
█ VISUAL ELEMENTS
PRIOR VALUE AREA LINES (Dashed)
• RED DASHED LINE: Prior Day VAH (Value Area High)
• GREEN DASHED LINE: Prior Day VAL (Value Area Low)
• PURPLE DOTTED LINE: Prior Day POC (Point of Control)
TRADE LINES (Solid)
• YELLOW LINE: Entry price (where setup was confirmed)
• CYAN LINE: Target price (opposite VA boundary)
• GREEN LINE: Entry line turns green when target is hit
• GRAY LINES: Both lines turn gray if setup is invalidated
STATUS LABEL
• Floating label showing current setup state
• ORANGE "WATCHING": Setup detected, monitoring for acceptance
• YELLOW "CONFIRMED": Setup confirmed, tracking toward target
• GREEN "TARGET HIT ✓": Target successfully reached
• RED "INVALIDATED ✗": Setup failed, price moved against
DASHBOARD (Top Right Corner)
• Prior VAH: Yesterday's Value Area High
• Prior VAL: Yesterday's Value Area Low
• Prior POC: Yesterday's Point of Control
• Open Price: Today's RTH opening price
• Direction: BULLISH ↑ or BEARISH ↓
• Status: Current setup state
█ CONFIGURABLE SETTINGS
┌────────────────────────────────────────────────────────────
│ TPO SETTINGS
├────────────────────────────────────────────────────────────
│ Tick Size (Default: 0.25) │ • Price increment for TPO calculations
│ • ES/MES: 0.25
│ • NQ/MNQ: 0.25
│ • YM/MYM: 1.0
│ • RTY: 0.1 │ • CL/MCL: 0.01
│ • GC/MGC: 0.1
│
│ Value Area % (Default: 70)
│ • Percentage of TPOs to include in Value Area
│ • Standard is 70% (one standard deviation)
│ • Can adjust 50-90% based on preference
│
│ TPO Block Duration (Default: 30 minutes)
│ • Length of each TPO period
│ • Standard Market Profile uses 30-minute periods
│ • Adjust if using non-standard TPO settings
└────────────────────────────────────────────────────────────
┌────────────────────────────────────────────────────────────
│ 80% EDGE RULE SETTINGS
├────────────────────────────────────────────────────────────
│ TPO Blocks Required for Acceptance (Default: 2)
│ • Number of 30-min periods price must stay inside VA
│ • Standard rule requires 2 periods for acceptance
│ • More conservative: Increase to 3
│ • More aggressive: Reduce to 1 (not recommended)
│
│ Invalidation Distance (Default: 10 points)
│ • Buffer beyond VA boundary before setup is invalidated
│ • Bullish: Invalidates if LOW goes below VAL minus this distance
│ • Bearish: Invalidates if HIGH goes above VAH plus this distance
│ • Adjust based on product volatility and your risk tolerance
│
│ Fade Delay (Default: 5 minutes)
│ • How long entry/target lines stay visible after outcome
│ • Lines and floating label disappear after this delay
│ • Dashboard retains the outcome status until next session
└────────────────────────────────────────────────────────────
┌────────────────────────────────────────────────────────────
│ SESSION SETTINGS
├────────────────────────────────────────────────────────────
│ RTH Session (Default: 0930-1600)
│ • Regular Trading Hours window
│ • This determines which bars are used for TPO calculation
│ • Also determines when RTH "open" is detected
│
│ PRODUCT-SPECIFIC RTH SESSIONS:
│ • Equity Index Futures (ES, NQ, YM, RTY): 0930-1600
│ • Crude Oil (CL): 0900-1430 (pit session)
│ • Gold (GC): 0820-1330 (pit session)
│ • Treasury Bonds/Notes: 0720-1400
│ • Forex Futures: Varies by product
│
│ Timezone (Default: America/New_York)
│ • Timezone for session calculations
│ • Options: New York, Chicago, Los Angeles, UTC
│ • Use exchange timezone for accurate session detection
└────────────────────────────────────────────────────────────
┌────────────────────────────────────────────────────────────
│ VISUAL SETTINGS
├────────────────────────────────────────────────────────────
│ Show Prior VA Lines: Toggle VAH/VAL/POC lines on/off
│ Show Entry/Target Lines: Toggle trade-related lines on/off
│ VAH Color: Color for Value Area High line
│ VAL Color: Color for Value Area Low line
│ POC Color: Color for Point of Control line
│ Entry Line Color: Color for entry price line
│ Target Line Color: Color for target price line
│ Target Hit Color: Color when target is reached (default: green)
│ Line Width: Thickness of all lines (1-5)
└────────────────────────────────────────────────────────────
┌────────────────────────────────────────────────────────────
│ DEBUG SETTINGS
├────────────────────────────────────────────────────────────
│ Show Debug Info: Displays additional diagnostic information
│ • Session High/Low of prior day
│ • Current RTH status
│ • Current TPO block number
│ • Outcome timestamp
│ • Useful for troubleshooting or verifying calculations
└────────────────────────────────────────────────────────────
█ ALERTS
This indicator includes three configurable alerts:
① SETUP CONFIRMED
• Triggers when acceptance criteria is met
• Includes entry price and target price in alert message
② TARGET HIT
• Triggers when price reaches the opposite VA boundary
• Confirms successful completion of the 80% Rule setup
③ INVALIDATED
• Triggers when price moves beyond the invalidation threshold
• Signals that the setup has failed
To enable alerts:
1. Ensure "Enable Alerts" is checked in indicator settings
2. Right-click on the indicator → "Add Alert"
3. Select the condition you want to be alerted on
4. Configure notification method (popup, email, webhook, etc.)
█ RECOMMENDED USAGE
TIMEFRAME:
• Best used on 5-minute, 15-minute, or 30-minute charts
• The chart timeframe should divide evenly into 30 minutes
• Ensure sufficient historical bars are loaded for prior session calculation
BEST PRACTICES:
• Wait for full confirmation (2 TPO blocks inside VA) before considering entry
• Use the target line as your profit objective
• Consider the invalidation level for stop-loss placement
• Monitor the dashboard for real-time setup status
• Combine with other confluence factors (order flow, support/resistance, etc.)
IMPORTANT NOTES:
• This indicator calculates TRUE TPO-based Value Area, not volume profile
• Prior day VA is recalculated at each new session
• The 80% Rule is a statistical tendency, not a guarantee
• Always use proper risk management
█ ADJUSTING FOR DIFFERENT PRODUCTS
This indicator defaults to Equity Index Futures (ES, NQ, etc.) with:
• RTH Session: 0930-1600
• Timezone: America/New_York
• Tick Size: 0.25
FOR OTHER PRODUCTS, ADJUST:
CRUDE OIL (CL/MCL):
• RTH Session: 0900-1430
• Tick Size: 0.01
GOLD (GC/MGC):
• RTH Session: 0820-1330
• Tick Size: 0.10
TREASURY FUTURES (ZB, ZN):
• RTH Session: 0720-1400
• Tick Size: 0.03125 (ZB) or 0.015625 (ZN)
E-MINI DOW (YM/MYM):
• RTH Session: 0930-1600
• Tick Size: 1.0
RUSSELL 2000 (RTY):
• RTH Session: 0930-1600
• Tick Size: 0.10
Always verify the RTH session times and tick sizes for your specific product and exchange.
█ DISCLAIMER
This indicator is provided for educational and informational purposes only. It is not financial advice and should not be construed as a recommendation to buy or sell any financial instrument. Trading futures and other leveraged products involves substantial risk of loss and is not suitable for all investors.
Past performance is not indicative of future results. The 80% Edge Rule is a statistical observation based on Market Profile theory and does not guarantee any specific outcome. Always conduct your own analysis and use proper risk management.

One Point Global Net Liquidity The "Fuel" Behind the MarketMost traders look at price action, but price is often just a reflection of the money supply available in the system. This indicator tracks Global Net Liquidity—the actual amount of fiat currency available to flow into risk assets like Crypto and Equities.
Unlike standard "Money Supply" (M2) charts, this indicator focuses on Central Bank Balance Sheets, which is a more direct proxy for "Quantitative Easing" (QE) and "Quantitative Tightening" (QT).
How It Works (The Formula)
This script aggregates the balance sheets of the "Big 4" Central Banks, which represent ~90% of global liquidity. It automatically converts all values to USD Trillions for a standardized view.
{Global Liquidity} = {US Net Liquidity} + {ECB} + {PBoC} + {BoJ}
1. US Net Liquidity (The "Trader's" Formula) We do not just use the Fed's Total Assets. We subtract the money that is "stuck" outside the private economy:
(+) Fed Balance Sheet: Total Assets.
(-) TGA (Treasury General Account): The government's checking account. When this goes up, liquidity is drained from markets.
(-) RRP (Reverse Repo): Money parked by banks at the Fed overnight. When this goes up, liquidity is removed from the system.
2. Global Additions
ECB (Eurozone): Converted to USD.
PBoC (China): Converted to USD.
BoJ (Japan): Converted to USD.
How to Use This Indicator This indicator is designed as an Overlay on the main chart (using the Left Scale).
Correlation: Generally, when the Orange Line (Liquidity) trends up, Bitcoin and the S&P 500 trend up. When Central Banks tighten (line down), risk assets struggle.
The "Divergence" Signal (Alpha):
Bullish: If Price makes a Lower Low but Liquidity makes a Higher Low, it often signals seller exhaustion and a potential bottom.
Bearish: If Price makes a New High but Liquidity fails to follow (or drops), the rally may be unsupported and prone to a reversal.
Settings
Scale: This indicator is pinned to the Scale Left to allow it to overlay price action without distortion.
Data: Uses daily data from ECONOMICS and FRED feeds.

Volume Trend Analysis Pro📘 How to Use – Volume Blast Analyzer Pro (VBA Pro)
High-Accuracy Volume Blast • Breakout Model • Wyckoff Spring/Upthrust • Trend-Volume Matrix • SIVA Volume Analyzer
🧩 1. Overview
VBA Pro is a complete volume-based trading system that detects:
🔥 Volume Blasts (Bull/Bear/Neutral)
📈 True & False Breakouts
🟦 Wyckoff Springs & Upthrusts
📊 Trend–Volume Matrix (11×11 system)
🟪 SIVA Volume Analyzer states
🟧 Volume Spike events
🔍 Multi-filter confirmation
This tool identifies both momentum continuation and manipulation-based reversals, making it ideal for intraday, swing, and SMC/Wyckoff traders.
🟦 2. Core Components:
A. Volume Blast Detector
Triggered when any of these filters activate:
RVOL Blast (Relative Volume explosion)
Range Blast (Large candle body + large volume)
Volume × ATR Blast (Volatility-weighted volume surge)
Color System (by direction):
🟢 Bullish Blast
🔴 Bearish Blast
⚪ Neutral Blast
B. Wyckoff Model (Spring & Upthrust)
Automatically identifies:
Spring → Bullish liquidity sweep + reversal context
Upthrust → Bearish liquidity sweep + reversal context
Tooltip includes:
✔ Liquidity sweep
✔ Support/Resistance test
✔ Exhaustion or aggressive absorption
✔ Reversal probability
C. Breakout Detector (True/False)
True Breakout when:
Volume strong
Candle closes beyond levels
Trend aligned
No rejection wick
False Breakout when:
Wick rejection
Low confirmation volume
Immediate rejection back inside range
Plot:
TrBu → True Bull Breakout
TrBe → True Bear Breakout
❌ False Breakouts (Bull/Bear)
D. Trend–Volume Matrix (TVM 11×11)
Plots real-time market structure using:
Trend Value (–10 → +10)
Volume Value (–10 → +10)
Quadrants show:
Trend Continuation (Top-Right)
Volume Divergence (Top-Left)
Weakening Trend (Bottom-Right)
Distribution / Manipulation (Bottom-Left)
A 🔵 dot marks current market position.
Volume Trend Matrix shows where the market is sitting:
Top Right (green): Trend ↑ and Volume ↑ → strong confirmed up trend.
Top Left (red): Trend ↓ but Volume ↑ → strong sell momentum.
Bottom Right (blue): Trend ↑ but Volume ↓ → uptrend losing steam.
Bottom Left (yellow): Trend ↓ and Volume ↓ → weak bearish drift.
Dynamic Candle Coloring: Candles are colored by trend only: green for uptrends, red for downtrends, and orange near reversals.
Threshold Fills: The oscillator region is shaded green above +10 (healthy uptrend) and red
below -10 (strong downtrend) for instant confidence.
E. SIVA Volume Analyzer
Color-coded volume states:
🔥 Volume Spike
🟢 Higher Volume
🔴 Lower Volume
🟣 Extremely Low Volume
⚪ Neutral
🟩/🟥 Trend-confirming Volume
📈 3. Trading Examples
🔵 Bullish Setup:
Spring detected
Bullish Blast
Trend Value > 0
True Bull Breakout (optional)
Liquidity confirmation
🔴 Bearish Setup:
Upthrust detected
Bearish Blast
Trend Value < 0
True Bear Breakout
Weak volume pullback
🔔 4. Alerts
Alerts trigger for:
Volume Blast
Spring / Upthrust
Volume Spike
True & False Breakouts
Liquidity engagement
Trend–Volume quadrant changes
🛠 5. Settings Guide
All modules can be toggled independently:
Volume Blast Detector
Wyckoff Model
Breakout Model
Volume Spike Detector
Trend–Volume Matrix
Candle Colors
Label Shapes
🧠 6. Best Practices
Combine Trend–Volume Matrix + Blast for best confirmation
Avoid trading during neutral/grayed volume states
Springs/Upthrusts are strongest after consolidation
Use Breakout Model to avoid fakeouts
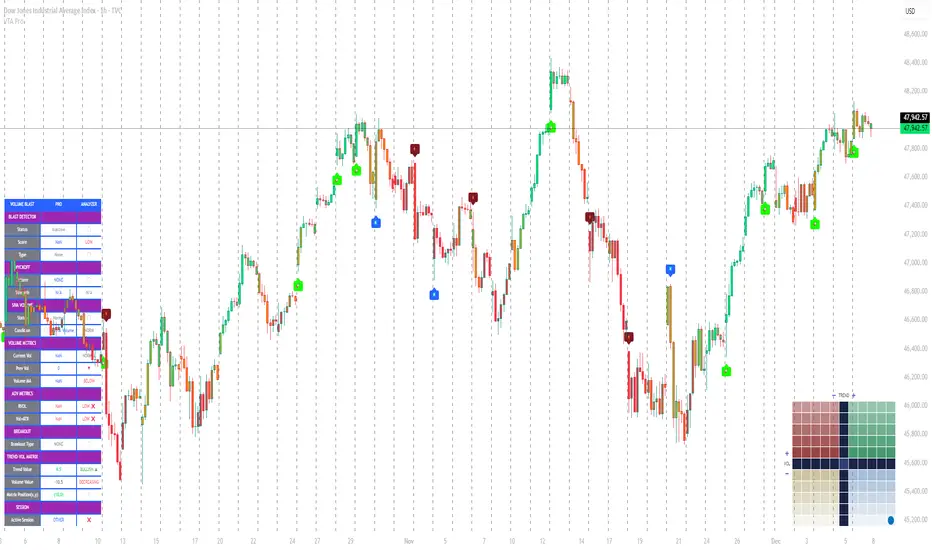
Obsidian Flux Matrix# Obsidian Flux Matrix | JackOfAllTrades
Made with my Senior Level AI Pine Script v6 coding bot for the community!
Narrative Overview
Obsidian Flux Matrix (OFM) is an open-source Pine Script v6 study that fuses social sentiment, higher timeframe trend bias, fair-value-gap detection, liquidity raids, VWAP gravitation, session profiling, and a diagnostic HUD. The layout keeps the obsidian palette so critical overlays stay readable without overwhelming a price chart.
Purpose & Scope
OFM focuses on actionable structure rather than marketing claims. It documents every driver that powers its confluence engine so reviewers understand what triggers each visual.
Core Analytical Pillars
1. Social Pulse Engine
Sentiment Webhook Feed: Accepts normalized scores (-1 to +1). Signals only arm when the EMA-smoothed value exceeds the `sentimentMin` input (0.35 by default).
Volume Confirmation: Requires local volume > 30-bar average × `volSpikeMult` (default 2.0) before sentiment flags.
EMA Cross Validation: Fast EMA 8 crossing above/below slow EMA 21 keeps momentum aligned with flow.
Momentum Alignment: Multi-timeframe momentum composite must agree (positive for longs, negative for shorts).
2. Peer Momentum Heatmap
Multi-Timeframe Blend: RSI + Stoch RSI fetched via request.security() on 1H/4H/1D by default.
Composite Scoring: Each timeframe votes +1/-1/0; totals are clamped between -3 and +3.
Intraday Readability: Configurable band thickness (1-5) so scalpers see context without losing space.
Dynamic Opacity: Stronger agreement boosts column opacity for quick bias checks.
3. Trend & Displacement Framework
Dual EMA Ribbon: Cyan/magenta ribbon highlights immediate posture.
HTF Bias: A higher-timeframe EMA (default 55 on 4H) sets macro direction.
Displacement Score: Body-to-ATR ratio (>1.4 default) detects impulses that seed FVGs or VWAP raids.
ATR Normalization: All thresholds float with volatility so the study adapts to assets and regimes.
4. Intelligent Fair Value Gap (FVG) System
Gap Detection: Three-candle logic (bullish: low > high ; bearish: high < low ) with ATR-sized minimums (0.15 × ATR default).
Overlap Prevention: Price-range checks stop redundant boxes.
Spacing Control: `fvgMinSpacing` (default 5) avoids stacking from the same impulse.
Storage Caps: Max three FVGs per side unless the user widens the limit.
Session Awareness: Kill zone filters keep taps focused on London/NY if desired.
Auto Cleanup: Boxes delete when price closes beyond their invalidation level.
5. VWAP Magnet + Liquidity Raid Engine
Session or Rolling VWAP: Toggle resets to match intraday or rolling preferences.
Equal High/Low Scanner: Looks back 20 bars by default for liquidity pools.
Displacement Filter: ATR multiplier ensures raids represent genuine liquidity sweeps.
Mean Reversion Focus: Signals fire when price displaces back toward VWAP following a raid.
6. Session Range Breakout System
Initial Balance Tracking: First N bars (15 default) define the session box.
Breakout Logic: Requires simultaneous liquidity spikes, nearby FVG activity, and supportive momentum.
Z-Score Volume Filter: >1.5σ by default to filter noisy moves.
7. Lifestyle Liquidity Scanner
Volume Z-Scores: 50-bar baseline highlights statistically significant spikes.
Smart Money Footprints: Bottom-of-chart squares color-code buy vs sell participation.
Panel Memory: HUD logs the last five raid timestamps, direction, and normalized size.
8. Risk Matrix & Diagnostic HUD
HUD Structure: Table in the top-right summarizes HTF bias, sentiment, momentum, range state, liquidity memory, and current risk references.
Signal Tags: Aggregates SPS, FVG, VWAP, Range, and Liquidity states into a compact string.
Risk Metrics: Swing-based stops (5-bar lookback) + ATR targets (1.5× default) keep risk transparent.
Signal Families & Alerts
Social Pulse (SPS): Volume-confirmed sentiment alignment; triangle markers with “SPS”.
Kill-Zone FVG: Session + HTF alignment + FVG tap; arrow markers plus SL/TP labels.
Local FVG: Captures local reversals when HTF bias has not flipped yet.
VWAP Raid: Equal-high/low raids that snap toward VWAP; “VWAP” label markers.
Range Breakout: Initial balance violations with liquidity and imbalance confirmation; circle markers.
Liquidity Spike: Z-score spikes ≥ threshold; square markers along the baseline.
Visual Design & Customization
Theme Palette: Primary background RGB (12,6,24). Accent shading RGB (26,10,48). Long accents RGB (88,174,255). Short accents RGB (219,109,255).
Stylized Candles: Optional overlay using theme colors.
Signal Toggles: Independently enable markers, heatmap, and diagnostics.
Label Spacing: Auto-spacing enforces ≥4-bar gaps to prevent text overlap.
Customization & Workflow Notes
Adjust ATR/FVG thresholds when volatility shifts.
Re-anchor sentiment to your webhook cadence; EMA smoothing (default 5) dampens noise.
Reposition the HUD by editing the `table.new` coordinates.
Use multiples of the chart timeframe for HTF requests to minimize load.
Session inputs accept exchange-local time; align them to your market.
Performance & Compliance
Pure Pine v6: Single-line statements, no `lookahead_on`.
Resource Safe: Arrays trimmed, boxes limited, `request.security` cached.
Repaint Awareness: Signals confirm on close; alerts mirror on-chart logic.
Runtime Safety: Arrays/loops guard against `na`.
Use Cases
Measure when social sentiment aligns with structure.
Plan ICT-style intraday rebalances around session-specific FVG taps.
Fade VWAP raids when displacement shows exhaustion.
Watch initial balance breaks backed by statistical volume.
Keep risk/target references anchored in ATR logic.
Signal Logic Snapshot
Social Pulse Long/Short: `sentimentEMA` gated by `sentimentMin`, `volSpike`, EMA 8/21 cross, and `momoComposite` sign agreement. Keeps hype tied to structural follow-through.
Kill-Zone FVG Long/Short: Requires session filter, HTF EMA bias alignment, and an active FVG tap (`bullFvgTap` / `bearFvgTap`). Labels include swing stops + ATR targets pulled from `swingLookback` and `liqTargetMultiple`.
Local FVG Long/Short: Uses `localBullish` / `localBearish` heuristics (EMA slope, displacement, sequential closes) to surface intraday reversals even when HTF bias has not flipped.
VWAP Raids: Detect equal-high/equal-low sweeps (`raidHigh`, `raidLow`) that revert toward `sessionVwap` or rolling VWAP when displacement exceeds `vwapAlertDisplace`.
Range Breakouts: Combine `rangeComplete`, breakout confirmation, liquidity spikes, and nearby FVG activity for statistically backed initial balance breaks.
Liquidity Spikes: Volume Z-score > `zScoreThreshold` logs direction, size, and timestamp for the HUD and optional review workflows.
Session Logic & VWAP Handling
Kill zone + NY session inputs use TradingView’s session strings; `f_inSession()` drives both visual shading and whether FVG taps are tradeable when `killZoneOnly` is true.
Session VWAP resets using cumulative price × volume sums that restart when the daily timestamp changes; rolling VWAP falls back to `ta.vwap(hlc3)` for instruments where daily resets are less relevant.
Initial balance box (`rangeBars` input) locks once complete, extends forward, and stays on chart to contextualize later liquidity raids or breakouts.
Parameter Reference
Trend: `emaFastLen`, `emaSlowLen`, `htfResolution`, `htfEmaLen`, `showEmaRibbon`, `showHtfBiasLine`.
Momentum: `tf1`, `tf2`, `tf3`, `rsiLen`, `stochLen`, `stochSmooth`, `heatmapHeight`.
Volume/Liquidity: `volLookback`, `volSpikeMult`, `zScoreLen`, `zScoreThreshold`, `equalLookback`.
VWAP & Sessions: `vwapMode`, `showVwapLine`, `vwapAlertDisplace`, `killSession`, `nySession`, `showSessionShade`, `rangeBars`.
FVG/Risk: `fvgMinTicks`, `fvgLookback`, `fvgMinSpacing`, `killZoneOnly`, `liqTargetMultiple`, `swingLookback`.
Visualization Toggles: `showSignalMarkers`, `showHeatmapBand`, `showInfoPanel`, `showStylizedCandles`.
Workflow Recipes
Kill-Zone Continuation: During the defined kill session, look for `killFvgLong` or `killFvgShort` arrows that line up with `sentimentValid` and positive `momoComposite`. Use the HUD’s risk readout to confirm SL/TP distances before entering.
VWAP Raid Fade: Outside kill zone, track `raidToVwapLong/Short`. Confirm the candle body exceeds the displacement multiplier, and price crosses back toward VWAP before considering reversions.
Range Break Monitor: After the initial balance locks, mark `rangeBreakLong/Short` circles only when the momentum band is >0 or <0 respectively and a fresh FVG box sits near price.
Liquidity Spike Review: When the HUD shows “Liquidity” timestamps, hover the plotted squares at chart bottom to see whether spikes were buy/sell oriented and if local FVGs formed immediately after.
Metadata
Author: officialjackofalltrades
Platform: TradingView (Pine Script v6)
Category: Sentiment + Liquidity Intelligence
Hope you Enjoy!

Rhythmic EMAs Lite Public V1.0📌 Rhythmic EMAs Lite — Public V1.0
A clean, fast, and non-repainting trend-rhythm indicator built around fixed EMAs + SMAs, Engulfing Bars (EB), Long-Tail Body (LTB) signals, Flush Dots, and a real-time Bias Table.
Designed for traders who want uncluttered directional clarity without over-optimization or noisy filters.
🔶 What This Indicator Does
1. Fixed MA Rhythm Engine (3-7-40-150)
MA1: EMA
MA2: EMA
MA3: SMA
MA4: SMA
The stacking structure forms the core “trend rhythm”.
2. Engulfing Bars (EB) — Non-Repainting
Reads the previous completed bar only.
Filters weak signals using:
ATR size (global)
Minimum body %
Outputs EBull and EBear with 20-label cap.
3. Long-Tail Body (LTB)
A precision reversal-exhaustion read using:
Tail % thresholds
Body position (top / bottom 55%)
Minimum body % (optional)
ATR threshold
Produces LTB Bull and LTB Bear.
4. MA Flush Dots
A rhythmic compression marker:
Bullish at bottom of structure
Bearish at top of structure
Great for identifying MA squeezes and momentum resets.
5. Bias Table (Top-Right)
Compact real-time sentiment showing:
MA Bias (Bullish / Bearish / Neutral)
LTB presence (Yes / No)
Updates based on timeframe pacing.
🔶 Alerts Included
Signal Bar Formed
Bullish Combo
Bearish Combo
All non-repainting (previous bar logic).
🔶 Ideal For
Swing traders
Trend continuation setups
Reversal exhaustion reads
Structure-based entries
Clean, non-spammy signals
🔶 Notes
Fully non-repainting
All Flush markers, labels, and MA visibility are user-controlled
Code protected to preserve original logic and prevent redistribution
🔶 Premium Upgrade (Optional)
For traders seeking advanced capabilities, including enhanced alerting, dynamic MA switching, and more flexible LTB detection, check out Rhythmic EMAs Lite Premium.
The Premium version builds on the same reliable non-repainting engine, offering extra tools for precise entries and exits.
Enjoy the rhythm.
— BadgerGo1314
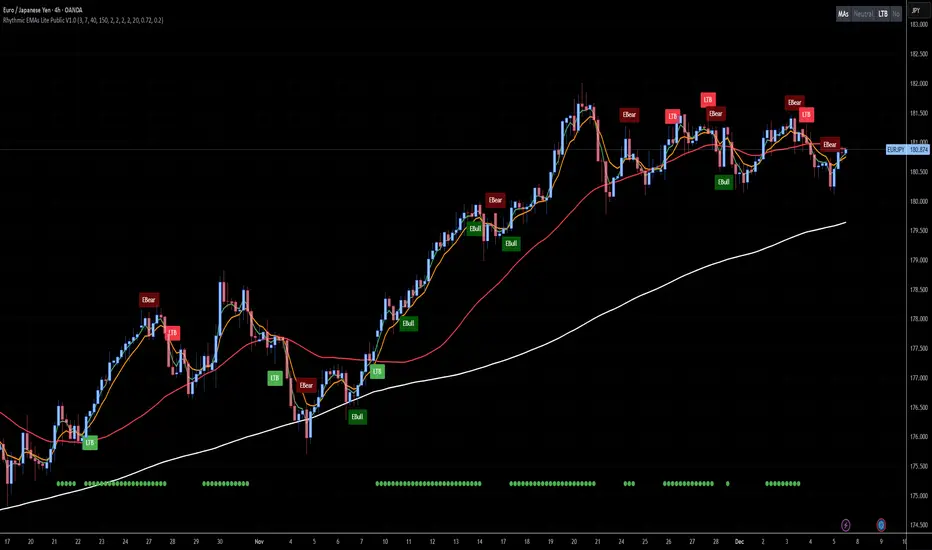
FCPO MASTER v6 – Sideway + Breakout + OB + FVG (TUPLE SAFE)TL;DR cepat
1. Gunakan M5 untuk entry & OB/FVG confirmation.
2. Gunakan M15 untuk confirm trend/false breakout.
3. Gunakan H1 untuk bias arah (overall market).
4. Entry hanya bila signal + OB/FVG/candle rejection (script buatkan).
5. SL 5–8 tick, TP 10–25 tick ikut setup (sideway vs breakout).
6. Follow checklist setiap trade — jangan lompat.
________________________________________
Setup awal (1–2 min)
1. Pasang script FCPO Sideway MASTER – OB + Imbalance + Confirmation di TradingView.
2. Timeframes: buka M5, M15, H1 (susun 3 chart atau 1 chart multi-timeframe).
3. Input default: ATR14, Breakout Buffer 5 tick, RangeLen 20, ADX14, TP12, SL8. (Kau boleh tweak nanti).
4. Aktifkan alerts pada BUY Confirm / SELL Confirm / Sideway Buy / Sideway Sell.
________________________________________
Step-by-step trading process
1) Mulakan dengan H1 — tentukan bias HTF
• Lihat H1 untuk jawapan: Trend Up / Down / Sideway.
• Rule ringkas:
o ADX H1 > 20 + price above H1 EMA → bias Bull
o ADX H1 > 20 + price below H1 EMA → bias Bear
o ADX H1 < 20 → market HTF sideway (no strong bias)
Kenapa: H1 bagi kau idea “kalau breakout pada M5, patut follow atau tolak”.
________________________________________
2) Pergi ke M15 — confirm trend & valid breakout
• M15 kena setuju dengan idea breakout.
o Untuk strong breakout: M15 kena tunjuk candle close di atas/bawah range + volume naik.
o Kalau M5 breakout tapi M15 tak setuju (M15 masih sideway) → treat as fakeout. Jangan masuk.
________________________________________
3) M5 — cari entry & confirmation (OB/FVG + candle)
• M5 adalah tempat kau buat keputusan masuk.
• Tunggu script keluarkan Sideway Buy/Sell atau Breakout Buy/Sell.
• CONFIRM entry mesti ada sekurang-kurangnya 1 dari:
o Bull/Bear Order Block searah signal (script detect).
o FVG / Imbalance zone dipenuhi & price retest.
o Candle rejection (pinbar / bearish/bullish engulfing) pada zone.
Jika tiada confirmation → no trade.
________________________________________
4) Checklist sebelum tekan Buy/Sell (MUST)
• H1 bias tidak melawan trade (prefer sama arah).
• M15 confirm breakout / trend or neutral.
• Script keluarkan signal (sideway or breakout).
• OB or FVG atau candle rejection ada.
• ATR kenaikan jika breakout (untuk breakout trade).
• Volume spike jika breakout.
• Risk:SL <= 2% akaun (position sizing).
Kalau semua ticked → boleh entry.
________________________________________
5) Setting SL / TP & position sizing
• Sideway (scalp): SL = 5–8 tick, TP = 8–12 tick.
• Breakout (trend): SL = 8–12 tick, TP = 15–25+ tick (trail later).
• Position sizing: Risk per trade 1–2%.
o Lot size = (Account Risk RM × 1 tick value) / (SL ticks × tickValue) — (kalau kau gunakan fixed tick value, adjust ikut lot).
(Script tunjuk SL & TP label — follow itu.)
________________________________________
6) Entry types
• A. Sideway Reversal (M5)
o Signal: Sideway Buy / Sideway Sell
o Confirm: OB/FVG or rejection candle at range bottom/top
o Trade: scalp target 8–12 tick, tight SL 5–8 tick
• B. Breakout (M5 entry, M15 confirm)
o Signal: Breakout Buy/Sell (Strong)
o Confirm: ATR expanding + volume spike + M15 alignment
o Trade: trend follow, TP 15–25 tick, trailing stop active
• C. Retest Entry
o Breakout happens, price returns to retest range / OB / FVG → wait for rejection candle then enter. Safer.
________________________________________
7) Trailing & exit rules
• Jika useTrail = true script plots trailing stop (ATR × multiplier).
• Exit rules:
1. Hit TP → close.
2. Hit SL → close.
3. If trailing stop hit → close.
4. If opposing confirmed signal muncul (e.g., SELL confirm while long) → consider close early.
5. If H1 bias flips strongly vs trade → tighten stop or close.
________________________________________
8) Multiple signals & scaling
• Never add to losing position (no averaging down).
• If want scale-in on confirmed trend: add 1 partial size after price moves +10–12 tick in favor and shows continuation candle + no bearish OB/FVG.
• Keep aggregated risk within your max (2–3%).
________________________________________
9) Example trade walkthrough (concrete)
• RangeHigh = 4065, RangeLow = 4035 (contoh).
• Market sideway M5.
Case A — Sideway Sell:
1. Price touches 4064–4065, script shows sidewaySell.
2. Lihat OB: ada bear OB zone di 4062–4066 → confirm.
3. Candle rejection (bearish pinbar) muncul → enter SELL M5.
4. Set SL = 5 tick above rangeHigh = 4070, TP = 10 tick → 4055.
5. Trail jika price turun > 8 tick: aktifkan trailing.
6. Close at TP or trail/SL.
Case B — Breakout Buy:
1. Price closes above 4065 + 5 tick buffer = 4070 on M5. Script shows trueBreakUp.
2. M15 shows candle close above M15 resistance + volume spike → confirm.
3. Enter BUY, SL = 8 tick below entry, TP initial 20 tick, trail with ATR×1.5.
4. Move stop to breakeven after +10 tick, scale out half at +12 tick, leave rest to trail.
________________________________________
10) Journal & review
• Semua trade: record entry time, TF, reason (which confirmations), SL/TP, result, lesson.
• Weekly review: check which confirmation worked best (OB vs FVG vs candle) and tweak settings.
________________________________________
11) Tweaks / optimisations cepat
• Jika terlalu banyak false sideway signals → kurangkan touchDist ke 2 tick.
• Kalau fakeout breakout banyak → tambah tickBuf ke 6–8.
• Nak lebih konservatif → cuma trade breakout yang juga setuju M15.
________________________________________
12) Alerts & execution (practical)
• Pasang alert pada BUY Confirm / SELL Confirm (script).
• Kalau kau guna broker yang support one-click order, siap sediakan template order (SL/TP default).
• Kalau manual, bila alert masuk: buka M5, cepat confirm OB/FVG & candle rejection → entry.
________________________________________
Quick reference table (handy)
• TF utama entry: M5
• Confirm mid-TF: M15
• Bias HTF: H1
• Sideway SL/TP: SL 5–8, TP 8–12
• Breakout SL/TP: SL 8–12, TP 15–25+
• Mandatory confirmation: (Script signal) + (OB or FVG or candle)
