[blackcat] L2 Bull Bear Convergence Divergence (BBCD)Level: 2
Background
A bull market is gaining ground and is economically sound, while a bear market is declining and most stocks are depreciating. The actual origins of these terms are unclear, but one reason could be that bulls attack by pulling their horns up while bears attack by brushing their paws down.
Function
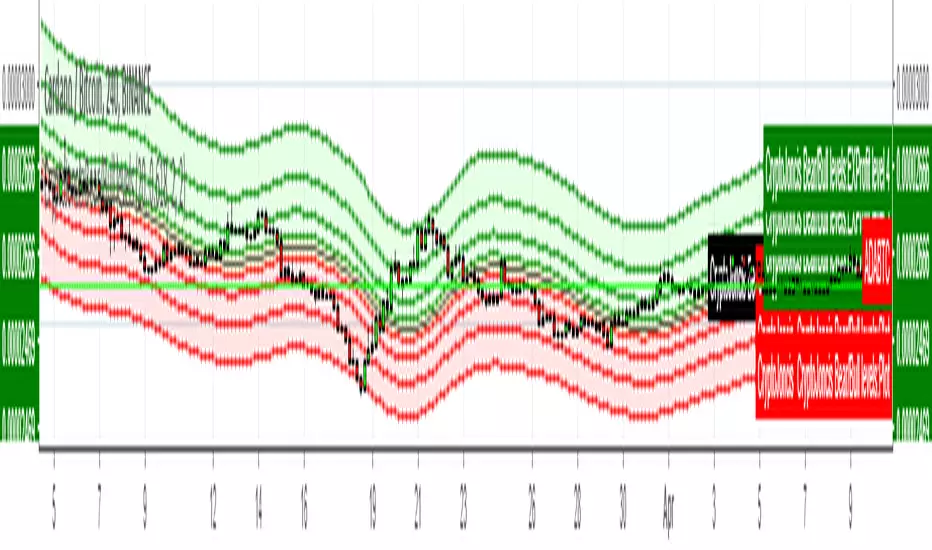
L2 Bull Bear Convergence Divergence (BBCD) disclose the convergence divergence of the bull bear as a market opinion indicator. It tells you the opinion of those who are directly involved with the markets. As a trader, understanding how the convergence divergence of the bull bear works can be of great help. I inherited the traditional MACD expression method, and added golden cross (yellow cross) and dead cross (fuchsia cross) prompts, as well as bottom divergence (lime cross) and top divergence (red cross) prompts.
Key Signal
bbd --> bull bear fast line
bbdsupport --> bull bear slow line and support level
bbdgx --> bull bear gold cross in yellow
bbddx --> bull bear dead cross in fuchsia
bbotdiverg --> bull bear bottom divergence alert in lime cross
btopdiverg --> bull bear top divergence alert in red cross
Pros and Cons
Pros:
1. it can help to see the strength change of a trend in time
2. visual bottom and top divergence alerts are provided
Cons:
1. it disclose the strength change better than price change
Remarks
Bull Bear Convergence Divergence (BBCD) is new.
Readme
In real life, I am a prolific inventor. I have successfully applied for more than 60 international and regional patents in the past 12 years. But in the past two years or so, I have tried to transfer my creativity to the development of trading strategies. Tradingview is the ideal platform for me. I am selecting and contributing some of the hundreds of scripts to publish in Tradingview community. Welcome everyone to interact with me to discuss these interesting pine scripts.
The scripts posted are categorized into 5 levels according to my efforts or manhours put into these works.
Level 1 : interesting script snippets or distinctive improvement from classic indicators or strategy. Level 1 scripts can usually appear in more complex indicators as a function module or element.
Level 2 : composite indicator/strategy. By selecting or combining several independent or dependent functions or sub indicators in proper way, the composite script exhibits a resonance phenomenon which can filter out noise or fake trading signal to enhance trading confidence level.
Level 3 : comprehensive indicator/strategy. They are simple trading systems based on my strategies. They are commonly containing several or all of entry signal, close signal, stop loss, take profit, re-entry, risk management, and position sizing techniques. Even some interesting fundamental and mass psychological aspects are incorporated.
Level 4 : script snippets or functions that do not disclose source code. Interesting element that can reveal market laws and work as raw material for indicators and strategies. If you find Level 1~2 scripts are helpful, Level 4 is a private version that took me far more efforts to develop.
Level 5 : indicator/strategy that do not disclose source code. private version of Level 3 script with my accumulated script processing skills or a large number of custom functions. I had a private function library built in past two years. Level 5 scripts use many of them to achieve private trading strategy.
Penunjuk Pine Script®