Market Bias (CEREBR)Hello Everyone. I hope you are all doing great. It's been a long time since I posted my first script here, and I got a lot of response from that.
So, I thought I should share this script also to everyone, and anyone that may find it useful. Personally, I use it to tell the general market conditions.
Here's how I works : The script tries to determine the overall direction of the market, using smoothed Heiken Ashi candles. The coloring system (using bright and dark colors) is an attempt to detect strong market and weak market conditions. There's also an oscillator within the script, but for now it isn't plotted. Credits to @jackvmk, I used part of his open-script code in this indicator.\
I have considered using the slope of the indicator plot as a filter for ranging market conditions. The plot goes relatively flat in 'flat' markets. However, I have not done anything about that yet. Maybe some other time.
I hope you find this useful. If you find a way to use this, please share it with the community in the comment section.
NOTE: THIS IS BY NO MEANS FINANCIAL ADVICE. You'll have to make your studies and come up with a way to apply this indicator to your trading style and strategy.
By the way, I would be going with the name 'CEREBR' for any subsequent scripts I release from now on.
Happy Trading, guys.
Cari dalam skrip untuk "bias"

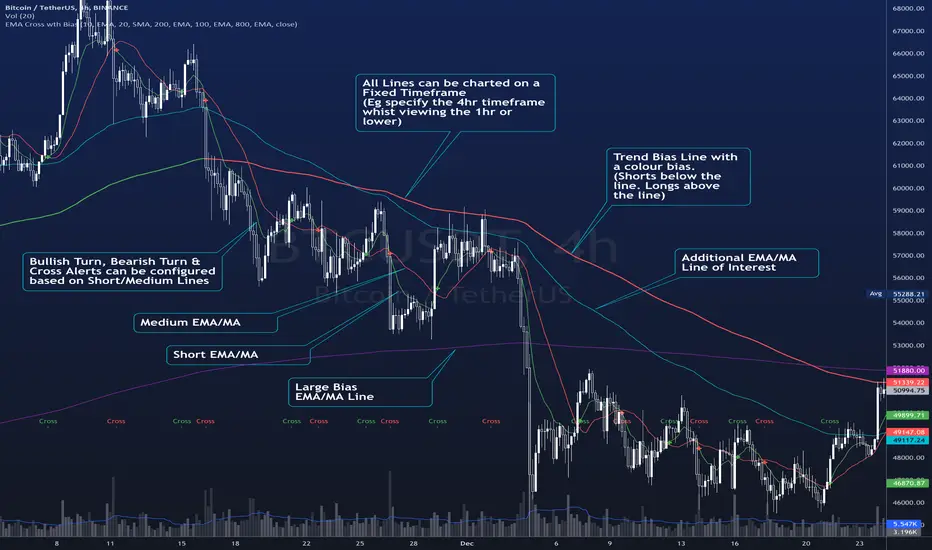
EMA Cross wth BiasThe Script plots 4 Moving averages.
1. Short Moving Average
2. Medium Moving Average
2. Trend Bias (Usually a much slower Moving Average) - Plots in Green when price action is above the line and Red for when price action is below the line.
3. Alerts are triggered when the short MA/ EMA turns. Can be used for Early Entry signals and Exits.
4. Alerts are triggered for Crosses of the Short and Medium MA
Each Moving average line can be confirmed to be a Simple MA or and EMA
Volume BiasHere’s an indicator that calculates the difference between the average distance we need to look back to find the up and down volume equal to the total volume of the last n bars. The further we need to look back to find the up or down volume, the more bearish or bullish its value is.
A not-yet published indicator from the PS-V5 blog!

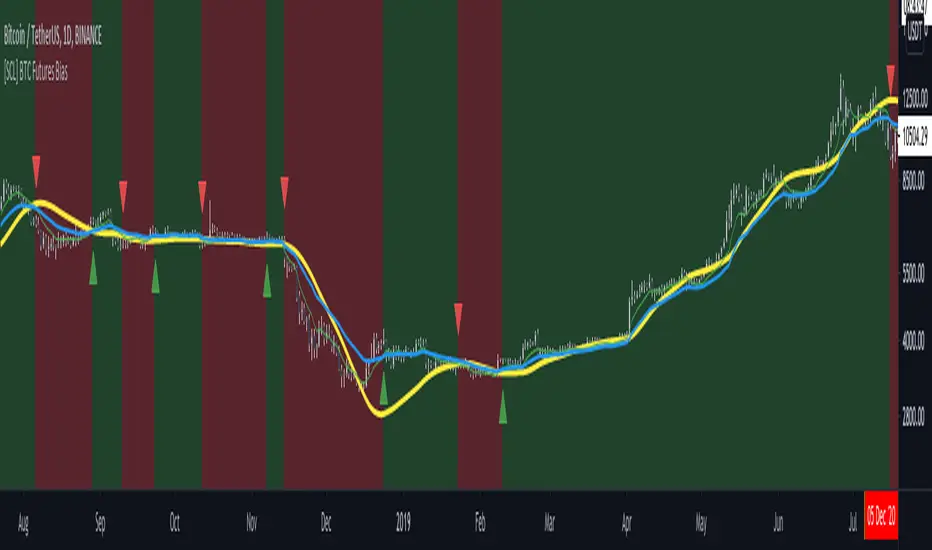
[SCL] BTC Futures Daily Bias (CME BTC1!)Derives a bias for BTC/USD on the daily timeframe and displays it on the chart in a configurable way. Takes price data from the CME BTC futures chart (exchange is configurable), regardless of what symbol you run it on.
Why? Because futures are said to give cleaner charts, but most traders are not trading CME futures. So you can use this indicator on whichever exchange you want to chart Bitcoin on.
Uses the 80D HMA and the 8D and 21D EMAs by default; all intervals are configurable.
Trends & RangesTrends & Ranges uses EMA ATR bands as a SuperTrend indicator.
How to use:
This indicator can be used to give you a direction bias, with the added function to create ranges which often lead to reversals or flat trading periods. Trade the break-out or wait for pull backs in the direction of the trend.
I'm not great at explaining stuff and will probably make things only more complicated, so I won't bother for now,
but if you have a question on how the script works I will gladly give it a try.
The option "Flexible Trends" will disable the min/max function (trailing or non trailing).
Flexible Trends enabled:
Flexible Trends disabled:
Settings are not optimized for any asset or time frame, you will have to do that for yourself. Feel free to share them in the comments.
Thanks for showing interest, enjoy and good luck! :)

Separated Moving Average [2] - evoThis is an updated version on one of my previous scripts. Small explanation in the description.
This new script gives you a direction bias based on closing above and below the lines, with an option to filter fake signals by waiting for one more candle close.
Also added more moving averages compared to the first script (built ins + donchian)
Hope you like it!
(If you're a coder with a slightly larger brain than me, please tell me in the comments if I fixed the repainting problem correctly, I'm not 100% sure..)

7EMA_5MA (G/D + Bias + 12/26 Signal)This script alow you to survey multiple crossing signals as Golden/Death cross (MA50/200), Institutional Bias (EMA9/18), or EMA 12/26 crossing. You can show/hide all EMAs/MAs and show/hide all signals. Default config displays EMA 50/100/200 and MA 20. Full script includes display of EMA 9/18/12/26/50/100/200 and MA 20/21/50/100/200.

RSI direction bias - JDThis simple indicator gives you a bias on the market that can be used as a filter, an entry indicator for pullbacks,...
Enjoy!
JD.
#NotTradingAdvice
#DYOR


2R overlay positive biasHere is a pretty clean 2R - risk reward assessment that is overlaid on the price action. Positive bias, kind of lazy on the release but you can edit to change look back period or drop into one of your indicator edits as another metric for trade risk. If this helps drop a comment or thumbs up.
-Squam

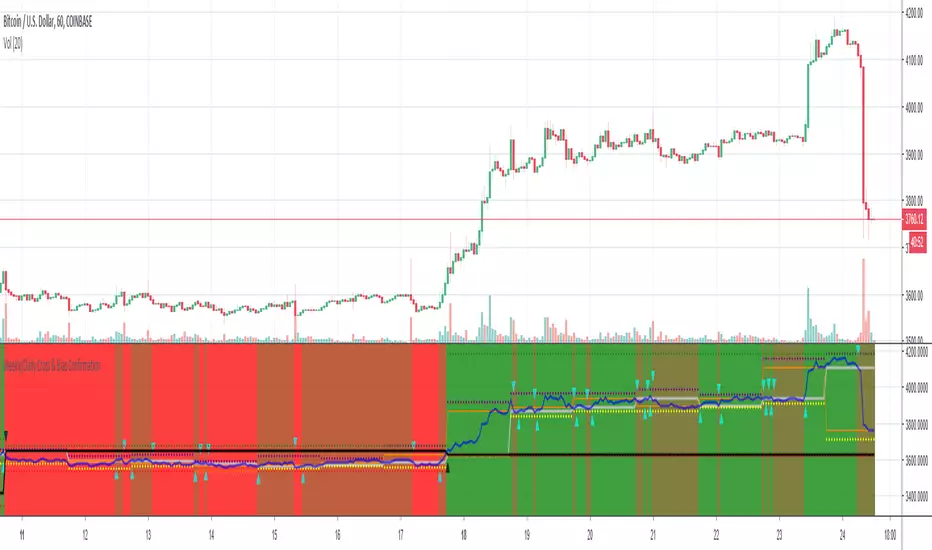
Weekly/Daily Cross & Bias ConfirmationThis indicator plots the weekly and daily open in addition to a current close price line.
It also signals when price closes above or below the daily and weekly opens.
Also, the bull/bear bias is painted on this indicator as well.
Black is the weekly open
Silver is the daily open
Weekly is default black arrows. Up is going above open, down is going below
Daily is default aqua arrows. Up is going above, down is going below
RSI + Volume + Bias linesJust added lines for bullish / bearish bias regions to the indicator from LazyBear


Inline Institutional BiasTrend identification indicator. Estimates (higher-timeframe) market state using the "Institutional Bias" MA relationship (9ema - 18ema, 1D timeframe). A "reference" MA (30sma - TRI's preferred MA for Trade Location) is then plotted, and colour-coded according to higher-timeframe market state.
NOTE: All MA lengths, types, and the timeframe to use are configurable, but default as above. All MAs are calculated using the "IB timeframe", even when zoomed in.

Bias Table-manualIt is just at tabular column to manually update Bullish/Bearish for multiple timeframes. Provided date option which is also manual, to denote when the analysis was done and table updated. This will be helpful for multiple stocks/securities analysis on regular basis

Bias Ratio-ETH-3H @CTTC5108Most of the code of this strategy should be my own original.
This Ethereum 3-hour time cycle strategy can be traced back to February 24, 2023. Although the profit and winning rate are not high, it is still relatively stable.
This strategy uses the deviation rate to enter the market. Invest 10% of the principal each time.
The limit start time adopts a rolling design (should be original).
Real-time retracement and maximum retracement are accurately calculated (should be original).
Adopt segmented stop profit (optional) design.
Open source for learning and other use.

Kalman Hull Kijun [BackQuant]Kalman Hull Kijun
A trend baseline that merges three ideas into one clean overlay, Kalman filtering for noise control, Hull-style responsiveness, and a Kijun-like Donchian midline for structure and bias.
Context and lineage
This indicator sits in the same family as two related scripts:
Kalman Price Filter
This is the foundational building block. It introduces the Kalman filter concept, a state-estimation algorithm designed to infer an underlying “true” signal from noisy measurements, originally used in aerospace guidance and later adopted across robotics, economics, and markets.
Kalman Hull Supertrend
This is the original script made, which people loved. So it inspired me to create this one.
Kalman Hull Kijun uses the same core philosophy as the Supertrend variant, but instead of building a Supertrend band system, it produces a single structural baseline that behaves like a Kijun-style reference line.
What this indicator is trying to solve
Most trend baselines sit on a bad trade-off curve:
If you smooth hard, the line reacts late and misses turns.
If you react fast, the line whipsaws and tracks noise.
Kalman Hull Kijun is designed to land closer to the middle:
Cleaner than typical fast moving averages in chop.
More responsive than slow averages in directional phases.
More “structure aware” than pure averages because the baseline is range-derived (Kijun-like) after filtering.
Core idea in plain language
The plotted line is a Kijun-like baseline, but it is not built from raw candles directly.
High level flow:
Start with a chosen price stream (source input).
Reduce measurement noise using Kalman-style state estimation.
Add Hull-style responsiveness so the filtered stream stays usable for trend work.
Build a Kijun-like baseline by taking a Donchian midpoint of that filtered stream over the base period.
So the output is a single baseline that is intended to be:
Less jittery than a simple fast MA.
Less laggy than a slow MA.
More “range anchored” than standard smoothing lines.
How to read it
1) Trend and bias (the primary use)
Price above the baseline, bullish bias.
Price below the baseline, bearish bias.
Clean flips across the baseline are regime changes, especially when followed by a hold or retest.
2) Retests and dynamic structure
Treat the baseline like dynamic S/R rather than a signal generator:
In uptrends, pullbacks that respect the baseline can act as continuation context.
In downtrends, reclaim failures around the baseline can act as continuation context.
Repeated back-and-forth around the line usually means compression or chop, not clean trend.
3) Extension vs compression (using the fill)
The fill is meant to communicate “distance” and “pressure” visually:
Large separation between price and baseline suggests expansion.
Price compressing into the baseline suggests rebalancing and decision points.
Inputs and what they change
Kijun Base Period
Controls the structural memory of the baseline.
Higher values track broader swings and reduce flips.
Lower values track tighter swings and react faster.
Kalman Price Source
Defines what data the filter is estimating.
Close is usually the cleanest default.
HL2 often “feels” smoother as an average price.
High/Low sources can become more reactive and less stable depending on the market.
Measurement Noise
Think of this as the main smoothness knob:
Higher values generally produce a calmer filtered stream.
Lower values generally produce a faster, more reactive stream.
Process Noise
Think of this as adaptability:
Higher values adapt faster to changing conditions but can get twitchy.
Lower values adapt slower but stay stable.
Plotting and UI (what you see on chart)
1) Adaptive line coloring
Baseline turns bullish color when price is above it.
Baseline turns bearish color when price is below it.
This makes the state readable without extra panels.
2) Gradient “energy” fill
Bull fill appears between price and baseline when above.
Bear fill appears between price and baseline when below.
The goal is clarity on separation and control, not decoration.
3) Rim effect
A subtle band around price that only appears on the active side.
Helps highlight directional control without hiding candles.
4) Candle painting (optional)
Candles can be colored to match the current bias.
Useful for scanning many charts quickly.
Disable if you prefer raw candles.
Alerts
Long state alert when price is above the baseline.
Short state alert when price is below the baseline.
Best used as a bias or regime notification, not a standalone entry trigger.
Where it fits in a workflow
This is a context layer, it pairs well with:
Market structure tools, BOS/MSB, OBs, FVGs.
Momentum triggers that need a regime filter.
Mean reversion tools that need “do not fade trends” context.
Limitations
No baseline eliminates chop whipsaws, tuning only manages the trade-off.
Settings should not be copy pasted across assets without checking behavior.
This does not forecast, it estimates and smooths state, then expresses it as a structural baseline.
Disclaimer
Educational and informational only, not financial advice.
Not a complete trading system.
If you use it in any trading workflow, do proper backtesting, forward testing, and risk management before any live execution.

GC/MGC VWAP Pullback + ADX Regime (Prop-Safe)GC / MGC VWAP Pullback + ADX Regime Strategy (Prop-Safe)
This strategy is designed specifically for Gold futures (GC & MGC) and prop firm trading, where capital preservation, consistency, and avoiding chop matter more than trade frequency.
The core philosophy is simple:
Only trade gold when it is expanding, aligned, and at the right location.
Strategy Concept
Gold moves in bursts, not constantly.
Most losses come from trading compression, VWAP chop, or late momentum.
This strategy filters those environments out and trades only:
Strong intraday momentum
Clear higher-timeframe direction
First pullbacks to VWAP
Clean price rejection with follow-through
It intentionally produces fewer but higher-quality trades.
Market Regime Filter (ADX)
ADX is evaluated on the 5-minute chart
This is the trade permission filter
ADX zones:
Below 18 → No trade (compression / chop)
20–35 → Optimal trading zone
35–45 → Caution (strong trend, reduced opportunity)
Above 45 → No new entries (late expansion / news risk)
ADX does not determine direction.
It only determines whether trading is allowed.
Direction Filter (Higher Timeframe)
Direction comes from the 1-Hour chart
EMA 20 above EMA 50 → Long bias only
EMA 20 below EMA 50 → Short bias only
Optional slope confirmation for additional strictness
No counter-trend trades.
Entry Logic (5-Minute Chart)
Trades are taken using a VWAP pullback continuation model.
Long Setup
ADX between 20–35
1H EMA 20 > EMA 50
Price pulls back to VWAP
Bullish rejection candle at VWAP
Entry on break of the rejection candle high
Short Setup
ADX between 20–35
1H EMA 20 < EMA 50
Price pulls back to VWAP from below
Bearish rejection candle at VWAP
Entry on break of the rejection candle low
All entries use stop orders, not market orders, to ensure follow-through.
Risk Management
Stop loss is placed beyond the rejection candle
Partial profit at 1R
Final target at 2R
No pyramiding
One clean setup is preferred over multiple trades
This structure aligns well with prop firm rules, trailing drawdowns, and consistency requirements.
What This Strategy Avoids
VWAP chop
Range-bound sessions
Overtrading
Late entries after news spikes
Counter-trend setups
If conditions are not ideal, no trade is the correct trade.
Best Use Case
Instruments: GC, MGC
Timeframe: 5-minute
Style: Intraday, prop-firm friendly
Ideal for traders who value:
Discipline
Structure
Capital protection

ADX Regime (5m) Companion PaneADX Regime Filter (5-Minute) — Trade Permission Indicator
This indicator is a market regime filter designed to answer one question only:
Is this market worth trading right now?
It is built specifically for intraday futures trading, with a strong focus on Gold (GC / MGC) and prop-firm style discipline.
What This Indicator Does
This ADX indicator does not give buy or sell signals.
Instead, it tells you when to trade and when to stand down.
Gold spends a large portion of the day in compression or VWAP chop.
Trading during those periods destroys consistency and drawdown control.
This indicator helps you avoid those conditions.
How ADX Is Used Here
ADX is calculated on the 5-minute timeframe
It measures trend strength and expansion, not direction
Direction should come from structure or higher-timeframe bias, not ADX
ADX is used strictly as a permission filter.
ADX Zones Explained
The indicator includes clear horizontal reference levels:
Below 18
Compression / chop
No trade environment
20 to 35
Optimal expansion zone
Best conditions for pullbacks and continuations
35 to 45
Strong trend
Trade cautiously or only first pullbacks
Above 45
Late expansion or news-driven volatility
No new entries recommended
These zones are visual guides to keep trading decisions objective.
What This Indicator Is NOT
It is not a signal generator
It is not an entry tool
It is not predictive
ADX does not tell you what direction to trade.
It tells you whether trading is allowed at all.
Best Practices
Use ADX on the 5-minute chart
Combine it with:
Higher-timeframe trend
VWAP or key levels
Clear price action
If ADX is below 18, standing aside is a valid trade decision
Who This Indicator Is For
Futures traders
Prop firm traders
Traders who value:
Capital protection
Fewer but higher-quality trades
Consistency over activity
Core Principle
ADX is a gatekeeper.
When it says no, you do nothing.
When it says yes, you still wait for structure and location.
This mindset alone can dramatically improve discipline and results.
