Forex Insight Pro 6.0Forex Insight Pro 6.0 for TradingView gives you abilities to see the stories hiding in the graphs of the markets. It marks and reminds you about important parameters that are happening on the graph so that you will not forget to consider them before placing orders. These parameters include:
Automatic CC(X) counting that compare the close of the right price bar to that of left price bar in a group of X consecutive bars such as CC(5,9) of a group of 5 bars will compare the close price of the right bar to the left bar (ignoring 3 bars in the middle). If the right bar closed higher, the count number would be printed above the bar. If the left bar closed higher, the count number would be printed below the bar. Nine consecutive series of up counts will define the lowest price as CC(5,9) support line and nine consecutive series of down counts will define the highest price as CC(5,9) resistance line. The count numbers and support / resistance lines are automatically printed on the graph if enabled.
Show a set of simple moving average lines such as SMA5, SMA13, SMA50, SMA200, SMA800, if enabled. The color of SMA50 line (which is the same as the the middle line of Bollinger band (50,2) can be set to change based on increasing/decreasing values of itself, or of the MACD(12,26,9).
Show Bollinger bands (50,2), if enabled.
Show the high and low levels of the previous day, if enabled.
Show the important time areas for Forex trading during Asian, London, and New York sessions, if enabled.
Automatic printing of the events happening in the graph to remind the readers of parameters under considerations (if enabled) including:
- Print "SMA5>13" and "SMA5<13" for SMA5 crossed above and below SMA13.
- Print "SMA50>200" and SMA50<200" for SMA50 crossed above and below SMA200.
- Print "Max" and "Min" for local maximum and local minimum bars.
- Print "C75" and "C25" for the bars that closed above 75% and closed below 25% of its ranges.
- Print "C>SMA5" and "C30" and "RSI<70" for RSI(14) that crossed above 30 % and below 70 %.
- Print "MACD>0" and "MACD<0" for MACD(12,26,9) that crossed above and below zero.
- Print "MACD>Sig" and "MACD
Cari dalam skrip untuk "binary option"

Strategy 5 minutesStrategy 5 minutes binary options
The script automatically reports ceilings and floors in a period of 5 minutes
The triangles of green color means purchase and the triangles of red color mean sale.
I support myself with a stochastic indicator to enter the orders
5.3.3 configuration.
If you have any suggestions for or doubts about its operation, let me know.

seven multi indicator Vdub Binary Options SniperVX v1
Trend colour ema
Modified vyacheslav.shindin
Modified Rajandran R Supertrend
Directional Projection
8x MA
Ichimoku Cloud

seven multi indicator-복합지표(Mr.J)//=============================== Vdub Binary Options SniperVX v1 ===============================//
//--------------------Trend colour ema------------------------------------------------//
//--Modified vyacheslav.shindin-------------------------------------------------//
//Modified - Rajandran R Supertrend----------------------------------------------------- //
//===============================Directional Projection=======================================//
//====================================================== 8x MA ======================================================//
//====================================================== Ichimoku Cloud ======================================================//

Important Gap Finder Emiliano Mesa 1H ONLYTells you to buy or sell a position, with huge accurancy and good profit. Binary option also set with the indicator.
You choose when to exit a position. Enter with arrows

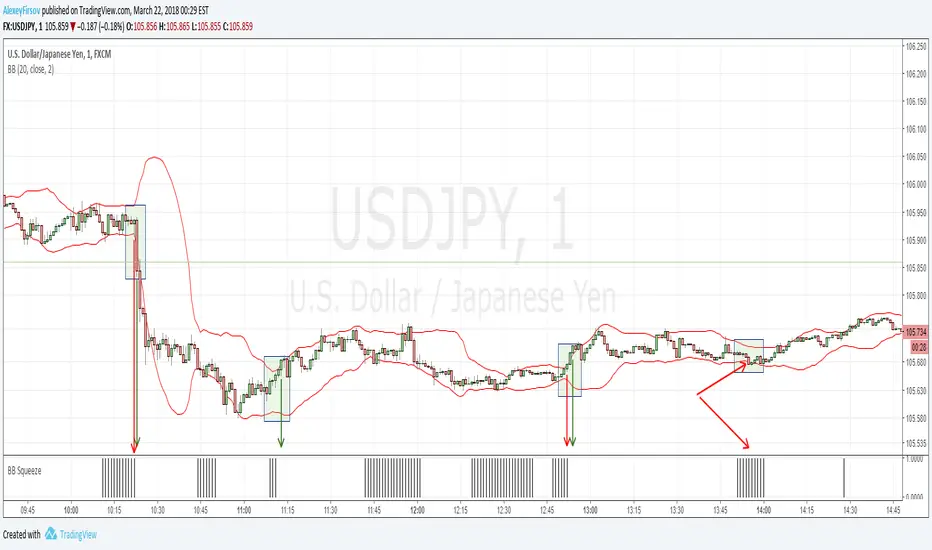
Bollinger Bands SqueezeEnglish:
Simple histogram, showing Squeeze of Bollinger Bands.
Usage is simple - when price is in Squeeze, no entries in any direction. For using with Bollinger Bands indicator, including binary options.
Russian
Простой индикатор, наглядной отображающий стадию Сжатия лент Боллинджера.
Простой в использовании - когда цена в Сжатии - не входим в сделку. Особенно эффективен при связке с индикатором лент Боллинджера и входе в сделку при раскрытии лент. Также применим для бинарных опционов
Example/Пример
SuperRHello, It's me...Hemlata, So some of you guys heard about my first indicator "DJ". Which I didn't publish yet and maybe never because I don't want to give you low - quality stuff, But now I'm coming with my new indicator named is " SuperR " I'm still working on it almost done but I think it takes a little bit more time...after completing indicator will be available for sale.
Guys, it took me a long time to learn code & implement stuff into an indicator...So no way am I going to give it free of cost. The Indicator will be available only for paid users...
Now few things about the SuperR indicator:-
The System works with 2 levels of the martingale system ( Mostly accurate on the first step )
This is not for forex only for Binary option 60 seconde expiry.
The super-R indicator does not repaint (You have to wait for the candle to close and the label should be there before you take entry)
Special Thanks to Nico J ( you can find him on here trading view and yeah you can buy his indicator's too ) search "Spiritwalker"
He helped me a lot.

Ultimate Reversal SystemUltimate Reversal System
1- Designed and ideal for Binary Options trading.
2- Extensive testing and accuracy proven to have a +95% win rate in all market conditions, when applied correctly. This system requires a martingale strategy up to the 3rd level. Suited for all currency pairs. Tested on 5 minute trades, but could be used for different time frames.
3- Respect to high volatile news is recommended.
4- The system includes a variety of ideally customized indicators, working in harmony for optimum results.
This system has proved itself solid and reliable. I have full confidence in the Ultimate Reversal Strategy! I Publish it, because I truly believe in it.
You can have the "URS'' indicator for a once off purchase price of $100. When purchased along with a friend, you could each have access for only $75. After your purchase, you will be provided with a step-by-step practical application document via e-mail.
If you are interested, and would like secure and profitable results, kindly e-mail me at marais.francois@hotmail.com
Looking forward to hear many success stories and positive results!
Kind regards,
Francois

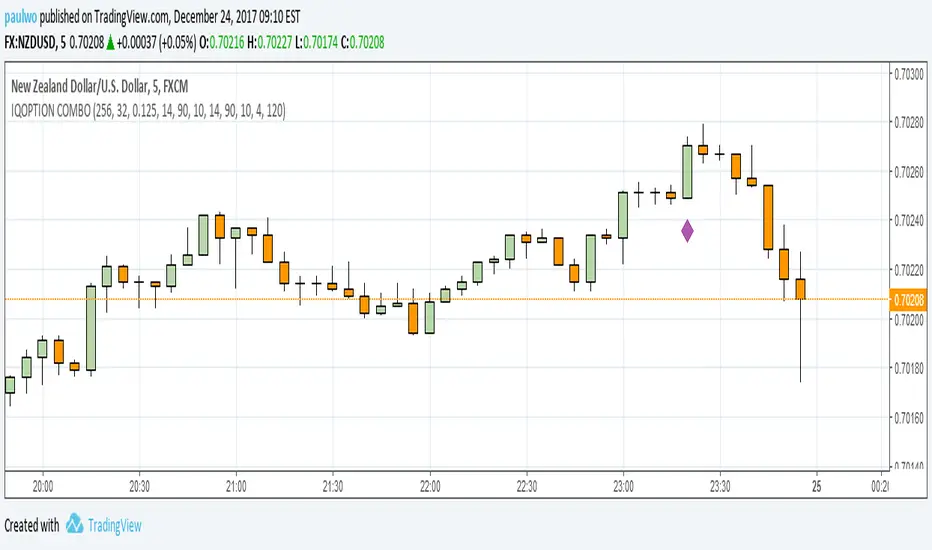
IQOPTION COMBO v1This is a combination of various Indicators forming one indicator for Binary options on 1min and 5min charts. Can be used for Forex on higher time frames.
Mostly trigger in overbought and oversold conditions.
Use RSI, Stochastics, CCI and other filters.
Trade when the RED arrow appears.
It is coded to allow Alerts to be setup.
Noro's BinaryHacker v1.0The indicator isn't redrawn (the last candle can be redrawn because it still changes).
NOT indicator shows a bottom of the market or top of the market!!! The indicator shows what there will be a color of the following candle.
The index up under the current candle means that the following candle will be growing (there will be a green candle). And vice versa. The index down under the current candle means that the following candle will be falling (there will be a red candle). The indicator shows only on one following candle. It is not the trend indicator!
Well for Forex and binary options.

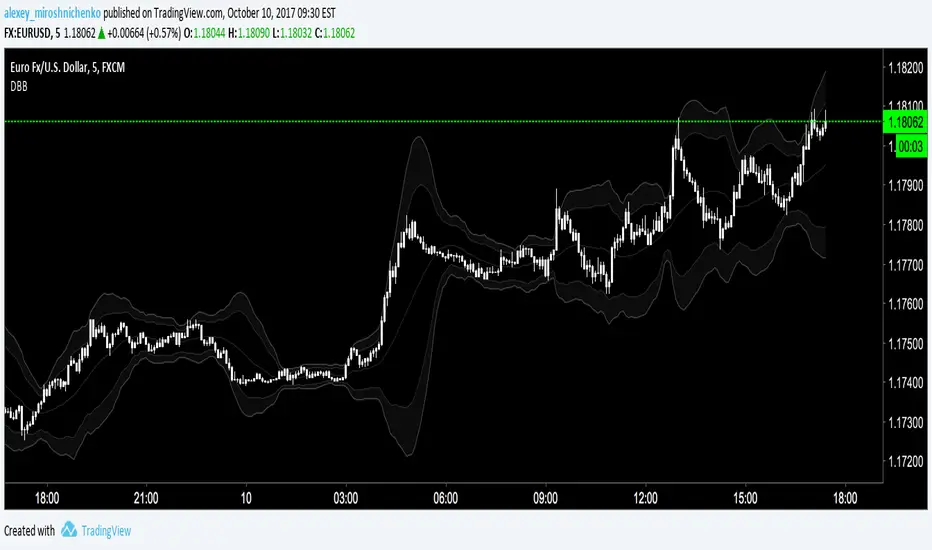
double bollinger bandssimple, yet effective tool to catch reversals for short-term binary options trading.
Abramov_V4First of all for binary options
Multi currency
Timeframe 5 minutes +
Volatility - not lower than average
This indicator includes:
1. Bollinger waves of 3 levels - on / off
2. Moving averages 2 pieces - on / off
3. Price channel - on / off
4. Day and resistance level support - on / off
5. Main support and resistance level for 120 minutes - on / off
6. Areas of RSI overbought / oversold in the form of arrows.
Any of the indicators is configurable.
The optimal settings are set by default.
This indicator is suitable for several strategies.
Access on request.
When working with this indicator, it is necessary to avoid news and sudden jumps in the market

Abramov_V3 + MA + Price Channel + Sup_Res_level + B_bandsPrimarily for binary options
Multicurrency
Timeframe 5 minutes +
This indicator includes:
1. Bollinger waves 3 levels - on / off
2. Moving averages 2 pieces - on / off
3. Price channel - on / off
4. Day support and resistance level - on / off
5. The main support and resistance level for 120 minutes - on / off
Any of the indicators is configurable.
The optimal settings are made by default.
This indicator is suitable for several strategies.
Access on request.
I separately recommend the indicators:
1. Abramov_RSI (my script)
2. Lin reg (2, -2, 100, close)
When working with this indicator, it is necessary to avoid news and sharp surges in the market
For access, write to me in private messages

60seconds Binary option StretegyReliable Indicator
U mean Up
D mean Down
How i use it:-
1- I add this indicator to my 5min chart
2-I create Alert manully
3-As soon as Alert come i trade for 1min.
Best if alert comes just in start of new candle in 1min or 5min
Guys let me know your results
:)
Enjoy.

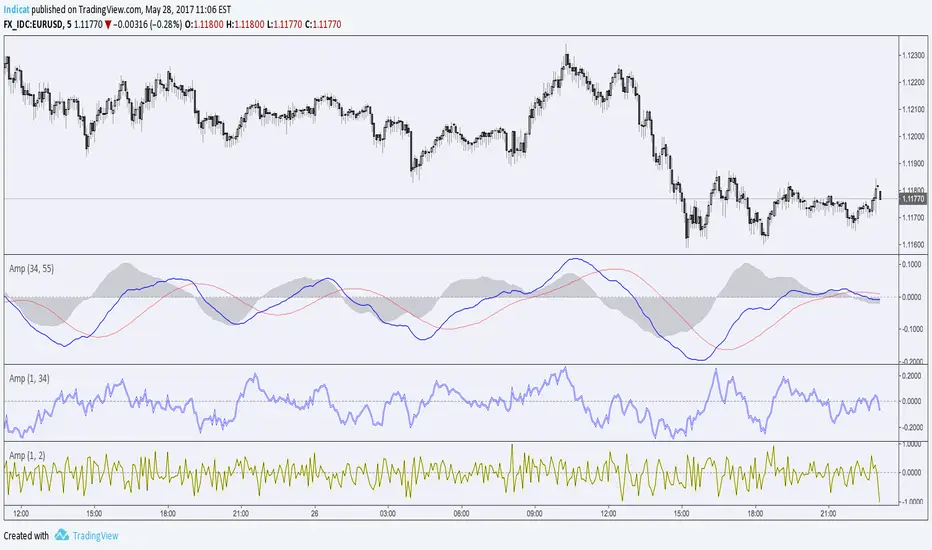
Amplitude IndicatorHello Traders,
Amplitude is the measurement of the difference between the variable's extreme values.
This indicator is based on the Balance of Power (close-open)/(high-low).
Instead of taking the value of a single candlestick, exponential moving averages are used in the formula.
On it's lowest settings (1,2) it's exactly the same as the Balance of power, by adjusting the smoothing you can seen the highs and lows in momentum of the chosen period. (highly adjustable RSI)
By adding a simple moving average (Signal Line) it turns into a cross-over type, like MACD with a histogram.
This indicator is doesn't have a default or 'best' setting, instead I use the Fibonacci numbers as input. (1,2,3,5,8,13,21,34,55,89,144).
Depending on its settings this indicator is well suited for binary options, trend and reversal trading.
Cheers, Indicat...
BO STRATEGY v4.0Multitimeframe channels based strategy for binary options. Non repainting signals. Entry on the next candle after a signal.

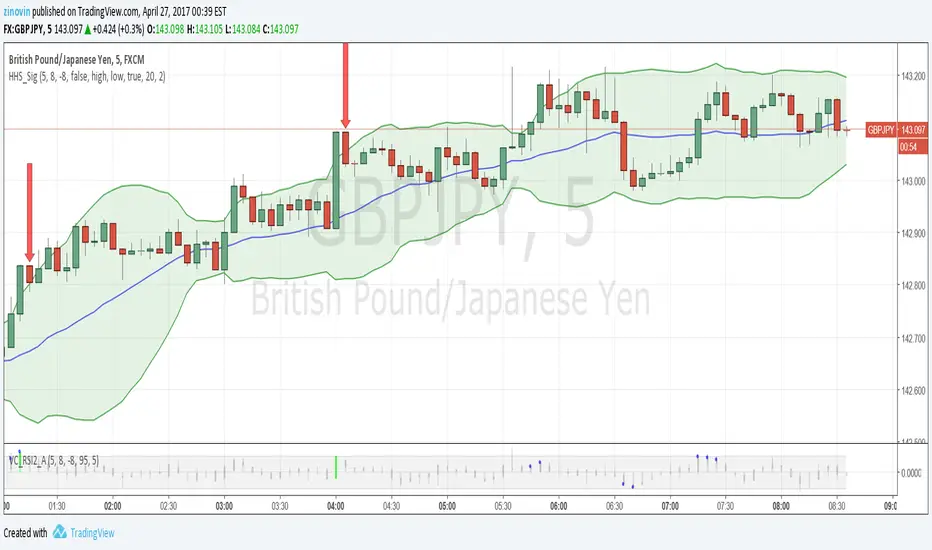
Hubba Hubba Style SignalsThe indicator shows signals for "Hubba Hubba Style" strategy (binary options). It is the best to use one with "Value Chart and RSI2 with Alert" indicator. I recommend to use TF5 and expiration time till 5 min.
Also HHS_Sig can show Bollinger Bands, Resistance and support lines based on William's fractals
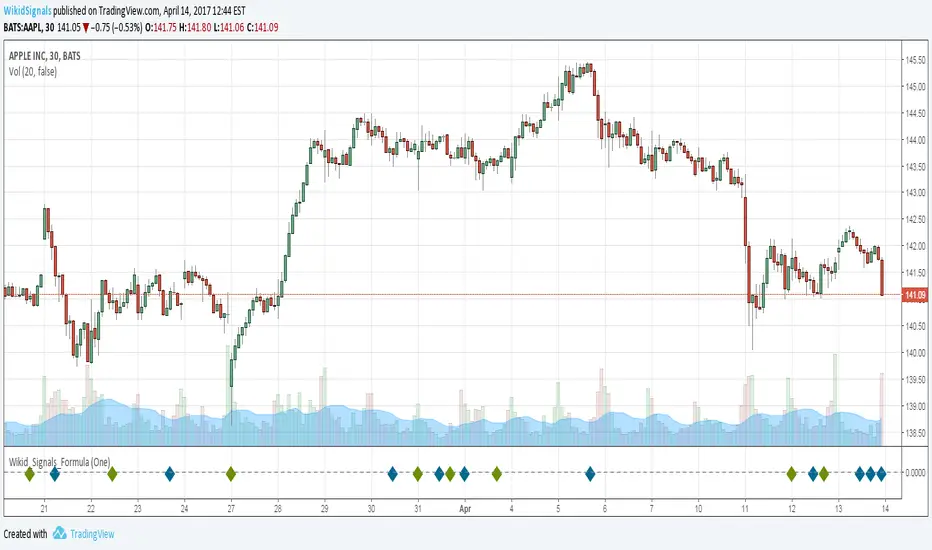
Wikid Signals After losing lots of money and time trying to figure out how to trade Forex, I finally developed a strategy based on this custom indicator. This strategy works for Binary Options, Stocks, and Forex. This indicator can be viewed for a monthly charge of $25 per month. Most signal sites charge up to $500 a month for custom indicators. I was broke once too and I know that every penny counts when you have a family to feed as well. To learn more about Wikid Signals or to sign up, visit www.wikidsignals.com
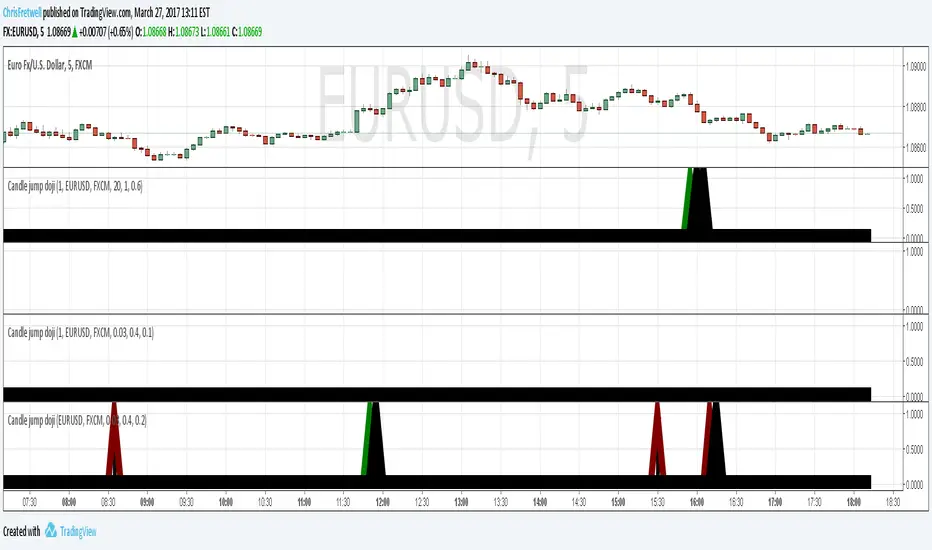
Candle pattern doji-harami just something I wipped together. Unused code still in script and left there for you to experiment with. simple classic doji candle pattern recognition code. Binary option use recommended. red arrow suggest down trade and green for up trade. if market direction fails then a black arrow pops up on next candle. this is to help quickly judge the accuracy while experimenting with input numbers.
Fast/Slow RSIYo Traders,
This indicator is inspired by the RSI-2 strategy in combination with a somewhat smoothed RSI-14.
It has a zero-line, allowing it to use columns or an area as a histogram.
A nice tool to find that perfect entry/exit point, also very useful for Binary Options.
Cheers, Indicat


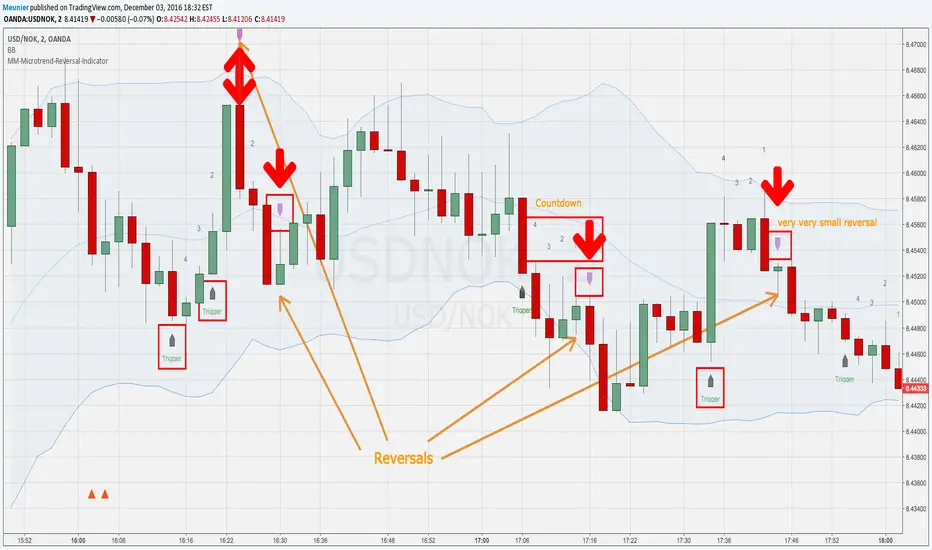
MM-Microtrend-Reversal-IndicatorThis indicator detects microtrend reversals based on crossing of the DMI+ and DMI- + signals
It indicates the trigger event on the chart as well as the reversal candle
In addition to that it shows a countdown above the bars
This is helping when multiple reversals occur
Important: when the Bollinger Bands are crossed in the previous bars it's possible that the prognosted reversal will NOT show up
Recommended timeframes are M1 and M2
Avoid trading sideway trends, the reverals are low and reversal triggers and assumed reversal candles could get chaotic

MM-Microtrend-Reversal-IndicatorThis indicator detects microtrend reversals based on crossings of the DMI+ and DMI- signals
It indicates the trigger event on the chart as well as the reversal candle
In addition to that it shows a countdown above the bars
This is helping when multiple reversals occur.
Important: when the Bollinger Bands are crossed in the previous bars it's possible that the prognosted reversal will NOT show up
Recommended timeframes are M1 and M2
Avoid trading sideway trends, the reversals are low and reversal triggers and assumed reversal candles could get chaotic sometimes