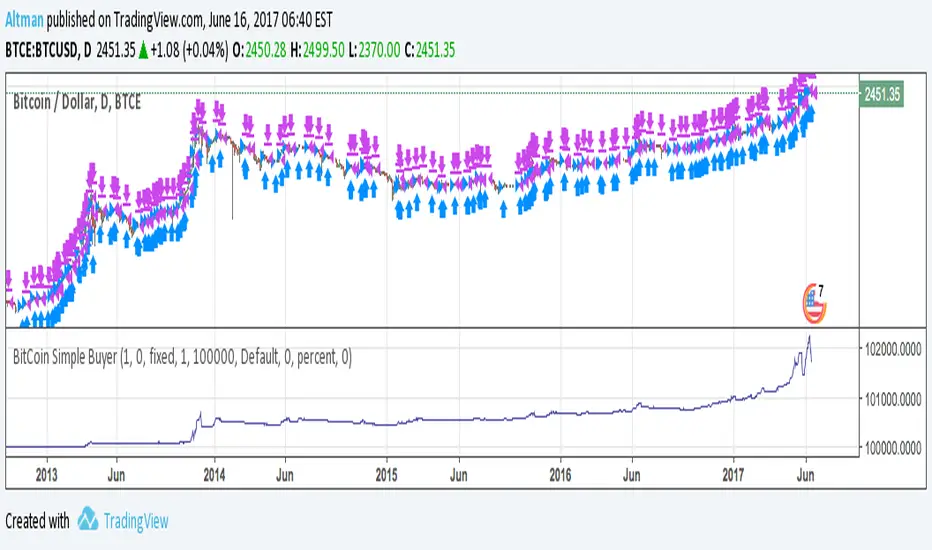
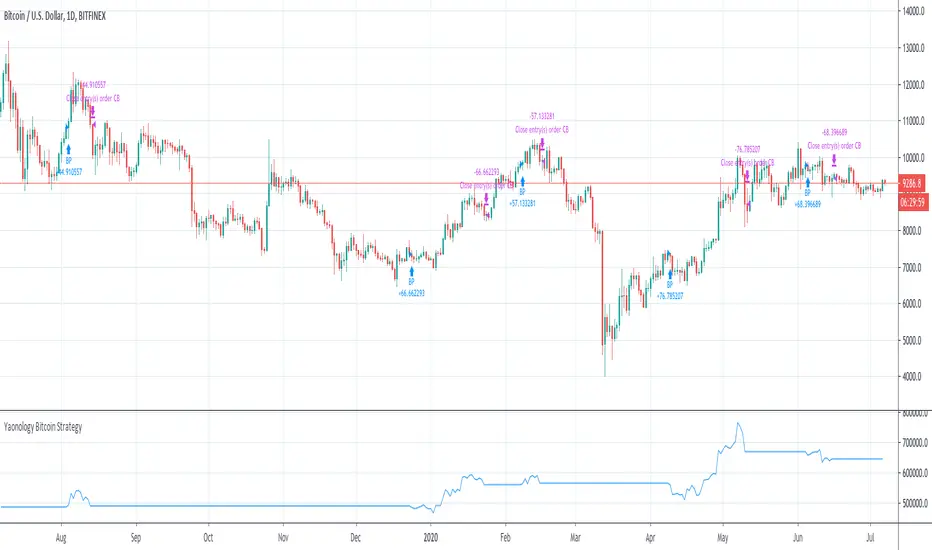
BitCoin Simple BuyerMany people asking me: How to find the right time to exit BitCoin long position? First, that comes to mind is Do Not use simple Buy-and-Hold strategy, but make short-term trades. Here is the simple algorithm for D1 or 4H timeframes.
Cari dalam skrip untuk "bitcoin"
Bitcoin Halving Strategy
A systematic, data-driven trading strategy based on Bitcoin's 4-year halving cycles. This strategy capitalizes on historical price patterns that emerge around halving events, providing clear entry and exit signals for both accumulation and profit-taking phases.
🎯 Strategy Overview
This automated trading system identifies optimal buy and sell zones based on the predictable Bitcoin halving cycle that occurs approximately every 4 years. By analyzing historical data from all previous halvings (2012, 2016, 2020, 2024), the strategy pinpoints high-probability trading opportunities.
📊 Key Features
Automated Signal Generation: Buy signals at halving events and DCA zones, sell signals at profit-taking peaks
Multi-Phase Analysis: Tracks Accumulation, Profit Taking, Bear Market, and DCA phases
Visual Dashboard: Real-time performance metrics, phase countdown, and position tracking
Backtesting Enabled: Comprehensive historical performance analysis with configurable parameters
Risk Management: Built-in position sizing, slippage control, and optional short trading
⚙️ Strategy Logic
Buy Signals:
At halving event (Week 0)
DCA zone entry (Week 135 post-halving)
Sell Signals:
Profit-taking zone (Week 80 post-halving)
Optional short position entry for advanced traders
📈 Performance Highlights
Captures major bull run profits while avoiding prolonged bear markets
Clear visual indicators for all phases and transitions
Customizable timing parameters for personalized risk tolerance
Professional dashboard with live P&L, win rate, and drawdown metrics
🛠️ Customization Options
Adjustable phase timing (profit start/end, DCA timing)
Position sizing control
Enable/disable short trading
Visual customization (colors, labels, zones)
Table positioning and transparency
⚠️ Risk Disclosure
Past performance does not guarantee future results. This strategy is based on historical halving cycle patterns and should be used as part of a comprehensive trading plan. Always conduct your own research and consider your risk tolerance before trading.
💡 Ideal For
Long-term Bitcoin investors seeking systematic entry/exit points
Swing traders capitalizing on multi-month trends
Portfolio managers implementing cycle-based allocation strategies

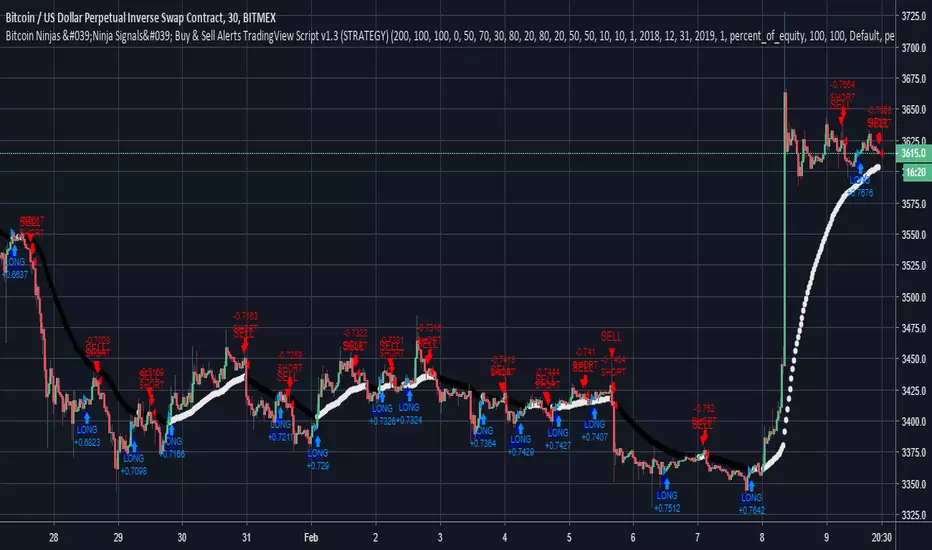
BitcoinNinjas Ninja Signals Buy/Sell Alert Trading Strategy v3.0Bitcoin Ninjas 'Ninja Signals' Buy/Sell Alerts & Backtesting TradingView Script v3.0
(for Cryptocurrencies, Forex, GunBot, ProfitTrailer, automatic trading software, and more)
This is version 3 of our popular Ninja Signals trading script, which is similar to version 2, but with a new hard-coded calibration (resolution) setting that automatically matches candle size (period) to ensure that no repainting occurs regardless of the number or type of indicators and filters traders apply when configuring the script.
'Ninja Signals' v3.0 (SCRIPT)
'Ninja Signals' v3.0 (STRATEGY)
'Ninja Signals' v2.0 (SCRIPT)
'Ninja Signals' v2.0 (STRATEGY)
'Ninja Signals' v1.0 (SCRIPT)
'Ninja Signals' v1.0 (STRATEGY)
-Allows users to easily set automated buy and sell alerts on TradingView for use with automatic and manual trading of cryptocurrencies, Forex securities, and more (alerts are compatible with automatic trading software such as GunBot, ProfitTrailer, and more).
-Synthesizes many powerful indicators [e.g. Relative Strength Index (RSI), stochastic RSI, Money Flow Index (MFI), Moving Average Convergence Divergence (MACD), etc.) into one super script to generate very precise buy and sell signals in almost any market condition.
-Buy arrows (blue) and sell arrows (red) can be changed or hidden for ease of viewing.
-No lag EMA trendline featuring trend-reversal color-coding (white uptrend, black downtrend).
-Adjustable ‘calibration’ setting allows users to customize the script to work for any currency or security available through TradingView, on any exchange, simply by adjusting a number.
-Complete with backtesting strategy version of script which allows users to test various buy and sell strategies based on the alerts the script generates (see info and screenshots below).
-Backtesting strategy incorporates a user-defined adjustable date range, so users can estimate the script’s performance over specific periods of time, such as the last day, week, or month.
-Backtesting strategy utilizes a minimum protective gain setting to help you never sell for a loss. Simply adjust your minimum profit (%) per trade, and the test results will update.
-Backtesting strategy allows for pyramid buying to test various average down / double up buying strategies. Simply adjust the number of pyramid buys and the quantity of each buy.
- Free 7-day trial available for TradingView users who join our free BitcoinNinjas community.
-Free 24/7 support via BitcoinNinjas Telegram GunBot support group with script purchase.
-Fully compatible with GunBot automatic trading software (TradingView plugin is required).
-Special discount available for traders who purchase GunBot automatic trading software and the GunBot TradingView plugin from BitcoinNinjas, allowing for fully automatic trading.
-Contact us via Email or Telegram for more information, to request additional / custom screenshots, or to start your free trial.
DISCLAIMER: By using our BitcoinNinjas ‘Ninja Signals’ planning script, you agree to the BitcoinNinjas 'Terms of Use', as presented on our website (www.BitcoinNinjas.org) and as stated here. No sharing, copying, reselling, modifying, or any other forms of use are authorized for our documents, script / strategy, and the information published with them. This informational planning script / strategy is strictly for individual use and educational purposes only. This is not financial or investment advice. Investments are always made at your own risk and are based on your personal judgement. Bitcoin Ninjas is not responsible for any losses you may incur. Please invest wisely.
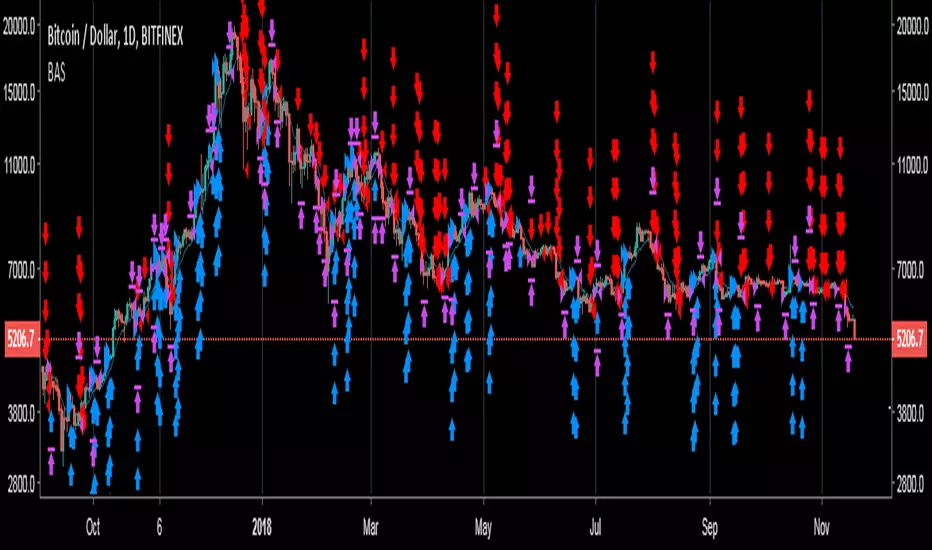
Bitcoin Ninjas 'Ninja Signals' Buy & Sell Alert Trading StrategyBitcoin Ninjas 'Ninja Signals' Buy/Sell Alerts & Backtesting TradingView Script
(for Cryptocurrencies, Forex, GunBot, ProfitTrailer, automatic trading software, and more)
Main Script:
-Allows users to easily set automated buy and sell alerts on TradingView for use with automatic and manual trading of cryptocurrencies, Forex securities, and more (alerts are compatible with automatic trading software such as GunBot, ProfitTrailer, and more).
-Synthesizes many powerful indicators [e.g. Relative Strength Index (RSI), stochastic RSI, Money Flow Index (MFI), Moving Average Convergence Divergence (MACD), etc.) into one super script to generate very precise buy and sell signals in almost any market condition.
-Buy arrows (blue) and sell arrows (red) can be changed or hidden for ease of viewing.
-No lag EMA trendline featuring trend-reversal color-coding (white uptrend, black downtrend).
-Adjustable ‘calibration’ setting allows users to customize the script to work for any currency or security available through TradingView, on any exchange, simply by adjusting a number.
-Complete with backtesting strategy version of script which allows users to test various buy and sell strategies based on the alerts the script generates (see info and screenshots below).
-Backtesting strategy incorporates a user-defined adjustable date range, so users can estimate the script’s performance over specific periods of time, such as the last day, week, or month.
-Backtesting strategy utilizes a minimum protective gain setting to help you never sell for a loss. Simply adjust your minimum profit (%) per trade, and the test results will update.
-Backtesting strategy allows for pyramid buying to test various average down / double up buying strategies. Simply adjust the number of pyramid buys and the quantity of each buy.
-Free 7-day trial available for TradingView users who join our free BitcoinNinjas community.
-Free 24/7 support via BitcoinNinjas Telegram GunBot support group with script purchase.
-Fully compatible with GunBot automatic trading software (TradingView plugin is required).
-Special discount available for traders who purchase GunBot automatic trading software and the GunBot TradingView plugin from BitcoinNinjas, allowing for fully automatic trading.
-Contact us via Email or Telegram for more information, to request additional / custom screenshots, or to start your free trial.
Screenshot (Script)
Screenshot (Backtesting Strategy)
Screenshot (Adjustable Calibration, Minimum Profit Per Trade, & Date Range)
Screenshot (Optional Pyramid / Average Down Buying)
Screenshot (Customizable Buy/Sell Arrows & Trend Reversal Line)
DISCLAIMER: By viewing and/or using this TradingView script, you agree to the BitcoinNinjas 'Terms of Use', as presented on our website ( BitcoinNinjas.org ) and as stated here. No sharing, copying, reselling, modifying, or any other forms of use, are authorized for this document. This document is strictly for individual use and informational purposes only. This is not financial or investment advice. Investments are always made at your own risk, and are based on yo
BitcoinNinjas Ninja Signals Buy Sell Alert Trading Strategy v2.0Bitcoin Ninjas 'Ninja Signals' Buy/Sell Alerts & Backtesting TradingView Script v2.0
(for Cryptocurrencies, Forex, GunBot, ProfitTrailer, automatic trading software, and more)
'Ninja Signals' v2.0 (SCRIPT)
'Ninja Signals' v2.0 (STRATEGY)
'Ninja Signals' v1.0 (SCRIPT)
'Ninja Signals' v1.0 (STRATEGY)
-Allows users to easily set automated buy and sell alerts on TradingView for use with automatic and manual trading of cryptocurrencies, Forex securities, and more (alerts are compatible with automatic trading software such as GunBot, ProfitTrailer, and more).
-Synthesizes many powerful indicators [e.g. Relative Strength Index (RSI), stochastic RSI, Money Flow Index (MFI), Moving Average Convergence Divergence (MACD), etc.) into one super script to generate very precise buy and sell signals in almost any market condition.
-Buy arrows (blue) and sell arrows (red) can be changed or hidden for ease of viewing.
-No lag EMA trendline featuring trend-reversal color-coding (white uptrend, black downtrend).
-Adjustable ‘calibration’ setting allows users to customize the script to work for any currency or security available through TradingView, on any exchange, simply by adjusting a number.
-Complete with backtesting strategy version of script which allows users to test various buy and sell strategies based on the alerts the script generates (see info and screenshots below).
-Backtesting strategy incorporates a user-defined adjustable date range, so users can estimate the script’s performance over specific periods of time, such as the last day, week, or month.
-Backtesting strategy utilizes a minimum protective gain setting to help you never sell for a loss. Simply adjust your minimum profit (%) per trade, and the test results will update.
-Backtesting strategy allows for pyramid buying to test various average down / double up buying strategies. Simply adjust the number of pyramid buys and the quantity of each buy.
- Free 7-day trial available for TradingView users who join our free BitcoinNinjas community.
-Free 24/7 support via BitcoinNinjas Telegram GunBot support group with script purchase.
-Fully compatible with GunBot automatic trading software (TradingView plugin is required).
-Special discount available for traders who purchase GunBot automatic trading software and the GunBot TradingView plugin from BitcoinNinjas, allowing for fully automatic trading.
-Contact us via Email or Telegram for more information, to request additional / custom screenshots, or to start your free trial.
DISCLAIMER: By using this BitcoinNinjas document or ‘Ninja Signals’ planning script, you agree to the BitcoinNinjas 'Terms of Use', as presented on our website (www.BitcoinNinjas.org) and as stated here. No sharing, copying, reselling, modifying, or any other forms of use are authorized for our documents, script / strategy, and the information published with them. This informational document and planning script / strategy is strictly for individual use and educational purposes only. This is not financial or investment advice. Investments are always made at your own risk and are based on your personal judgement. BitcoinNinjas is not responsible for any losses you may incur. Please invest wisely.

Bitcoin CME-Spot Z-Spread - Strategy [presentTrading]This time is a swing trading strategy! It measures the sentiment of the Bitcoin market through the spread of CME Bitcoin Futures and Bitfinex BTCUSD Spot prices. By applying Bollinger Bands to the spread, the strategy seeks to capture mean-reversion opportunities when prices deviate significantly from their historical norms
█ Introduction and How it is Different
The Bitcoin CME-Spot Bollinger Bands Strategy is designed to capture mean-reversion opportunities by exploiting the spread between CME Bitcoin Futures and Bitfinex BTCUSD Spot prices. The strategy uses Bollinger Bands to detect when the spread between these two correlated assets has deviated significantly from its historical norm, signaling potential overbought or oversold conditions.
What sets this strategy apart is its focus on spread trading between futures and spot markets rather than price-based indicators. By applying Bollinger Bands to the spread rather than individual prices, the strategy identifies price inefficiencies across markets, allowing traders to take advantage of the natural reversion to the mean that often occurs in these correlated assets.
BTCUSD 8hr Performance
█ Strategy, How It Works: Detailed Explanation
The strategy relies on Bollinger Bands to assess the volatility and relative deviation of the spread between CME Bitcoin Futures and Bitfinex BTCUSD Spot prices. Bollinger Bands consist of a moving average and two standard deviation bands, which help measure how much the spread deviates from its historical mean.
🔶 Spread Calculation:
The spread is calculated by subtracting the Bitfinex spot price from the CME Bitcoin futures price:
Spread = CME Price - Bitfinex Price
This spread represents the difference between the futures and spot markets, which may widen or narrow based on supply and demand dynamics in each market. By analyzing the spread, the strategy can detect when prices are too far apart (potentially overbought or oversold), indicating a trading opportunity.
🔶 Bollinger Bands Calculation:
The Bollinger Bands for the spread are calculated using a simple moving average (SMA) and the standard deviation of the spread over a defined period.
1. Moving Average (SMA):
The simple moving average of the spread (mu_S) over a specified period P is calculated as:
mu_S = (1/P) * sum(S_i from i=1 to P)
Where S_i represents the spread at time i, and P is the lookback period (default is 200 bars). The moving average provides a baseline for the normal spread behavior.
2. Standard Deviation:
The standard deviation (sigma_S) of the spread is calculated to measure the volatility of the spread:
sigma_S = sqrt((1/P) * sum((S_i - mu_S)^2 from i=1 to P))
3. Upper and Lower Bollinger Bands:
The upper and lower Bollinger Bands are derived by adding and subtracting a multiple of the standard deviation from the moving average. The number of standard deviations is determined by a user-defined parameter k (default is 2.618).
- Upper Band:
Upper Band = mu_S + (k * sigma_S)
- Lower Band:
Lower Band = mu_S - (k * sigma_S)
These bands provide a dynamic range within which the spread typically fluctuates. When the spread moves outside of these bands, it is considered overbought or oversold, potentially offering trading opportunities.
Local view
🔶 Entry Conditions:
- Long Entry: A long position is triggered when the spread crosses below the lower Bollinger Band, indicating that the spread has become oversold and is likely to revert upward.
Spread < Lower Band
- Short Entry: A short position is triggered when the spread crosses above the upper Bollinger Band, indicating that the spread has become overbought and is likely to revert downward.
Spread > Upper Band
🔶 Risk Management and Profit-Taking:
The strategy incorporates multi-step take profits to lock in gains as the trade moves in favor. The position is gradually reduced at predefined profit levels, reducing risk while allowing part of the trade to continue running if the price keeps moving favorably.
Additionally, the strategy uses a hold period exit mechanism. If the trade does not hit any of the take-profit levels within a certain number of bars, the position is closed automatically to avoid excessive exposure to market risks.
█ Trade Direction
The trade direction is based on deviations of the spread from its historical norm:
- Long Trade: The strategy enters a long position when the spread crosses below the lower Bollinger Band, signaling an oversold condition where the spread is expected to narrow.
- Short Trade: The strategy enters a short position when the spread crosses above the upper Bollinger Band, signaling an overbought condition where the spread is expected to widen.
These entries rely on the assumption of mean reversion, where extreme deviations from the average spread are likely to revert over time.
█ Usage
The Bitcoin CME-Spot Bollinger Bands Strategy is ideal for traders looking to capitalize on price inefficiencies between Bitcoin futures and spot markets. It’s especially useful in volatile markets where large deviations between futures and spot prices occur.
- Market Conditions: This strategy is most effective in correlated markets, like CME futures and spot Bitcoin. Traders can adjust the Bollinger Bands period and standard deviation multiplier to suit different volatility regimes.
- Backtesting: Before deployment, backtesting the strategy across different market conditions and timeframes is recommended to ensure robustness. Adjust the take-profit steps and hold periods to reflect the trader’s risk tolerance and market behavior.
█ Default Settings
The default settings provide a balanced approach to spread trading using Bollinger Bands but can be adjusted depending on market conditions or personal trading preferences.
🔶 Bollinger Bands Period (200 bars):
This defines the number of bars used to calculate the moving average and standard deviation for the Bollinger Bands. A longer period smooths out short-term fluctuations and focuses on larger, more significant trends. Adjusting the period affects the responsiveness of the strategy:
- Shorter periods (e.g., 100 bars): Makes the strategy more reactive to short-term market fluctuations, potentially generating more signals but increasing the risk of false positives.
- Longer periods (e.g., 300 bars): Focuses on longer-term trends, reducing the frequency of trades and focusing only on significant deviations.
🔶 Standard Deviation Multiplier (2.618):
The multiplier controls how wide the Bollinger Bands are around the moving average. By default, the bands are set at 2.618 standard deviations away from the average, ensuring that only significant deviations trigger trades.
- Higher multipliers (e.g., 3.0): Require a more extreme deviation to trigger trades, reducing trade frequency but potentially increasing the accuracy of signals.
- Lower multipliers (e.g., 2.0): Make the bands narrower, increasing the number of trade signals but potentially decreasing their reliability.
🔶 Take-Profit Levels:
The strategy has four take-profit levels to gradually lock in profits:
- Level 1 (3%): 25% of the position is closed at a 3% profit.
- Level 2 (8%): 20% of the position is closed at an 8% profit.
- Level 3 (14%): 15% of the position is closed at a 14% profit.
- Level 4 (21%): 10% of the position is closed at a 21% profit.
Adjusting these take-profit levels affects how quickly profits are realized:
- Lower take-profit levels: Capture gains more quickly, reducing risk but potentially cutting off larger profits.
- Higher take-profit levels: Let trades run longer, aiming for bigger gains but increasing the risk of price reversals before profits are locked in.
🔶 Hold Days (20 bars):
The strategy automatically closes the position after 20 bars if none of the take-profit levels are hit. This feature prevents trades from being held indefinitely, especially if market conditions are stagnant. Adjusting this:
- Shorter hold periods: Reduce the duration of exposure, minimizing risks from market changes but potentially closing trades too early.
- Longer hold periods: Allow trades to stay open longer, increasing the chance for mean reversion but also increasing exposure to unfavorable market conditions.
By understanding how these default settings affect the strategy’s performance, traders can optimize the Bitcoin CME-Spot Bollinger Bands Strategy to their preferences, adapting it to different market environments and risk tolerances.

Bitcoin Leverage Sentiment - Strategy [presentTrading]█ Introduction and How it is Different
The "Bitcoin Leverage Sentiment - Strategy " represents a novel approach in the realm of cryptocurrency trading by focusing on sentiment analysis through leveraged positions in Bitcoin. Unlike traditional strategies that primarily rely on price action or technical indicators, this strategy leverages the power of Z-Score analysis to gauge market sentiment by examining the ratio of leveraged long to short positions. By assessing how far the current sentiment deviates from the historical norm, it provides a unique lens to spot potential reversals or continuation in market trends, making it an innovative tool for traders who wish to incorporate market psychology into their trading arsenal.
BTC 4h L/S Performance
local
█ Strategy, How It Works: Detailed Explanation
🔶 Data Collection and Ratio Calculation
Firstly, the strategy acquires data on leveraged long (**`priceLongs`**) and short positions (**`priceShorts`**) for Bitcoin. The primary metric of interest is the ratio of long positions relative to the total of both long and short positions:
BTC Ratio=priceLongs / (priceLongs+priceShorts)
This ratio reflects the prevailing market sentiment, where values closer to 1 indicate a bullish sentiment (dominance of long positions), and values closer to 0 suggest bearish sentiment (prevalence of short positions).
🔶 Z-Score Calculation
The Z-Score is then calculated to standardize the BTC Ratio, allowing for comparison across different time periods. The Z-Score formula is:
Z = (X - μ) / σ
Where:
- X is the current BTC Ratio.
- μ is the mean of the BTC Ratio over a specified period (**`zScoreCalculationPeriod`**).
- σ is the standard deviation of the BTC Ratio over the same period.
The Z-Score helps quantify how far the current sentiment deviates from the historical norm, with high positive values indicating extreme bullish sentiment and high negative values signaling extreme bearish sentiment.
🔶 Signal Generation: Trading signals are derived from the Z-Score as follows:
Long Entry Signal: Occurs when the BTC Ratio Z-Score crosses above the thresholdLongEntry, suggesting bullish sentiment.
- Condition for Long Entry = BTC Ratio Z-Score > thresholdLongEntry
Long Exit/Short Entry Signal: Triggered when the BTC Ratio Z-Score drops below thresholdLongExit for exiting longs or below thresholdShortEntry for entering shorts, indicating a shift to bearish sentiment.
- Condition for Long Exit/Short Entry = BTC Ratio Z-Score < thresholdLongExit or BTC Ratio Z-Score < thresholdShortEntry
Short Exit Signal: Happens when the BTC Ratio Z-Score exceeds the thresholdShortExit, hinting at reducing bearish sentiment and a potential switch to bullish conditions.
- Condition for Short Exit = BTC Ratio Z-Score > thresholdShortExit
🔶Implementation and Visualization: The strategy applies these conditions for trade management, aligning with the selected trade direction. It visualizes the BTC Ratio Z-Score with horizontal lines at entry and exit thresholds, illustrating the current sentiment against historical norms.
█ Trade Direction
The strategy offers flexibility in trade direction, allowing users to choose between long, short, or both, depending on their market outlook and risk tolerance. This adaptability ensures that traders can align the strategy with their individual trading style and market conditions.
█ Usage
To employ this strategy effectively:
1. Customization: Begin by setting the trade direction and adjusting the Z-Score calculation period and entry/exit thresholds to match your trading preferences.
2. Observation: Monitor the Z-Score and its moving average for potential trading signals. Look for crossover events relative to the predefined thresholds to identify entry and exit points.
3. Confirmation: Consider using additional analysis or indicators for signal confirmation, ensuring a comprehensive approach to decision-making.
█ Default Settings
- Trade Direction: Determines if the strategy engages in long, short, or both types of trades, impacting its adaptability to market conditions.
- Timeframe Input: Influences signal frequency and sensitivity, affecting the strategy's responsiveness to market dynamics.
- Z-Score Calculation Period: Affects the strategy’s sensitivity to market changes, with longer periods smoothing data and shorter periods increasing responsiveness.
- Entry and Exit Thresholds: Set the Z-Score levels for initiating or exiting trades, balancing between capturing opportunities and minimizing false signals.
- Impact of Default Settings: Provides a balanced approach to leverage sentiment trading, with adjustments needed to optimize performance across various market conditions.

Bitcoin (BTC) Scalp / Short-term Short IndicatorThe purpose of this scalping Indicator is to help identifying Sell signals for short term trades on Bitcoin (Spot, Features, etc.) .
This script is working with more indicators and everything is balanced by hard work on (back)testing.
Result for users is a simple signal to SELL.
You can use it as easy indicator in your graph or create alerts.
I have the best results on 1min graph, with leverage and stop-loss feature.
This is my own version of scalping Sell Script / Indicator, which is a combination of few indicators, for example RSI , BB and price levels (actual and average) and works on standard candles.
SELL signal paints above the candle and you can set your target / trailing / stop-loss in the settings and check how it works in Strategy Tester.
Settings of this Indicator:
Take Profit
Stop Loss
Trailing Stop Loss
Trailing Stop Loss Offset
Initial Capital
Base Currency
Order size
Pyramiding
Commissions
Slippage
Average price lines (colors and visibility)
Plot background
These signals can be often observed at the beginning of a strong move, but there is a significant probability that these price levels will be revisited at a later point in time again.
Therefore these are interesting levels to place limit orders.
A Sell signal is defined as the last up candle before a sequence of down candles.
In my trading settings I have more but small positions, one safety limit order (for price averaging = better entry - easier close in profit) and stop-loss.
Sometimes trailing-profit feature have very nice profits.
Settings depends on your own money-management and free capital.
Don't ignore UP / DOWN trend. For UP trend I have an Indicator too (check my profile).
In addition to the upper/lower limits of each line, also average value is marked as this is an interesting area for price interaction and better view.
PM me to obtain access, more informations or support.
NOTICE: By requesting access to this script you acknowledge that you have read and understood that this is for research purposes only and I am not responsible for any financial losses you may incur by using this script.

Bitcoin (BTC) Scalp / Short-term Long IndicatorThe purpose of this scalping Indicator is to help identifying Buy signals for short term trades on Bitcoin (Spot, Features, etc.) .
This script is working with more indicators and everything is balanced by hard work on (back)testing.
Result for users is a simple signal to BUY .
You can use it as easy indicator in your graph or create alerts.
I have the best results on 1min graph, with leverage and stop-loss feature.
This is my own version of scalping Buy Script / Indicator, which is a combination of few indicators, for example RSI, BB and price levels (actual and average) and works on standard candles .
LONG signal paints below the candle and you can set your target / trailing / stop-loss in the settings and check how it works in Strategy Tester .
Settings of this Indicator:
Take Profit
Stop Loss
Trailing Stop Loss
Trailing Stop Loss Offset
Initial Capital
Base Currency
Order size
Pyramiding
Commissions
Slippage
Average price lines (colors and visibility)
Plot background
These signals can be often observed at the beginning of a strong move, but there is a significant probability that these price levels will be revisited at a later point in time again.
Therefore these are interesting levels to place limit orders.
A Buy signal is defined as the last down candle before a sequence of up candles.
In my trading settings I have more but small positions, one safety limit order (for price averaging = better entry - easier close in profit) and stop-loss.
Sometimes trailing-profit feature have very nice profits.
Settings depends on your own money-management and free capital.
In addition to the upper/lower limits of each line, also average value is marked as this is an interesting area for price interaction and better view.
PM me to obtain access, more informations or support.
NOTICE: By requesting access to this script you acknowledge that you have read and understood that this is for research purposes only and I am not responsible for any financial losses you may incur by using this script.

Bitcoin Futures vs. Spot Tri-Frame - Strategy [presentTrading]Prove idea with a backtest is always true for trading.
I developed and open-sourced it as an educational material for crypto traders to understand that the futures and spot spread may be effective but not be as effective as they might think. It serves as an indicator of sentiment rather than a reliable predictor of market trends over certain periods. It is better suited for specific trading environments, which require further research.
█ Introduction and How it is Different
The "Bitcoin Futures vs. Spot Tri-Frame Strategy" utilizes three different timeframes to calculate the Z-Score of the spread between BTC futures and spot prices on Binance and OKX exchanges. The strategy executes long or short trades based on composite Z-Score conditions across the three timeframes.
The spread refers to the difference in price between BTC futures and BTC spot prices, calculated by taking a weighted average of futures prices from multiple exchanges (Binance and OKX) and subtracting a weighted average of spot prices from the same exchanges.
BTCUSD 1D L/S Performance
█ Strategy, How It Works: Detailed Explanation
🔶 Calculation of the Spread
The spread is the difference in price between BTC futures and BTC spot prices. The strategy calculates the spread by taking a weighted average of futures prices from multiple exchanges (Binance and OKX) and subtracting a weighted average of spot prices from the same exchanges. This spread serves as the primary metric for identifying trading opportunities.
Spread = Weighted Average Futures Price - Weighted Average Spot Price
🔶 Z-Score Calculation
The Z-Score measures how many standard deviations the current spread is from its historical mean. This is calculated for each timeframe as follows:
Spread Mean_tf = SMA(Spread_tf, longTermSMA)
Spread StdDev_tf = STDEV(Spread_tf, longTermSMA)
Z-Score_tf = (Spread_tf - Spread Mean_tf) / Spread StdDev_tf
Local performance
🔶 Composite Entry Conditions
The strategy triggers long and short entries based on composite Z-Score conditions across all three timeframes:
- Long Condition: All three Z-Scores must be greater than the long entry threshold.
Long Condition = (Z-Score_tf1 > zScoreLongEntryThreshold) and (Z-Score_tf2 > zScoreLongEntryThreshold) and (Z-Score_tf3 > zScoreLongEntryThreshold)
- Short Condition: All three Z-Scores must be less than the short entry threshold.
Short Condition = (Z-Score_tf1 < zScoreShortEntryThreshold) and (Z-Score_tf2 < zScoreShortEntryThreshold) and (Z-Score_tf3 < zScoreShortEntryThreshold)
█ Trade Direction
The strategy allows the user to specify the trading direction:
- Long: Only long trades are executed.
- Short: Only short trades are executed.
- Both: Both long and short trades are executed based on the Z-Score conditions.
█ Usage
The strategy can be applied to BTC or Crypto trading on major exchanges like Binance and OKX. By leveraging discrepancies between futures and spot prices, traders can exploit market inefficiencies. This strategy is suitable for traders who prefer a statistical approach and want to diversify their timeframes to validate signals.
█ Default Settings
- Input TF 1 (60 minutes): Sets the first timeframe for Z-Score calculation.
- Input TF 2 (120 minutes): Sets the second timeframe for Z-Score calculation.
- Input TF 3 (180 minutes): Sets the third timeframe for Z-Score calculation.
- Long Entry Z-Score Threshold (3): Defines the threshold above which a long trade is triggered.
- Short Entry Z-Score Threshold (-3): Defines the threshold below which a short trade is triggered.
- Long-Term SMA Period (100): The period used to calculate the simple moving average for the spread.
- Use Hold Days (true): Enables holding trades for a specified number of days.
- Hold Days (5): Number of days to hold the trade before exiting.
- TPSL Condition (None): Defines the conditions for taking profit and stop loss.
- Take Profit (%) (30.0): The percentage at which the trade will take profit.
- Stop Loss (%) (20.0): The percentage at which the trade will stop loss.
By fine-tuning these settings, traders can optimize the strategy to suit their risk tolerance and trading style, enhancing overall performance.

Bitcoin Acceleration StrategyThe objective for this strategy was to reduce the standard divination of bitcoin returns through risk management, this is done with both long and short trades. It looks to get on board when a trend is detected and adds to the position to average out all entry points. When the momentum begins to decelerate all trades are closed. In short trades it looks for a capitulation structure to exit. 50% of these trades will usually be in profit and 50% will usually be a loss, however profits are 3x larger than losses. I am also pleased that the algorithm shorted through the recent crash.
To demonstrate that the deviation of retuns of the strategy is lower than hodling, I leaveraged the strategy to a similar drawdown level to hodling so that you can compare the two.
When risk adjusted, my strategy beats buy and hold returns by about 600%, although I am personally trading the strategy unleaveraged.
Message me for details on granting access

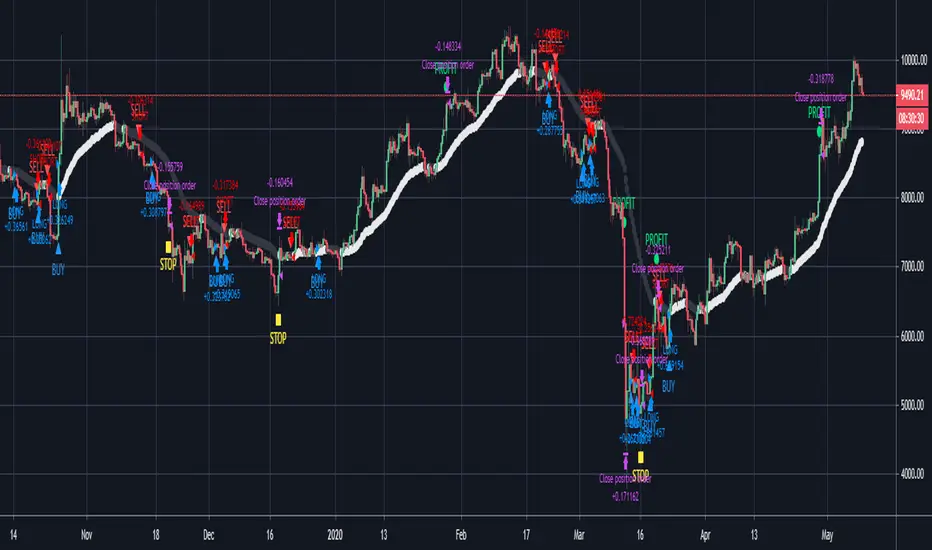
Bitcoin Trading Algo, 30,500% profit long + short. Beats HODLingREAD DISCRIPTION FIRST
Trading view have taken off the Invite Only options for scripts from free accounts and since I usually only like people I know using my scripts I have programmed my own password and Keycode system within pine script, the Keycode changes every month and is determined by a random number algorithm so you will need to know both the password and the keycode for the script to wok for you.
The objective for this strategy was to reduce the standard divination of bitcoin returns through risk management, this is done with both long and short trades. It looks to get on board when a trend is detected and adds to the position to average out all entry points. When the momentum begins to decelerate all trades are closed. 50% of these trades will usually be in profit and 50% will usually be a loss, however profits are 3x larger than losses.
To demonstrate that the deviation of retuns of the strategy is lower than hodling, I leaveraged the strategy to a similar drawdown level to hodling so that you can compare the two.
When risk adjusted, my strategy beats buy and hold returns by about 600%, although I am personally trading the strategy unleaveraged.
A Physicist's Bitcoin Trading Strategy
1. Summary
This strategy and indicator were designed for, and intended to be used to guide trading activity in, crypto markets, particularly Bitcoin. This strategy uses a custom indicator to determine the state of the market (bullish vs bearish) and allocates funds accordingly. This particular variation also uses the custom indicator to determine when the market is significantly oversold and takes advantage of the opportunity (it buys the dip). The specific mathematical formula that is used to calculate the underlying custom indicator allows the trader to get in before, or near the start of, the bull trends, and get out before the bear trends. The strategy's properties dialogue box includes many display settings and parameters for optimization and customization to meet the user's needs and risk tolerance; this is both a tool to gauge the market, as well as a trading strategy to beat the market. Guidelines for parameter settings are provided. A sample dataset of backtest results using randomized parameters, both within the guidelines and outside the guidelines, is available upon request; notably, all trials outperformed the intended market (Bitcoin) during the 9-year backtest period.
2. The Indicator and Strategy
2.1. The Indicator
A mathematical formula is used to determine the state of the market according to three different "frequencies", which, for lack of better terminology, are called fast, moderate, and slow indicators. There are two parameters for each of the three indicators, one called response time and the other is a simple look-back period. Finally, four exponential moving averages are used to smooth each indicator. In total, there are 18 different levels of bullishness/bearishness. The purpose of using three indicators, rather than one, is to capture the full character of the market, from a macro/global scope down to a micro/local scope. I.e. the full indicator looks at the forest, the trees, and the branches, simultaneously.
2.2. The Strategy
The trend-trading strategy is very simple; there are only four types of orders: 1) The entire position (e.g. all bitcoins held) is sold (if it hasn't already been totally sold) when the indicator becomes maximally bearish, 2) When the movement of the indicator is in the bullish direction, the strategy dollar-cost-average (DCA) buys at an exponentially decreasing rate, i.e. it buys more in the early stages of the transition from bear->bull. 3) When the indicator is maximally bullish, it goes "all-in" † (if it hasn't already gone all-in), i.e. it converts all available cash into the underlying security/token. And, 4) when the movement of the indicator is in the bearish direction, the strategy DCA sells (again, exponentially decreasing) to get out quickly. No leverage is used in this strategy. The strategy never takes a short position.
A second "buy-the-dip" strategy is also used, and it is the synergy of these two strategies, together, that is responsible for most of the outperformance in the backtests (this strategy handily beats the non-dip-buying variation in backtests). To do this, the custom indicator is used to determine when the market is significantly oversold on a short-term basis, and the strategy responds by DCA buying. However, unlike the DCA buying during bull/bear transitions, the buy-the-dip DCA buying increases with time. Specifically, within each candle that is short-term oversold, the strategy converts 10% x # of candles since becoming oversold (up to a max of 6 candles) of available cash into the underlying security/token. I.e. the first buy is 10% of available cash and occurs in the first oversold candle, the second buy is 20% of available cash and occurs in the second oversold candle, etc. up to six consecutive oversold candles. Lastly, to ensure no conflicting orders and no leverage (buying more than what is affordable with the available cash in the fund), buy-the-dip orders take precedence over the trend-trading orders enumerated in the previous paragraph.
† Technically the strategy goes 99.5% in when it goes "all-in". This is to ensure no leverage is used given that there may be a commission of 0.5%.
3. Backtest Results
Backtest results demonstrate significant outperformance over buy-and-hold. The default parameters of the strategy/indicator have been set by the author to achieve maximum (or, close to maximum) outperformance on backtests executed on the BTCUSD (Bitcoin) chart. However, significant outperformance over buy-and-hold is still easily achievable using non-default parameters. Basically, as long as the parameters are set to adequately capture the full character of the market, significant outperformance on backtests is achievable and is quite easy. In fact, after some experimentation, it seems as if underperformance hardly achievable and requires deliberately setting the parameters illogically (e.g. setting one parameter of the slow indicator faster than the fast indicator). In the interest of providing a quality product to the user, suggestions and guidelines for parameter settings are provided in section (6). Finally, some metrics of the strategy's outperformance on the BTCUSD chart are listed below, both for the default (optimal) parameters as well as for a random sample of parameter settings that adhere to the guidelines set forth in section (6).
Using the default parameters, relative to buy-and-hold strategy, backtested from August 2011 to August 2020,
Total cumulative outperformance (total return of strategy minus total return of buy-n-hold): 13,000,000%.
Rolling 1-year outperformance: mean 318%, median 84%, 1st quartile 55%, 3rd quartile, 430%.
Rolling 1-month outperformance: mean 2.8% (annualized, 39%), median -2.1%, 1st quartile -7.7%, 3rd quartile 13.2%, 10th percentile -13.9%, 90th percentile 24.5%.
Using the default parameters, relative to buy-and-hold strategy, during specific periods,
Cumulative outperformance during the past year (August 2019-August 2020): 37%.
12/17/2016 - 12/17/2017 (2017 bull market) absolute performance of 2563% vs buy-n-hold absolute performance of 2385%
11/29/2012 - 11/29/2013 (2013 bull market) absolute performance of 14033% vs buy-n-hold absolute performance of 9247%
Using a random sample (n=20) of combinations of parameter settings that adhere to the guidelines outlined in section (6), relative to buy-and-hold strategy, backtested from August 2011 to August 2020,
Average total cumulative outperformance, from August 2011 to August 2020: 2,000,000%.
Median total cumulative outperformance, from August 2011 to August 2020: 1,000,000%.
4. Limitations
This strategy is basically a DCA-swing trading strategy, and as such it is intended to be used on the 6-hr chart. Similar performance is expected on daily chart, 12-hr chart, and 4-hr chart, but performance is likely to be limited when used on charts of shorter time-frames. However, due to the flexibility afforded by the large quantity of parameters, as well as the tools included, it may be possible to tweak the indicator settings to get some outperformance on smaller time-frames. Admittedly, the author did not spend much time investigating this.
As is apparent in the backtests, this strategy has very limited absolute performance during large bear markets, such as Bitcoin's 2018 bear market. As described, it does outperform the underlying security by a large amount in backtests, but a large absolute return is unlikely during large and prolonged declines (unless, of course, your unit of account is the underlying token, in which case an outperformance of the underlying is, by definition, an absolute positive return).
This strategy is likely to underperform if used to trade ETFs of broad equity markets. This strategy may produce a small amount of outperformance when used to trade precious metals ETFs, given that the parameters are set optimally by the user.
5. Use
The default parameters have already been set for highly optimal backtest results on the chart of BTCUSD (Bitcoin / US Dollar BITSTAMP), (although, a different combination of parameter settings may yet produce better results). Still, there is a great number of combinations that can be explored, so the user is free to tweak the settings to meet his/her/their needs. Some display options are provided to give the user a visual aid while tweaking the parameters. These include a blue/red background display of the custom indicator, a calibration system, and options to display information about the backtest results. The background pattern represents the various levels of bullishness/bearishness as semi-transparent layers of blue and red, with blue corresponding with bullish and red corresponding with bearish.
The parameters that affect the indicator are the response times, the periods, and some EMA lengths. The parameters that affect the quantity of contracts (tokens/shares/bitcoins/etc) to be bought/sold are the transitionary buy/sell rates. There are also two sets of date parameters.
The response time and period parameters are direct inputs into the underlying math formula and are used to create the base-level indicators (fast, moderate, and slow). The response times control the speed of each of the three indicators (shorter is fast, longer is slower) and the period controls how much historical data is used in computation. Information about how these should be set are included in section (6). Another set of parameters control EMA look-back periods that serve to smooth the base-level indicators. Increasing these EMA lengths makes the overall indicator less sensitive to short-term price action, while reducing them does the opposite. The effect of these parameters are obvious when the background blue/red visualization is displayed. Another EMA length is an EMA for the entire indicator. Increasing this parameter reduces the responsiveness of the trading strategy (buy/sell orders) to quick/small changes of the overall level of the indicator, so as to avoid unnecessary buying and selling in times of relatively small and balanced price perturbations. Note, changing this parameter does not have an effect on the overall indicator itself, and thus will not affect the blue/red background representation.
The transitionary buy/sell rates control the portion of the available asset to be converted to the other. E.g. if the buy rate is set to 90%, then 90% of the available cash will be used to buy contracts/tokens/shares/bitcoins during transitions bullish transitions, e.g. if the available cash at the start of the bullish transition is $10,000 and the parameter is set to 90%, then $9,000 will be used to buy in the first candle during which the transition is bullish, then $900 will be used to buy in the second candle, then $90 in the third candle, etc.
There are two dates that can be set. The first is the date at which the strategy goes all in. This is included because the buy-and-hold strategy is the benchmark against which this strategy is compared, so setting this date to some time before the strategy starts to make trades will show, very clearly, the outperformance of the strategy, especially when the initial capital parameter in the Properties tab is equal to the price of one unit of the underlying security on the date that is set, e.g. all-in on Bitcoin on 8/20/2011 and set initial capital to the BTCUSD price on that date, which was $11.70. The second date is a date to control when the strategy can begin to place trades.
Finally (actually, firstly in the Inputs dialogue box), a set of checkbox inputs controls whether or not the backtest is on or off, and what is displayed. The display options are the blue/red (bull/bear) background layers †, a set of calibrators, a plot of the total strategy equity, a plot of the cash position of the strategy, a plot of the size of the position of the strategy in contracts/shares/units (labeled as BTC position), and a plot of the rolling 1-year performances of buy-and-hold and the strategy.
About the calibrators: The calibration system allows the user to quickly assess and calibrate how well the indicator... indicates. Quite simply, the system has two parts: one plot that is the cumulative sum of the product of the indicator level and the change in the underlying price, i.e. sum of ‡, over all candles. The second part is a similar plot that is reduced according to the quickness with which the indicator changes, i.e. sum of . Maximizing the first plot at the expense of the second will cause the indicator to match the price action very well but therefore it will change very rapidly, from bullish to bearish, which is visualized by a background pattern that changes frequently from blue to red to blue. Ignoring the first plot and maximizing the second will also cause the indicator to more closely match the price action, but the transitions will be slower and less frequent, and will therefore focus on identifying the major trends of the market.
† The blue/red background has many layers and will make the chart lag as the user interacts with it.
‡ Bearish states are coded as negative quantities, so a bearish state x negative price action = positive number, and bullish state x positive price action = positive number.
6. Suggestions and Guidelines
As described in section (2.1), the indicator used in this strategy was designed to determine the state of the market--whether it is bullish or bearish--as well as the change in the state of the market--whether it is increasingly bullish or increasingly bearish. As such, the following suggestions are provided based on the principles of the indicator's design,
1. Response Time 1 should be less than (<) Response Time 2 which should be < Response Time 3
2. Fast Period < Moderate Period < Slow Period
3. In terms of the period of a full market cycle (e.g. ~ 4 years for BTC, ~ 5.5 years for equities, etc.), response times 1, 2, and 3 should be about 0.3% to 1%, 3% to 20%, and 20% to 50% of a full market cycle period, respectively. However, this is a loose guideline.
4. In terms of the period of a full market cycle, periods 1, 2, and 3 should all be about 25% to 75% of a full cycle period. Again, this is a loose guideline.
4. EMA 1 Length < EMA 2 Length < EMA 3 Length < EMA 4 Length
5. EMA Lengths 1, 2, 3, and 4 should be limited to about 1/4th the length of a full market cycle. Note, EMA lengths are measured in bars (candles), not in days. 1/4th of 1000 days is 250 days which is 250 x 4 = 1000 6-hr candles.
The following guidelines are provided based on results of over 100 backtests on the BTCUSD chart using randomized parameters †,
1. 9 days < Response Time 1 < 14 days
2. 5 days < EMA 1 Length < 100 days
3. 600 days < EMA 4 length < 1000 days
4. The ratio of the EMA range (EMA 4 len - EMA 1 len) to the sum of EMA lengths (EMA 1 len + EMA 2 len + ...) be greater than 0.4
5. The ratio of the sum of EMA 1 and EMA 2 lengths to the sum of EMA 3 and EMA 4 lengths be less than 0.3.
A suggestion from the author: Given that backtests show a high degree of outperformance using the guidelines enumerated above, a good trading strategy may be to not rely on any one particular combination of parameters. Rather, a random set of combinations of parameter settings that adhere to the guidelines above could be used to create multiple instances of the strategy in a TradingView chart, each of which varies by a small amount due to their unique parameter settings. The proportion of the entire set of strategy instances that agree about the current state of the market could indicate to the trader the level of confidence of the indicator, in aggregate.
† A sample dataset of backtest results using randomized parameters is available upon request; notably, all trials outperformed the intended market (Bitcoin).
7. General Remarks About the Indicator
Other than some exponential moving averages, no traditional technical indicators or technical analysis tools are employed in this strategy. No MACD, no RSI, no CMF, no Bollinger bands, parabolic SARs, Ichimoku clouds, hoosawatsits, XYZs, ABCs, whatarethese. No tea leaves can be found in this strategy, only mathematics. It is in the nature of the underlying math formula, from which the indicator is produced, to quickly identify trend changes.
8. Remarks About Expectations of Future Results and About Backtesting
8.1. In General
As it's been stated in many prospectuses and marketing literature, "past performance is no guarantee of future results." Backtest results are retrospective, and hindsight is 20/20. Therefore, no guarantee can, nor should, be expressed by me or anybody else who is selling a financial product (unless you have a money printer, like the Federal Reserve does).
8.2. Regarding This Strategy
No guarantee of future results using this strategy is expressed by the author, not now nor at any time in the future.
With that written, the author is free to express his own expectations and opinions based on his intimate knowledge of how the indicator works, and the author will take that liberty by writing the following: As described in section (7), this trading strategy does not include any traditional technical indicators or TA tools (other than smoothing EMAs). Instead, this strategy is based on a principle that does not change, it employs a complex indicator that is based on a math formula that does not change, and it places trades based on five simple rules that do not change. And, as described in section (2.1), the indicator is designed to capture the full character of the market, from a macro/global scope down to a micro/local scope. Additionally, as described in section (3), outperformance of the market for which this strategy was intended during backtesting does not depend on luckily setting the parameters "just right." In fact, all random combinations of parameter settings that followed the guidelines outperformed the intended market in backtests. Additionally, no parameters are included within the underlying math formula from which the indicator is produced; it is not as if the formula contains a "5" and future outperformance would depend on that "5" being a "6" instead. And, again as described, it is in the nature of the formula to quickly identify trend changes. Therefore, it is the opinion of the author that the outperformance of this strategy in backtesting is directly attributable to the fundamental nature of the math formula from which the indicator is produced. As such, it is also the opinion of the author that continued outperformance by using this strategy, applied to the crypto (Bitcoin) market, is likely, given that the parameter settings are set reasonably and in accordance with the guidelines. The author does not, however, expect future outperformance of this strategy to match or exceed the outperformance observed in backtests using the default parameters, i.e. it probably won't outperform by anything close to 13,000,000% during the next 9 years.
Additionally, based on the rolling 1-month outperformance data listed in section (3), expectations of short-term outperformance should be kept low; the median 1-month outperformance was -2%, so it's basically a 50/50 chance that any significant outperformance is seen in any given month. The true strength of this strategy is to be out of the market during large, sharp declines and capitalizing on the opportunities presented at the bottom of those declines by buying the dip. Given that such price action does not happen every month, outperformance in the initial months of use is approximately as likely as underperformance.
9. Access
Those who are interested in using this strategy may send a personal message to inquire about how to gain access. Those who are interested in acquiring the sample dataset of backtest results may send a personal message to request a copy of the data.

BITCOIN AUTO TRADING STRATEGYBITCOIN AUTO TRADING STRATEGY
This strategy shows buy and sell signal. Designed and optimized only for Bitcoin. You can use it spot or futures markets and 30 minutes time frame. Indicator gives trade points when optimized sma trending but filtered choppinnes index. Profit factor over 3 for all time backtest period. Care using when you set leverage. I recommend maximum 5x leverage for auto trading.
Profitable trade count 119
Lost trade count 115
Profit factor 3
For access message me or go to my web link on my profile.

PARSEC Bitcoin strategy for testing: SMA + ADX + Fisher transfStrategy using SMA, ADX and modified Fisher transform (I've made linear transformation on original Ehler's Fisher transform) and implemented into Bitcoin trading perspective.
Current strategy is optimized for Bitcoin.
General objectives is to add, remove indicators:
- to further improve the strategy for Bitcoin
- adjust the strategy to be feasible for wider range of cryptocurrencies (preferably for the top 2-5 or top 2-10 ones), without significantly decreasing the current profit factor and profit rates
Experienced technical analysts feel free to PM me if you want to test the strategy (at this stage up to 5 people's participation would be appreciated).
For those ones who significantly contribute, I will give life-long access to both the improved strategy and alerts.

Crypto Signals Bot - AutoTrader Strategy - BitcoinVery excited to release our new fully automated trading bot specifically for Bitcoin.
We use this system with AutoView to trade on Bitmex and it is specifically designed for Bitcoin on the 2 Hour charts.
It includes everything you will need:
AutoTrader Strategy
AutoTrader Indicator
All Alerts Syntax for AutoView
This has been producing amazing results and is a fully automated trading system that will take buys (long) and sells (short) on Bitcoin with supported crypto exchanges.
To signup, go to this URL: www.cryptosignalsbot.com

Crypto Volatility Bitcoin Correlation Strategy Description:
The Crypto Volatility Bitcoin Correlation Strategy is designed to leverage market volatility specifically in Bitcoin (BTC) using a combination of volatility indicators and trend-following techniques. This strategy utilizes the VIXFix (a volatility indicator adapted for crypto markets) and the BVOL7D (Bitcoin 7-Day Volatility Index from BitMEX) to identify periods of high volatility, while confirming trends with the Exponential Moving Average (EMA). These components work together to offer a comprehensive system that traders can use to enter positions when volatility and trends are aligned in their favor.
Key Features:
VIXFix (Volatility Index for Crypto Markets): This indicator measures the highest price of Bitcoin over a set period and compares it with the current low price to gauge market volatility. A rise in VIXFix indicates increasing market volatility, signaling that large price movements could occur.
BVOL7D (Bitcoin 7-Day Volatility Index): This volatility index, provided by BitMEX, measures the volatility of Bitcoin over the past 7 days. It helps traders monitor the recent volatility trend in the market, particularly useful when making short-term trading decisions.
Exponential Moving Average (EMA): The 50-period EMA acts as a trend indicator. When the price is above the EMA, it suggests the market is in an uptrend, and when the price is below the EMA, it suggests a downtrend.
How It Works:
Long Entry: A long position is triggered when both the VIXFix and BVOL7D indicators are rising, signaling increased volatility, and the price is above the 50-period EMA, confirming that the market is trending upward.
Exit: The strategy exits the position when the price crosses below the 50-period EMA, which signals a potential weakening of the uptrend and a decrease in volatility.
This strategy ensures that traders only enter positions when the volatility aligns with a clear trend, minimizing the risk of entering trades during periods of market uncertainty.
Testing and Timeframe:
This strategy has been tested on Bitcoin using the daily timeframe, which provides a longer-term perspective on market trends and volatility. However, users can adjust the timeframe according to their trading preferences. It is crucial to note that this strategy does not include comprehensive risk management, aside from the exit condition when the price crosses below the EMA. Users are strongly advised to implement their own risk management techniques, such as setting appropriate stop-loss levels, to safeguard their positions during high volatility periods.
Utility:
The Crypto Volatility Bitcoin Correlation Strategy is particularly well-suited for traders who aim to capitalize on the high volatility often seen in the Bitcoin market. By combining volatility measurements (VIXFix and BVOL7D) with a trend-following mechanism (EMA), this strategy helps identify optimal moments for entering and exiting trades. This approach ensures that traders participate in potentially profitable market moves while minimizing exposure during times of uncertainty.
Use Cases:
Volatility-Based Entries: Traders looking to take advantage of market volatility spikes will find this strategy useful for timing entry points during market swings.
Trend Confirmation: By using the EMA as a confirmation tool, traders can avoid entering trades that go against the trend, which can result in significant losses during volatile market conditions.
Risk Management: While the strategy exits when price falls below the EMA, it is important to recognize that this is not a full risk management system. Traders should use caution and integrate additional risk measures, such as stop-losses and position sizing, to better manage potential losses.
How to Use:
Step 1: Monitor the VIXFix and BVOL7D indicators. When both are rising and the Bitcoin price is above the EMA, the strategy will trigger a long entry, indicating that the market is experiencing increased volatility with a confirmed uptrend.
Step 2: Exit the position when the price drops below the 50-period EMA, signaling that the trend may be reversing or weakening, reducing the likelihood of continued upward price movement.
This strategy is open-source and is intended to help traders navigate volatile market conditions, particularly in Bitcoin, using proven indicators for volatility and trend confirmation.
Risk Disclaimer:
This strategy has been tested on the daily timeframe of Bitcoin, but users should be aware that it does not include built-in risk management except for the below-EMA exit condition. Users should be extremely cautious when using this strategy and are encouraged to implement their own risk management, such as using stop-losses, position sizing, and setting appropriate limits. Trading involves significant risk, and this strategy does not guarantee profits or prevent losses. Past performance is not indicative of future results. Always test any strategy in a demo environment before applying it to live markets.

B LAODA bitcoin MACD aptimize Strategy B LAODA bitcoin MACD aptimize Strategy
1 MACD parameter optimization
2 while crossover macd 0 line buy
crossunder macd 0 line then sell
simple and effective,the bitcoin market ,suggest with 4H frame or more for reduce wing
stock market suggest with 1D frame

Crypto Wave Rider Indicator - Bitcoin & Crypto SignalerAfter months of research and testing, I have developed the first public beta of my Crypto trading script.
Note the following:
1.) This algo works best with /USD pairings (e.g. ETH/USD). Doesn't work as well with /BTC pairings (e.g. ETH/BTC). I believe this is because USD is stable and allows for better data (rather than comparing two very volatile assets to each other).
2.) This algo works best on swing trading time frames (4 hour - 12 hour) but can also be used on lower time frames (although lower than 1 hr is not recommended). For reference, I've found the best time frames to be as follows: BTC - 6 hour, LTC - 4 hour, ETH - 12 hr
So far, the results have been far better than the other bots/indicators I've come across.
This indicator has been optimized for use on Bitcoin with 6 hour candles just because Bitcoin is the oldest crypto & has the most backtesting data available. And 6 hour time frame because I prefer swing trading over day trading.
Feel free to test on different time frames and coins to see what gets the best results.
Comments and feedback appreciated!!
************Note: Please do not ask me for the source code. It is protected for a reason....I won't be giving it out to anyone.*************

Crypto Money Bot - Trading Bot for Bitcoin (BTCUSD)This takes my previous script, adds even more logic conditions, and sets up long and short entries in a strategy that can trade.
Default settings with a $5,000 starting balance have shown this bot to get the following results:
Net Profit: $ 10302.70 / 206.05 %
EXAMPLES
LOGIC
This indicator looks for accumulation of buying and selling along with trend flows for oversold and overbought opportunities to align the trade entries. It does not trade all the time, but when it does pull a trade the success rates are higher.
You could choose to pair this with another indicator to do a manual entry, or to manage your stop losses and money management strategy.
PROOF
Check out the reviews on the original indicator that this is built upon (and more logic) is here:
NOTES
You can try this strategy on other charts if you want, it is only tested and supported on BTCUSD. To try it on ETHUSD, change the settings from BTC to ETH. If you get a "resolve_error" it means that specific coin is not supported.
ACCESS
If you'd like to use my custom indicator - send 0.05 BTC to 32Hagdtq7PCR4inF4ZPkCReEjyecm2eNaP then email me at samurai_crypto@protonmail.com with your TradingView username and your transaction ID and I will add you.
Costs are lifetime with full support via email on how to use it.

Lazy Monies Bitcoin Scalper PublicIf you are a Mod seeing this as a duplicate script please take down my other one instead of this one. This is the same script as "Lazy Monies Bitcoin Scalper" on my account, however this is set to protected instead of invite only which I set the last one by mistake.
An edit of my previous script "1h gold lazy monies" so that it can be applied to 5m bitcoin charts. Unfortunately the time scale that it can be back tested for is quite short so it only manages to test 40 trades, so I would be a little cautious trading using this under very different market conditions. The fact that Bitcoin is largely traded emotionally by stoners and flat earthers from their mothers basement makes it easier to be a parasite off those tiny swings. Average trade length is about 9 hours but that is because trades that have the ability to catch larger moves stay open longer, most trades are designed for shorter time frames. It is able to make profit through up and down trends. DO NOT trade this strategy through CFDs because the spread will eat up all your profit.

Bitcoin & Ethereum Profitable Crypto Investor – FREE EditionBitcoin & Ethereum Profitable Crypto Investor – FREE Edition
by RustyTradingScripts
This is the free, simplified edition of my long-term crypto trend-following strategy designed for Bitcoin, Ethereum, and other major assets. It provides an accessible introduction to the core concepts behind the full version while remaining easy to use, transparent, and beginner-friendly.
This FREE edition focuses on a single technical component: a 102-period Simple Moving Average trend model. When price moves above the SMA, the script considers it a potential long trend environment. When the slope begins to turn down, the strategy exits the position. This creates a straightforward, rules-based framework for identifying trend shifts without emotional or discretionary decision-making.
The goal of this simplified version is to help users understand how a structured trend approach behaves during different market conditions. It demonstrates how using a slow, objective indicator can reduce noise and provide clearer long-term directional context on higher timeframes such as the 10-hour BTC chart shown in the backtest example.
What This FREE Version Includes
- Trend-based entries using a 102-period SMA
- Automatic exits when the SMA slope turns down
- Clean visual plot of the moving average
- No repainting — signals are based on confirmed bar data
- Works on BTC, ETH, and other major crypto assets
- User-adjustable SMA length for customization
What’s Not Included in This Version:
This edition intentionally focuses on the essential trend logic only.
It does NOT include the following components found in the full investor strategy:
- Linear regression smoothing
- Seasonal filters
- Price-extension filtering
- Volume-based protection
- Partial stop-loss and partial take-profit systems
- Cooldown logic after profitable trades
- RSI-based extended exits
- Multi-layered trade management modules
The purpose of this free version is to provide a clear, functional introduction to the underlying trend concept without the advanced filters and risk-management features that are part of the complete system.
How to Use It
Apply the script to your preferred asset and timeframe (commonly higher timeframes such as 4H, 8H, 10H, 12H, or 1D). The script will enter long positions when the market is trading above the SMA and exit when the slope of the average begins to point downward. Users may adjust the SMA length to match their preferred level of responsiveness.
Important Notes
This script is for educational and analytical purposes.
Historical results are not guarantees of future performance.
Always practice proper risk management and perform your own testing.
This script does not repaint.
This FREE version is meant as a helpful starting point for those exploring long-term crypto trend strategies. If you find it useful and wish to explore more advanced tools, feel free to reach out for additional information.
