Pivot Points Daily - bitcoin by Simon-RoseDaily Version:
I have written 3 Indicators because i couldn't find what i was looking for in the library, so you can turn each one on and off individually for better visibility.
This are Daily, Weekly and Monthly Pivot Points with their Resistance and Support Points
and also on the Daily with the range between them.
I will also publish some Ideas to show you how to use them if you are not familiar with the traditional pivot points strategy already.
Unlike the usually 3 support & resistances i added 4 of them, specifically for trading bitcoin (on traditional markets this level of volatility usually never gets touched)
Here you can see which lines are what for reference, as the Feature to label lines is missing in Pinescript (if you have a workaround pls tell me ;) )
This is the basic calculation used :
PP = (xHigh+xLow+xClose) / 3
R1 = vPP+(vPP-Low)
R2 = vPP + (High - Low)
R3 = xHigh + 2 * (vPP - Low)
R4 = xHigh + 3 * (vPP - Low)
S1 = vPP-(High - vPP)
S2 = vPP - (High - Low)
S3 = xLow - 2 * (High - PP)
S4 = xLow - 3 * (High - PP)
If you have any questions or suggestions pls write me :)
Happy trading
Cheers
Weekly Version:
Monthly Version:
Cari dalam skrip untuk "bitcoin"

LOTUS Bitcoin traderThis script is strictly created for trading bitcoin only. Do not attempt to use this for any other charts. The LOTUS Bitcoin trader is only meant to be used with Heikin Ashi candles, and only on the 2 hour time frame. Recommended to only use this on the Binance BTC/USDT chart. To use this script correctly, you must sell when the first red triangle appears and buy when the first green triangle appears. You can also set email, SMS and pop up alerts!

U.S. Stocks & Options CVI to Bitcoin Correlation [NeoButane]Conceptual indicator based on trying to find an inverse correlation between bitcoin and traditional markets due to bitcoin's usefulness as a hedge against economic downturns.
How to use this script: you look at it and see if there is a correlation or not between bitcoin/Ethereum price and either U.S. stock CVi, buy volume, sell volume, calls, puts, or the call/put ratio.

Crypto Money Index - buy Signals for Bitcoin and MoreAn updated version of my previous script, this one includes buy alerts.
It has been tested with Bitcoin (BTC), Monero (XMR), Ethereum (ETH), Dash (DSH), Bitcoin Cash (BCH), LiteCoin (LTC), and IOTA (IOT).
To use for Futures on BitMex (as shown in examples), you need to use the Override feature and set the prefix. For example, Bitcoin futures on BitMex is XBTZ17 - so you would set the override to true and pair to BTC. For Ethereum futures on BitMex, you would turn the override to true and set the pair to ETH.
For USD based pairs (BTCUSD, ETHUSD) it will update automatically.
Ok, on to examples...
Here is how we can see the Bitcoin Cash pump that happened this week BEFORE it happened by seeing price action in the indicator:
Here is a similar example with DASH:
Here is another (again) example with Monero (XMR):
Lastly, IOTA (IOT) with lots of buying signals and double bottoms to play with... regardless if you got in early and rode a small loss for a bit, it popped as well.
ALERTS
To have an alert, create one on the chart and set it based on Trigger being greater than 0.
ACCESS
If you'd like to use my custom indicator - send 0.01 BTC to 32Hagdtq7PCR4inF4ZPkCReEjyecm2eNaP then email me at samurai_crypto@protonmail.com with your TradingView username and your transaction ID and I will add you.
Costs are lifetime with full support via email on how to use it.

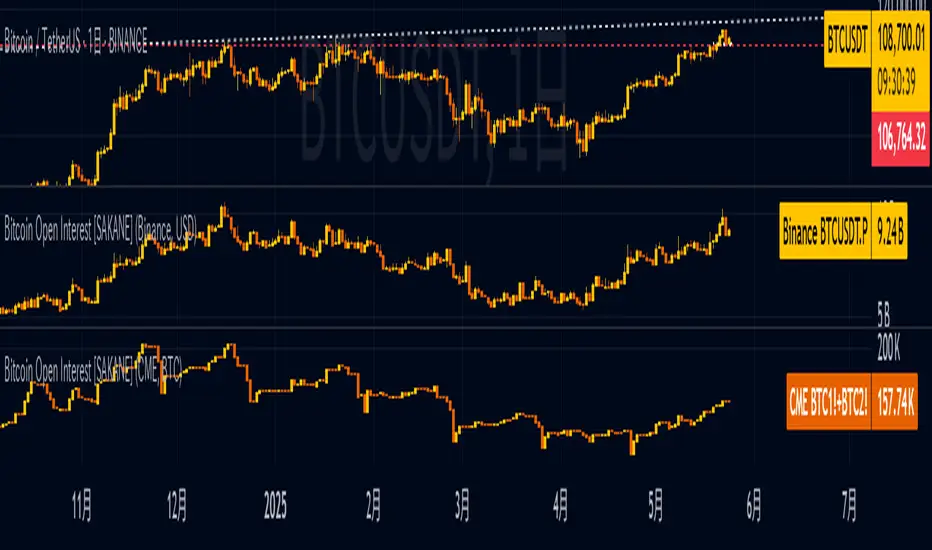
Bitcoin Open Interest [SAKANE]Bitcoin Open Interest
— Unveiling the True Flow of Capital
PurposeVisualize and compare Bitcoin open interest (OI) from CME and Binance, the leading derivatives exchanges, in a single intuitive chart, providing traders with clear insights into crypto market capital dynamics.
Background & MotivationIn the 24/7 crypto market, price movements alone reveal only part of the story. Open interest (OI)—the total outstanding futures contracts—offers critical clues to the market’s next move. Yet, accessing and interpreting OI data is challenging:
CME Constraints: Commitment of Traders (COT) reports are weekly, and standalone BTC1! or BTC2! OI is noisy due to contract rollovers, obscuring true OI changes.
Existing Tool Limitations: Most OI indicators are fixed to either USD or BTC, limiting flexible analysis.
This indicator overcomes these hurdles, enabling seamless comparison of CME and Binance OI to track the market’s “capital center of gravity” in real time.
Key Features
Synthetic CME OI: Combines BTC1! and BTC2! to deliver high-accuracy OI, eliminating rollover noise.
Multi-Timeframe Analysis: Displays daily CME OI as pseudo-candlestick (OHLC) on any timeframe (e.g., 4H), allowing intuitive capital flow tracking across timeframes.
CME/Binance One-Click Toggle: Instantly compare institutional-driven CME and retail-driven Binance OI.
USD/BTC Flexibility: Switch between BTC (real demand) and USD (margin) perspectives for OI analysis.
Robust Design: Concise, global-scope code ensures stability and adaptability to TradingView updates.
Insights & Use Cases
Holistic Market Sentiment: Analyze capital flows by region and exchange for a multidimensional view.
Signal Detection: E.g., a sharp drop in CME OI during a sell-off may signal institutional withdrawal.
Retail Trends: A surge in Binance OI suggests retail-driven inflows.
Event-Driven Insights: E.g., during a hypothetical April 2025 “Trump Tariff Shock,” instantly identify which exchange drives capital shifts.
Unique ValueUnlike price-centric indicators, this tool focuses on capital flow (OI). It’s the only indicator offering one-click multi-timeframe and multi-exchange OI comparison, empowering traders to uncover the market’s “true intent” and gain a strategic edge.
ConclusionBitcoin Open Interest makes the market’s hidden capital movements accessible to all. By capturing market dynamics and pinpointing the “leading forces” during events, it sets a new standard for traders seeking a revolutionary perspective.
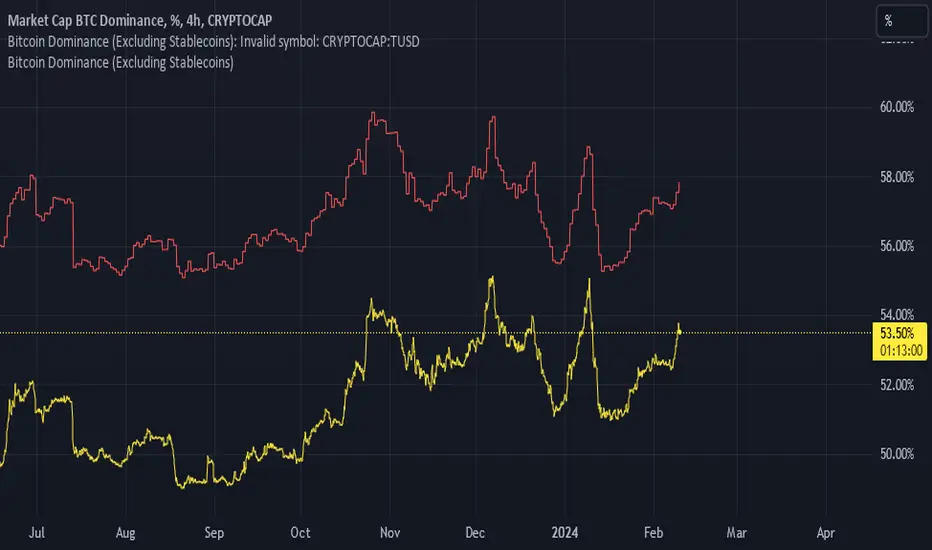
Bitcoin Dominance (Excluding Stablecoins)Bitcoin dominance as provided by Trading View's BTC.D ticker fails to account for the fact that crypto is an isolated market and should not include stablecoins in their calculations.
Godspeed anon.
[SM] Bitcoin cycles bull market
An indicator to determine the seasonality / cyclicality of bitcoin for long trades.
Application
- For traders: Identification of zones with lower risk of entering long positions
- For swing traders and investors: customizable calendar of entries into long position
Indicator structure
1. Vertical zones (green and red) of time ranges. Only for historical bars. The range width is adjustable in the indicator settings.
2. Table (in the form of a calendar) for determining the time of entering a trade in the future. The table is not editable. It displays the result of the configured zones on the historical bars.
General settings
- choose the color of the Tradingview theme (light or dark)
Table settings
- Turn table display on / off
- Set the number of months to be displayed in the table
Settings of vertical zones (green and red)
Each cycle (1 month summer, 1 month autumn, ...) has four dates
- start date of the green zone (day and month)
- date of the end of the green zone
- start date of the red zone
- date of the end of the red zone

(D7R) BAKKT Bitcoin FuturesBAKKT Bitcoin Quarterly Contract Futures Price with 3 different display modes: (Percentage, Delta, Absolute).
This information can be used to understand when futures are trading at relative strong/weak premium or discount against each other.
This information can either be used for cash-n-carry arbitrage, inter-exchange arbitrage, hedging or directional price speculation.

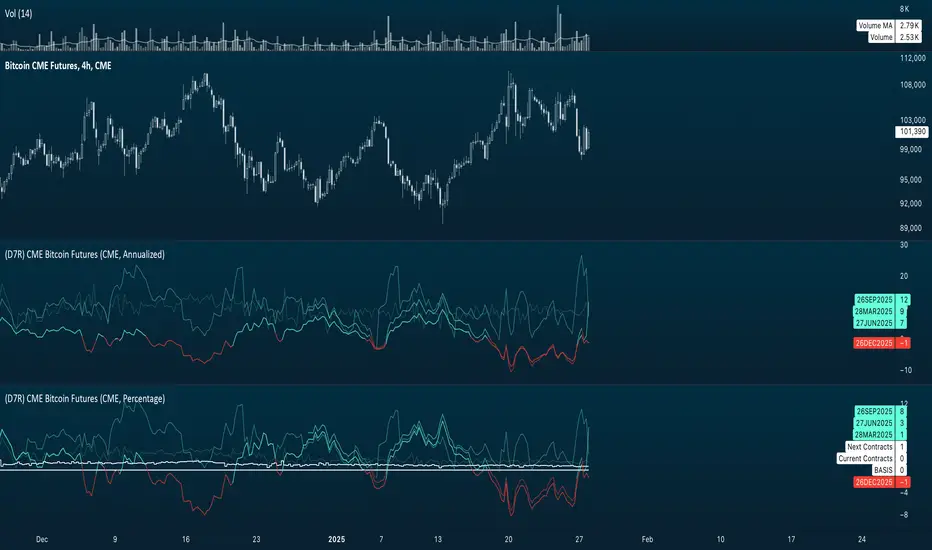
(D7R) CME Bitcoin FuturesCME Bitcoin Quarterly Contract Futures Price with 3 different display modes: (Percentage, Delta, Absolute).
This information can be used to understand when futures are trading at relative strong/weak premium or discount against each other.
This information can either be used for cash-n-carry arbitrage, inter-exchange arbitrage, hedging or directional price speculation.
SSR - Stablecoin Supply Ratio - Bitcoin - CryptocurrencyThe Stablecoin Supply Ratio (SSR) is the ratio between Bitcoin supply and the supply of stablecoins, denominated in BTC.
When the SSR is low, the current stablecoin supply has more "buying power" to purchase BTC. It serves as a proxy for the supply/demand mechanics between BTC and USD.

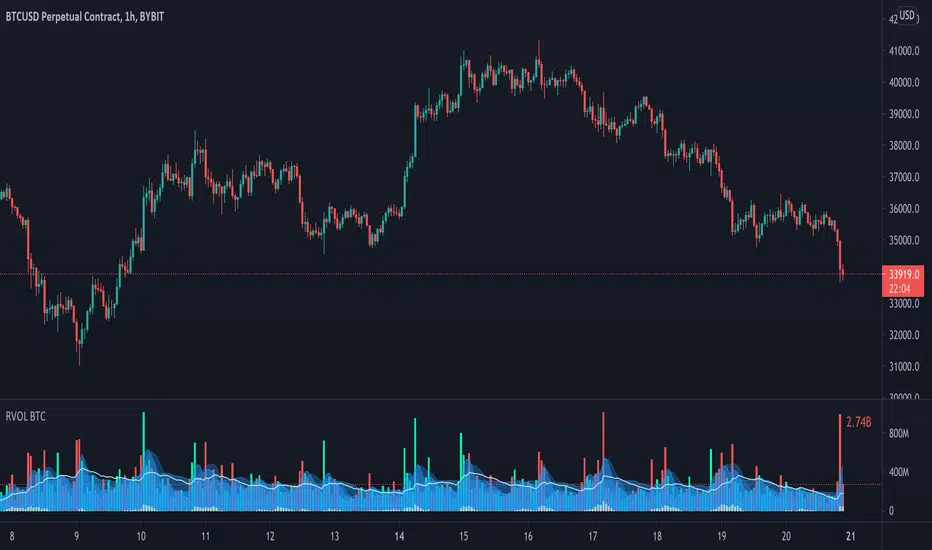
Relative Volume - BITCOINRelative Volume indicator that pulls data from 9 different Bitcoin exchanges. Please note that this indicator only works with BTC and will not use data from your current chart.
Includes the following exchanges:
BYBIT:BTCUSD
BITFINEX:BTCUSD
BITSTAMP:BTCUSD
INDEX:BTCUSD
COINBASE:BTCUSD
FTX:BTCUSD
PHEMEX:BTCUSD
BITTREX:BTCUSD
POLONIEX:BTCUSDT
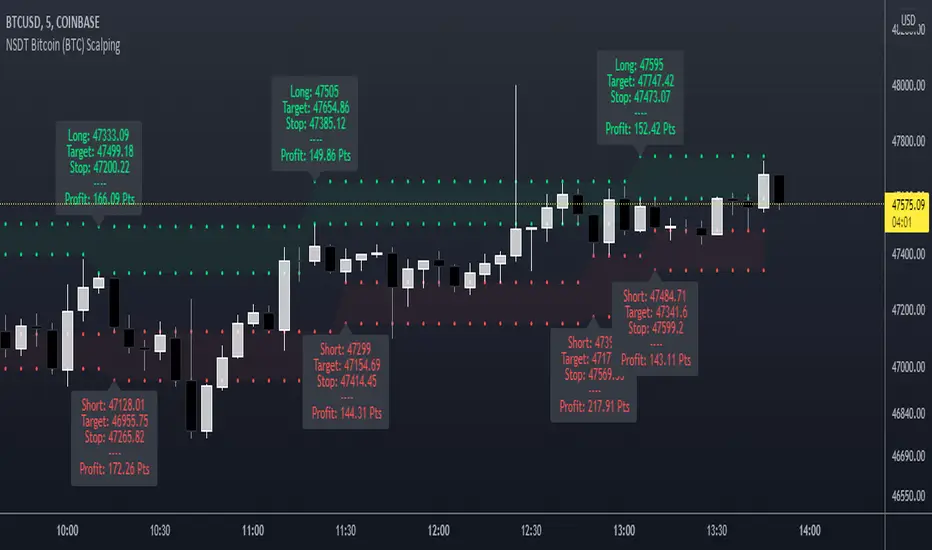
NSDT Bitcoin (BTC) ScalpingThis indicator is specifically designed for scalping Bitcoin (BTC). It looks for a particular price pattern/sequence and displays a label on the chart to show a potential entry, target, and stop based on that analysis. Basically enter long through the green zones and short through the red zones. These levels are not guaranteed to be hit. Trading is risking and you can lose money. Trade at your own discretion and risk. This indicator is only providing potential scalping zones based on recent price action.
Keltner + RSI Bitcoin Futures Trading [luca_badoer]This indicator combines the power of the Keltner channel with the power of the Relative Strength Indicator (RSI). It can help understand when the market is entering a bullish or a bearish trend.
Normally a Keltner channel would reference an Exponential Moving Average (EMA) of the price. In this case the Keltner Channel in the "Keltner + RSI Bitcoin Futures Trading " references the EMA of the 14-day RSI (white line). On top of that it overlays a 7-day RSI line (blue line). This produces some signals that are particularly useful in 2h, 4h and 1 day charts. The signals consist in the 7-day RSI line (blue line) crossing the upper (green) or lower (red) Keltner channels as well as the middle (white) line. Depending on the direction of the crossing (up or down) and the RSI level (from 0 to 100) at which the crossing takes place this produces bullish or bearish signals.
Examples:
- Bullish crossing: 7-day RSI (blue) crosses both the lower (red) and middle (white) lines upwards at a low to neutral RSI level (<70%)
- Bearish crossing: 7-day RSI (blue) cross both the upper (green) and middle (white) lines downwards at a high to neutral RSI (>30%)
Recommendations:
- Better to use it in 2h, 4h, and 1-day charts, thought it can also be used in lower timeframes. Confirmations of crossings in higher time-frames provide more certainty about the direction of the move.
- Use in combination with Heikin Ashi candles and volume indicators.

Price in BitcoinHi folks,
This script simply converts the price of assets from USD to bitcoin and displays that price in a separate chart. Currently, only assets quoted in USD will work but I will add more currencies in the future.
Use:
1. Make sure the asset you're viewing is quoted in USD or USX. To check, hover over the symbol on the top left part of the chart, click the "More" ellipsis and select "Symbol Info". The currency will be among the info displayed.
2. Apply the script and view the chart at your own risk.
Math:
price(btc) = (x/usd) / (btc/usd)
Cheers!
Jared

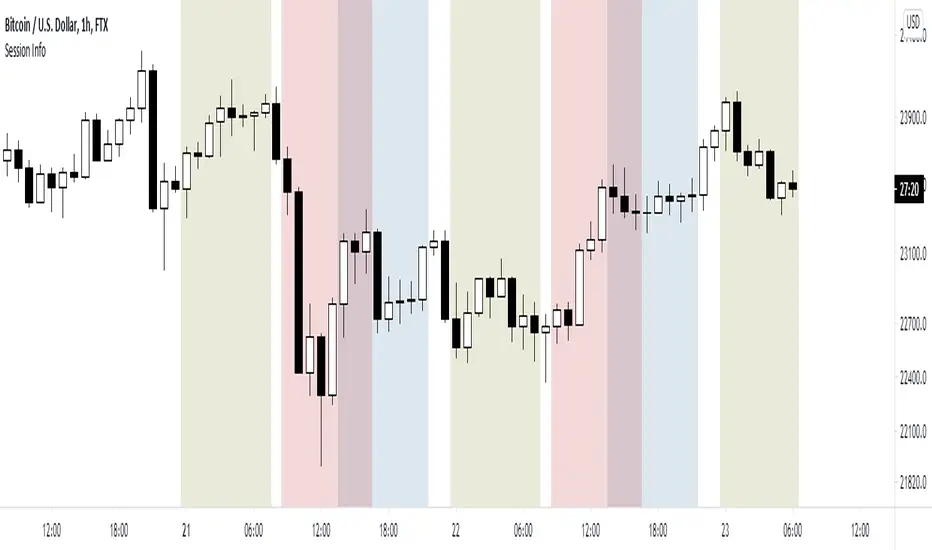
World market Session Information for bitcoinIt marks out different world markets active timings on the bitcoin charts.
You can also modify the script to a strategy and test out different strategies.
CONSOL SPOT BITCOIN OBVA better OBV analysis tool hardcoded for combined Spot Bitcoin Exchange Volume.
Will dynamically change with Timeframe
Won't Dynamically change with the ticker.
Exchanges:
STAMP BTCUSD
COINBASE BTCUSD
COINBASE2 BTCEUR
COINBASE3 BTCUSDC
COINBASE4 BTCGBP
BINANCE BTCUSDT
BINANCE2 BTCUSDC
BINANCE3 BTCPAX
BITFINEX BTCUSD
KRAKEN XBTUSD
KRAKEN2 XBTEUR

Wasabi Bitcoin Volatility (BitMEX BVOL Index)This is Wasabi Bitcoin Volatility (BitMEX BVOL Index) which simulates the way the BitMEX BVOL index is described.
The good thing about this indicator as compared to the original BitMEX BVOL is that this indicator shows the volatility data on or prior to 2017.
이 지표는 와사비의 비트코인 변동성 지수 입니다. 이 것은 비트맥스의 BVOL 인덱스 계산 방식으로 범용으로 다른 거래소에 적용하기 위해 만들었습니다.
이 지표가 비트맥스의 BVOL 보다 유용한 점은 2017년 이전 데이타도 표현된다는 것입니다.
보다 자세한 제작 과정은 아래 프로파일 문구의 장소에 있는 관련 영상을 찾아보시기 바랍니다.

Ace Pro XBTUSD Bitcoin 9Min Bullish Move Short IndicatorThe Ace Pro XBTUSD Bitcoin 9 Minute Bullish Move Short calculates overbought and oversold conditions to help traders who are scalping in bullish market conditions.
It focuses on momentum to identify whether the market is overbought or oversold.
If it detects that the market is overbought, it gives an alert of “Short entry”
If it detects that the market is oversold, it gives an alert of “Short exit”
Users are also able to set notifications on Tradingview with this version of the indicator and be notified on their phone, computer, or email whenever the indicator fires an alert of "Short entry" or Short exit".
To set an alert, after adding the indicator, at the top left of the chart where the indicator is listed, click on the "more" option (three dots), and then select "Add alert."
-----------------------------------------------------------------------------------------------------------------------------------
Improvements for this indicator:
It is designed for traders who are high-speed lower time frame scalper, and who specifically use the nine minute chart. This indicator is specifically for bullish market conditions
-----------------------------------------------------------------------------------------------------------------------------------
Please note the following:
This indicator is only to be used on the 9 minute Bitmex XBTUSD chart
It is only to be used for opening and closing short positions.
It is not recommended for use with long positions.
It is not recommended for use with time frames other than the 9 minute.
It is not recommended for use with charts other than the 9 minute XBTUSD Bitmex chart
In a sideways market, or during a violent move, it is likely to produce false signals.
Traders must use confluence from their technical analysis to enter trades.
The stop loss line on this indicator is designed with a 1.5% stop loss.

Ace Pro XBTUSD Bitcoin 9Min Bullish Move Long IndicatorThe Ace Pro XBTUSD Bitcoin 9 Minute Bullish Move Long calculates overbought and oversold conditions to help traders who are scalping in bullish market conditions.
It focuses on momentum to identify whether the market is overbought or oversold.
If it detects that the market is oversold, it gives an alert of “Long entry”
If it detects that the market is overbought, it gives an alert of “Long exit”
Users are also able to set notifications on Tradingview with this version of the indicator and be notified on their phone, computer, or email whenever the indicator fires an alert of "Long entry" or Long exit".
To set an alert, after adding the indicator, at the top left of the chart where the indicator is listed, click on the "more" option (three dots), and then select "Add alert."
-----------------------------------------------------------------------------------------------------------------------------------
Improvements for this indicator:
It is designed for traders who are high-speed lower time frame scalper, and who specifically use the nine minute chart. This indicator is specifically for bullish market conditions.
-----------------------------------------------------------------------------------------------------------------------------------
Please note the following:
This indicator is only to be used on the 9 minute Bitmex XBTUSD chart
It is only to be used for opening and closing long positions.
It is not recommended for use with short positions.
It is not recommended for use with time frames other than the 9 minute.
It is not recommended for use with charts other than the 9 minute XBTUSD Bitmex chart
In a sideways market, or during a violent move, it is likely to produce false signals.
Traders must use confluence from their technical analysis to enter trades.
The stop loss line on this indicator is designed with a 1.5% stop loss.

Ace Pro XBTUSD Bitcoin 7Min Long Indicator Lambo Moon The Ace Pro XBTUSD Bitcoin 7 Minute Long Indicator Lambo Moon Edition calculates overbought and oversold conditions to help traders who are scalping in bullish market conditions.
It focuses on momentum to identify whether the market is overbought or oversold.
If it detects that the market is oversold, it gives an alert of “Long entry”
If it detects that the market is overbought, it gives an alert of “Long exit”
Users are also able to set notifications on Tradingview with this version of the indicator and be notified on their phone, computer, or email whenever the indicator fires an alert of "Long entry" or Long exit".
To set an alert, after adding the indicator, at the top left of the chart where the indicator is listed, click on the "more" option (three dots), and then select "Add alert."
-----------------------------------------------------------------------------------------------------------------------------------
Improvements for this indicator:
It is designed for traders who are high-speed lower time frame scalper, and who specifically use the seven minute chart. This indicator is specifically for bullish market conditions.
-----------------------------------------------------------------------------------------------------------------------------------
Please note the following:
This indicator is only to be used on the 7 minute Bitmex XBTUSD chart
It is only to be used for opening and closing long positions.
It is not recommended for use with short positions.
It is not recommended for use with time frames other than the 7 minute.
It is not recommended for use with charts other than the 7 minute XBTUSD Bitmex chart
In a sideways market, or during a violent move, it is likely to produce false signals.
Traders must use confluence from their technical analysis to enter trades.
The stop loss line on this indicator is designed with a 1.5% stop loss.

Ace Pro XBTUSD Bitcoin 3 Min Long Indicator SHARKSHARK EDITIONThe Ace Pro XBTUSD Bitcoin 3 Minute Long Indicator SHARKSHARK EDITION calculates overbought and oversold conditions to help traders who are scalping in bullish market conditions.
It focuses on momentum to identify whether the market is overbought or oversold.
If it detects that the market is oversold, it gives an alert of “Long entry”
If it detects that the market is overbought, it gives an alert of “Long exit”
Users are also able to set notifications on Tradingview with this version of the indicator and be notified on their phone, computer, or email whenever the indicator fires an alert of "Long entry" or Long exit".
To set an alert, after adding the indicator, at the top left of the chart where the indicator is listed, click on the "more" option (three dots), and then select "Add alert."
-----------------------------------------------------------------------------------------------------------------------------------
Improvements for this indicator:
It is designed for traders who are high-speed lower time frame scalper, and who specifically use the three minute chart. This indicator is specifically for bullish market conditions.
-----------------------------------------------------------------------------------------------------------------------------------
Please note the following:
This indicator is only to be used on the 3 minute Bitmex XBTUSD chart
It is only to be used for opening and closing long positions.
It is not recommended for use with short positions.
It is not recommended for use with time frames other than the 3 minute.
It is not recommended for use with charts other than the 3 minute XBTUSD Bitmex chart
In a sideways market, or during a violent move, it is likely to produce false signals.
Traders must use confluence from their technical analysis to enter trades.
The stop loss line on this indicator is designed with a 1.5% stop loss.


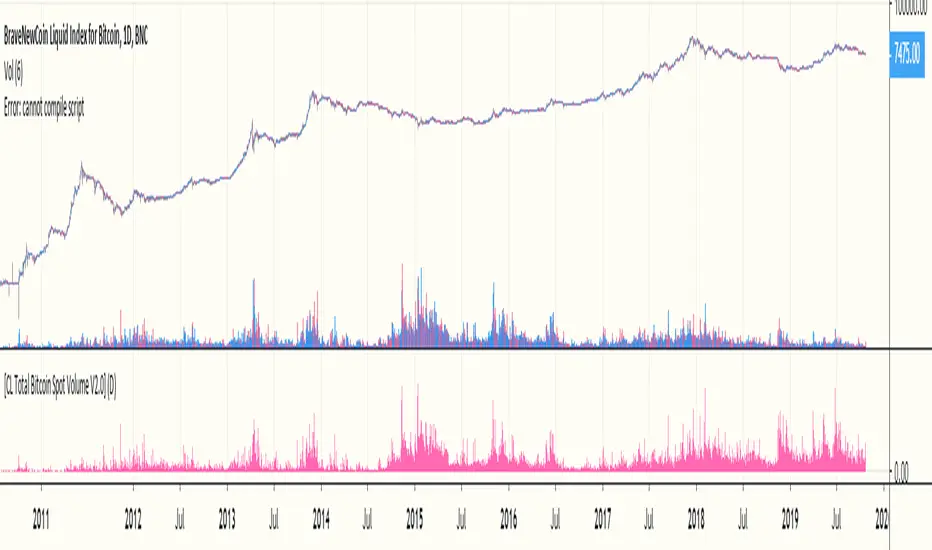
[CL Total Bitcoin Spot Volume V2.0]Total bitcoin volume across all trading pairs, includes historical data too such as mtgox and btcchina as well as almost all pairs on newly sprung up exchanges.
Volume charts are stitched together so adding indicators on top of this might not work.