Keltner | Bollinger | SqueezePercent B (%B), it's derivation Percent K (%K) and squeeze indicator combined in one.
blue line = bollinger %
orange line = keltner %
red background = squeeze*
squeeze = bollinger bands are inside (encapsulated by) keltner channel
Cari dalam skrip untuk "bollingerband"

Bollinger Bands Ema 50,200,800EMAs converted to Bollinger Bands The bands are 50, 200 and 800 period, forming a strategy and having clear trends and stronger supports and resistances (when the lines converge the area is stronger).
OBV w/BB+EMAOBV plotted with Bollinger Bands to show whether the volume is breaking out from its normal deviation (both up or down). The OBV changes color depending on the macro trend which is set using a 100 EMA.

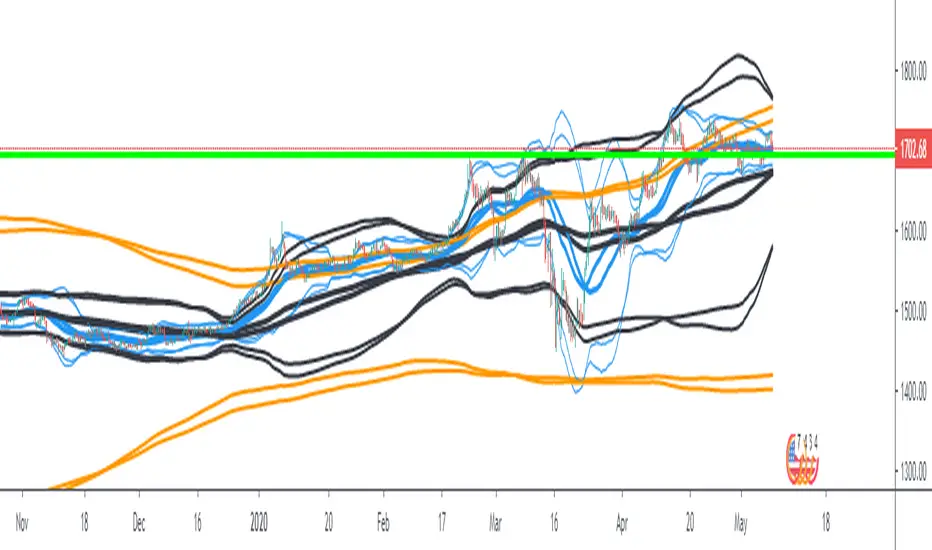
[fikira] Bollinger Bands + Higher Time FramesHere is my take on BB and MTF, based on the most excellent work of
"PineCoders" (MTF Selection Framework functions)!
The big advantage is that on 1 image you can easily see where
price is compared to 5 or less BB Bands (each of different Time Frames).
This gives a lot of Support and Resistance area's!
Includes:
- 1 Bollinger Bands (can be enabled/disabled - "Bollinger Bands"
- 4 Bollinger Bands (each can be enabled/disabled - "HTF Selection 1-4")
Each BB has its colour (can be changed)
- Labels (Timeframe and price) can be enabled/disabled
- Labels position and size can be changed
...

MA&ICH&BBCan be used in any time frame, any market (crypto,stock and FX) and any symbol. Values changeable and turntable on/off.
Include's :
- EMA/MA/WMA
- BB
- ICHIMOKU Kinko Hyo inspired by Kıvanç Özbilgiç

Pivot Boss 4 EMA + BB + Parabolic SAR + IchimokuA combination of a few of my favorite indicators.
1) Pivot Boss 4 EMA
2) Bollinger Bands
3) Parabolic SAR
4) Ichimoku Cloud
All credit to original authors.

NoScoobies Bollinger BandsBollinger Bands strategy that I am trying out, however I can't get my strategy.close to work. Looking for help.
CryptoBandsGuru MultiColor Bollinger BandsHere are my Bollinger Bands that come with 2 std dev bands and a variety of moving averages. The bands can have shading between the bands and the middle section can be shaded.
Moving Averages include:
SMA
EMA
Weighted
Hull
Symmetrical
Volume Weighted
Wilder
Right now my 2 favorites are the Hull with a std dev of .5 and the Wilder with a std dev of 1.7 and 2.0.
You can get some really good signals buy putting both on the same chart. The faster Hull will move above and below the slower Wilder and show good price action.

Bollinger Bands BAT/USDT 30minThis is ready to use Bollinger Band strategy that was backtested on the data from the previous year 2019.
The main purpose of this strategy is to determine trades with the highest probability of success, to keep a consistent portfolio growth throughout the year. This strategy cherry-picks the most reliable points of entry on a particular timeframe (30m) for the particular asset (BAT/USDT). The backtest shows a great result of 78.95% profitability with the maximum drawdown of -4.02%. This is one of my strategies out of the group of automated strategies that helps to grow my portfolio steadily.
You are welcome to change inputs and backtest the following strategy. Any comments or ideas would be appreciated.
If you are happy with existing results and would like to automate the strategy, which can be done through alerts, then you need to convert it to study and add alerts in the code.
Let me know if you are interested in that and I will create a study based on this strategy.

ZoneBand (@Mido_yuiya)Bollinger band is converted to EMA , and support and resistance bands are made into regions

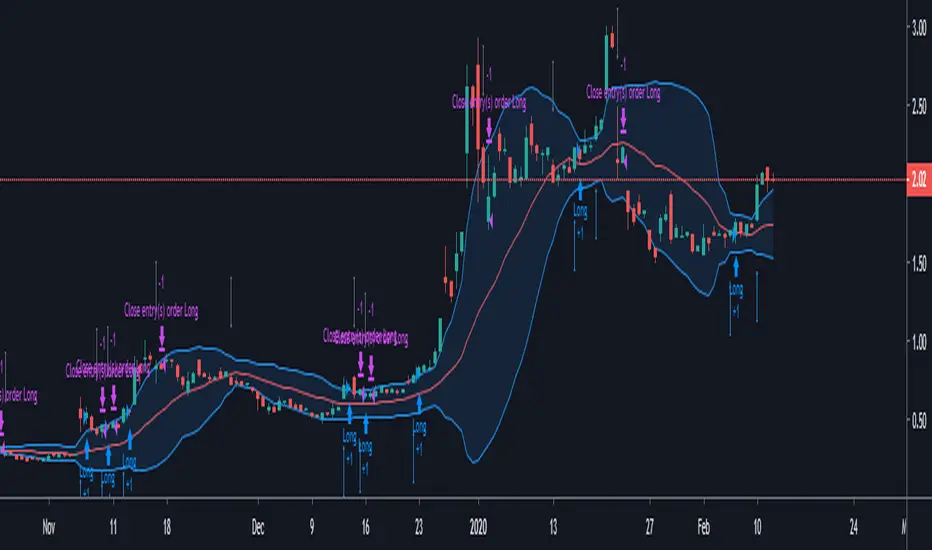
Bollinger Bands Trend Model-BuschiEnglish
In general, Bollinger Bands are used as an indicator to visualize the "reversion to the mean". However, in this model, by using smaller variable values (default: 10 time intervals instead of 20, 1 standard deviation instead of 2), they are used as an trend following indicator. Two consecutive closes above the upper band form a buy signal (symbol 'B' above bar) which is reversed by two consecutive closes below the lower band (symbol 'S' under bar) and vice versa. The corresponding buying (green) and selling (red) zones are coloured between the bands.
Deutsch
Im Allgemeinen werden Bollinger-Bänder als ein Indikator verwendet, um die "Rückkehr zum Mittelwert" zu visualisieren. In diesem Modell werden sie durch kleine Variablen-Werte (Standardwert: 10 Zeitintervalle anstatt 20, 1 Standardabweichung anstatt 2) jedoch als Trendfolge-Indikator verwendet. Zwei aufeinanderfolgende Schlusskurse über dem oberen Band (Symbol 'B' über dem Balken) bilden ein Kaufsignal, das durch zwei aufeinanderfolgende Schlusskurse unter dem unteren Band (Symbol 'S' unter Balken) umgekehrt wird. Gleiches gilt umgekehrt. Die entsprechenden Kauf-Zonen (grün) und Verkauf-Zonen (rot) werden zwischen den Bändern eingefärbt.

RW Simple Pairs TradeA Simple Implementation of a Pairs Trading Strategy
It uses a simple moving average of specified length (default = 20) and enters at cutoffs set by Entry ZScore. Trades are exited at the moving average.
It is intended to be run on pairs of stocks. To Spread KO and PEP, for example, use the ticker KO / PEP * 1000
To visualise the trade better add Bollinger bands to your charts, corresponding to the SMA length and Entry ZScore criteria you specified.

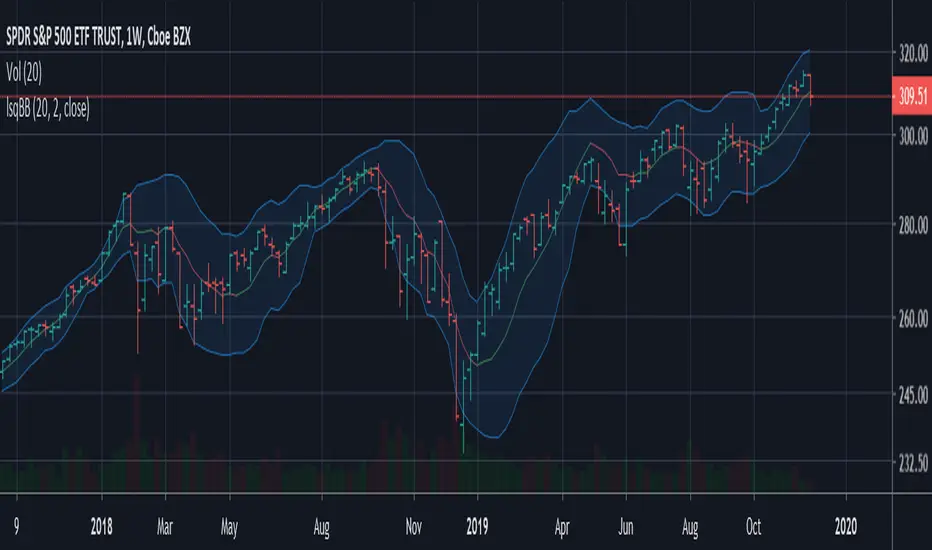
Least Squares Bollinger BandsSimilar to Bollinger Bands but adjusted for momentum. Instead of having the centerline be a simply moving average and the bands showing the rolling variance, this does a linear regression, and shows the LSMA at the center, while the band width is the average deviation from the regression line instead of from the SMA.
This means that unlike for normal Bollinger bands, momentum does not make the bands wider, and that the bands tend to be much better centered around the price action with band walks being more reliable indicators of undersold/oversold conditions. They also give a much narrower estimate of current volatility/price range.
Dr_All indicators V1.0Free users have many restrictions on their use in TradingView.
I put together a lot of indicators I use often.
5 moving average
1 parabolic SAR
1 bollinger band
1 ichimoku cloud
(but it's only cloud)
as always
It's open source.
enjoy!

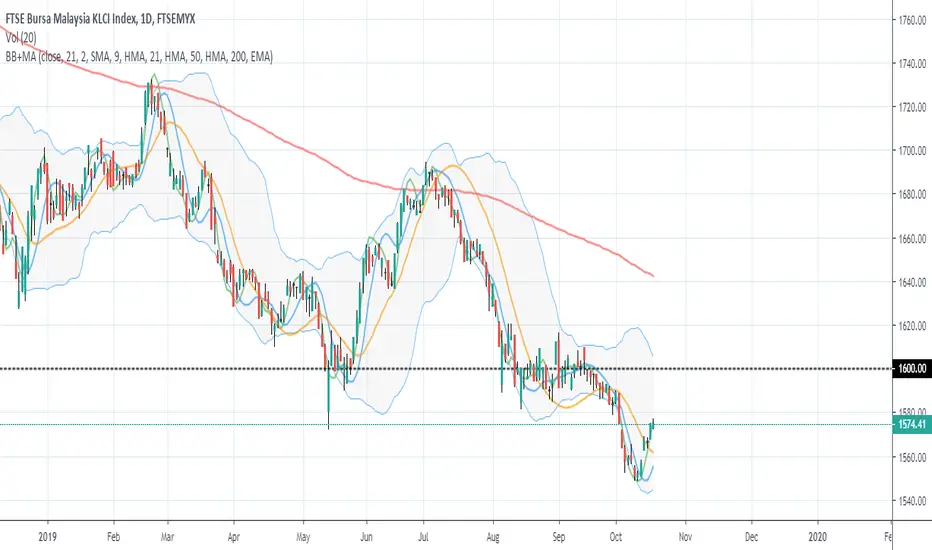
Bollinger Bands + Moving AveragesCombination of Bollinger Bands and 4 Moving Averages in one indicator.
The smoothing algorithm for the Bollinger Bands basis line and each of the Moving Averages can be chosen from either SMA , EMA , WMA , RMA, or HMA .
Multi Timeframe Bollinger BandsMulti Timeframe Bollinger Bands:
This script calculates and displays the Bollinger Bands for three different timeframes. The timeframes, moving averages and sigma values can be adjusted to personal likings. I publish this with an open visibility, feel free to tinker with it or suggest improvements.
Enjoy,
s0ullight

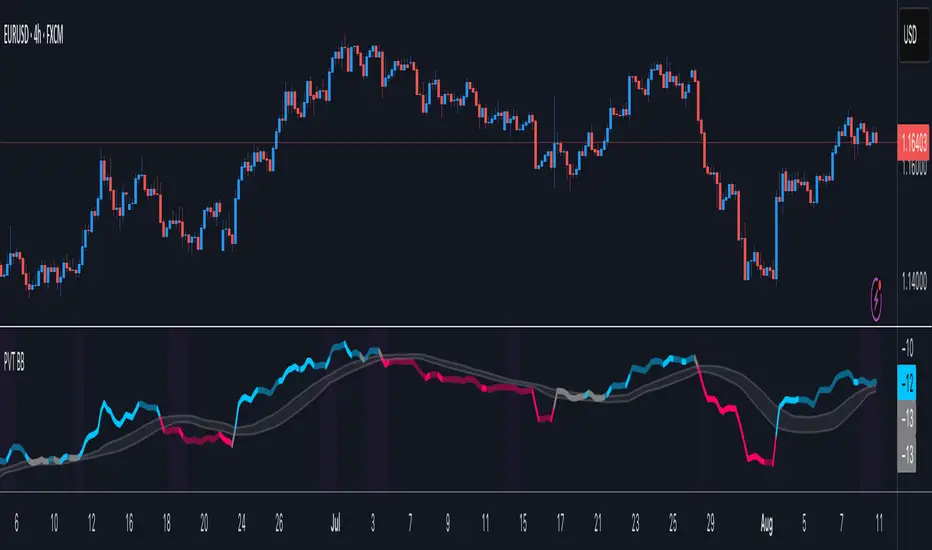
Price Volume Trend BBHey guys,
Ive been thinking about Price Volume Trend for a while and tried adding different moving averages to it, but seems its not as binary.
Therefore adding the bollinger bands as a no-trade-zone made it alot better. Indicator is pretty basic at the moment since I just implemented the idea but im planning to do some add-ons later on to make it easier to read.
Will keep you updated!
InfoPanel Indicators microtrendThis panel shows current value and trend of some well knonw indicators. It may be usefull because you have all indicators in one panel only.
thanks to: RicardoSantos for his script of panel coding
Tradingview scripts
Please use comment section for any feedback.

My Recursive Bands [ChuckBanger]This is a different type of bands. I modified Alex Pierrefeu Recursive Bands algo. It is a smoothed version of Alex's algo and imo it suites better for heikin ashi candles but it works well with regular candles.
How to use it:
When price hugs the upper band. It is a potential long and when price hugs the lower band it is a potential short.
Credits to Alex Pierrefeu: figshare.com

DAKELAX-XRPUSDT Bollinger Band Strategy for TradebotlerDAKELAX-XRPUSDT is a Tradebotler strategy designed to run on XRPUSDT for binance, it's a simple reverse to mean strategy and when backtested on may-aug 2019 on H1 timeframe it performs pretty well in backtest as well as running live.
In order to get started install the Tradebotler extension and connect the strategy with Binance or other crypto exchanges of your choice such as Kraken, Bitstamp, Bitmex, Bittrex, Polyneux etc, etc.


Bollinger Band Strategy (Basic) Version 1 This strategy is for learning purposes only. Pay special attention to these strategies on longer aggregation periods (like 1 hr chart or more). Don't expect accurate results when you set a limit to 10 cents above your entry to be accurate. For example if you set the chart to 1 day, the price may move down and hit a stop 10 times then tag your limit. If this doesn't make sense, just don't use strategies here. Learn more first. That being said, I don't have specific recommendations for each aggregation period, backtesting isn't always perfect.
Now then, this strategy can be used as the traditional BB method by setting the "Stop" and "Limit Out" to like 10000, check "Reversal Entry" and uncheck "Limit Time of Day" This will keep the strategy running just reverse your position when price crosses outside each band.
INPUTS:
Length - length of WMA that I used for mean of Bollinger Band (this may suppose to be SMA, too bad)
Source - O-H-L-C basis for WMA
Deviation - normal Standard deviation that would be set when using Bollinger Band
Trailing stop check box - your stop value will be either a hard stop or trailing stop for an exit
Stop - the stop value - remember you can set this really high and it won't stop out
Limit Out - the limit value for exit
Reversal Entry check box - This changes each entry from a reversal (traditional idea of BB) to enter a trend trade - hopefully version 2 will have choice to trend one direction and reversal in the other.
Limit Time of Day - Especially when trading futures, you may want to only trade a specific time of day, when this box is checked, you can set the entry times below, exit will still only occur based on limit/stop or a flip entry order (the opposite entry condition is met)
Tips:
when I don't know a thing about a price range, like gold. I can set the limit out to 10000 and play with a trailing stop to get a better idea of what is even possible before tuning further.

Brandon BollSecond day at Pinescript and I am attempting to tweak the Bollinger Bands directed strategy to send alerts to Zignaly in order to automate long buy/sells.
I've left in the short script though for completeness.
The buy and sell instructions work perfectly but I don't know how to do a cancel order alert (as included in the original strategy)
