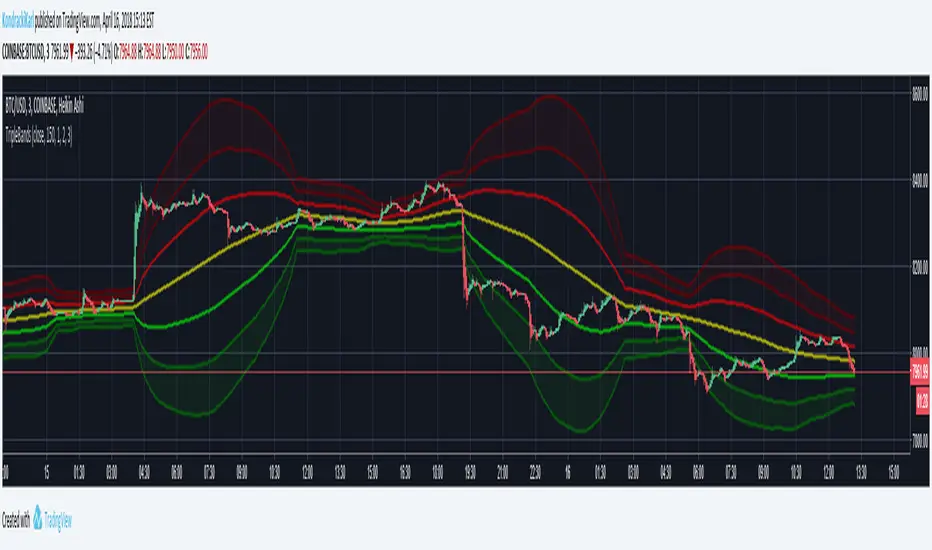
Triple Bollinger BandsTriple Bollinger Bands by Karl Kondracki
Hopefully this script can be of use.
Personally I really enjoy the reliability of Bollinger Bands set to a longer moving average.
Adding two extra deviation settings on the set of bands with the longer ma setting helps to easily show trends.
I tried to make the set as easy to see without drawing attention from other information.
The settings are intended to be as adjustable as possible while keeping things basic.
Cari dalam skrip untuk "bollingerband"
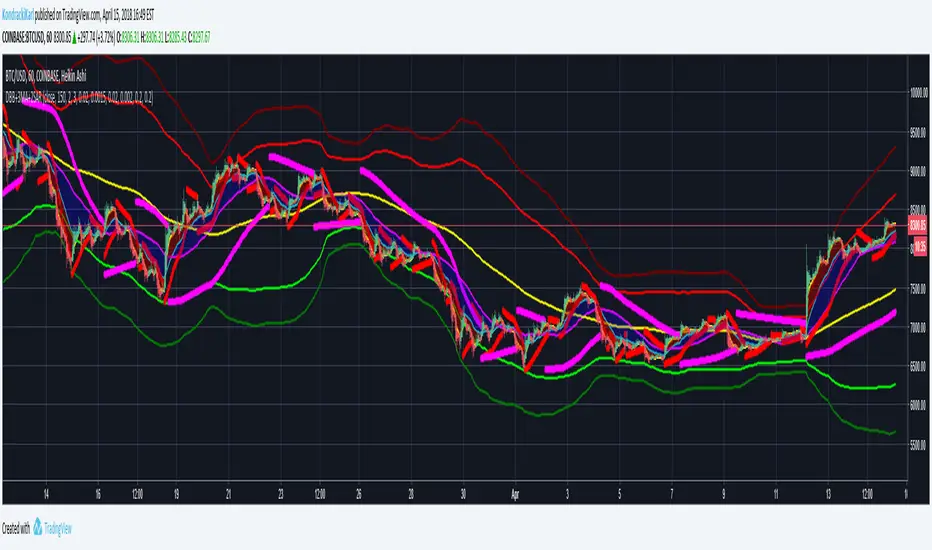
Double Bands, 3MA and 2SARMoving Averages (5,20,50), Double BollHello
Made an indicator set that includes
Moving Averages 5EMA, 20EMA, 50SMA, 200SMA
Fill between 5-20 MA and 20-50MA
Double Bollinger Bands
Parabolic SAR x2
Multiple indicators for the cost of 1
Multiple EMA, VWMA, BB and CCIThis is a combination of Multiple EMA, VWMA, BB and CCI on one script.

Spreads + MA + Bollinger Bands [USDBRL] Crypto
Cryptocurrency adoption is on a constant upward trajectory. The interest for trading 'crypto assets' could not stay anywhere behind. The amateur nature of the market together with huge 'price inefficiencies' is always giving rise to excellent arbitrage opportunities throughout the globe. This code aims to help traders to make money placing safe and profitable trades which will eventually help the community to move towards more efficient price discovery.
The script combines up to three assets to be monitored at the same time. It also allows the trader to plot Simple or Exponential Moving Averages and Bollinger Bands (BB) for each asset he wants to trade.
Instructions:
* International/local -- it allows the trader to switch between international spreads and local (currency) spreads, considering the market he is targeting. The default value is international. Unchecking the field will set the script for local trades.
* Fees -- enables one to add his effective operational cost directly on the chart. This feature might be potentially relevant for traders who engage with fast-moving markets which demands action to be taken right away. The logic for calculations when fees are in place is the following (fee ≠ 0): if (spread > 0), then (spread - fee). If (spread < 0), then (spread + fee). When the spread is too short, the code may plot somewhat weird charts. In this case, it might be interesting to keep fee = 0.
* Standard/ Absolute BB -- it changes from standard Bollinger Bands (default value) to absolute Bollinger Bands . The standard version calculates the bands over the moving average. The absolute version calculates each band in isolation taking absolute values as arguments. Play with the two options (and deviation) to see which is better regarding your market and the instrument of your choice. Uncheck the field to get the absolute version. Feedback on this point is particularly appreciated.
* Expon. Ma -- it switches everything from Simple Moving Averages ( SMA ) to Exponential Moving Averages ( EMA ). Default value: SMA .
I hope you guys manage to make money using the script. And if you do, feel free to show your appreciation. Any amount is welcome! Let's take advantage of what crypto enabled us.
Tips : =>
BTC: 33RUY4AXBEL89gEsoqDpXRgvdZWePhLrqc
LTC: M9mBqVhxWNuZuCPEsrRtH3ygxNYnCdMEki
LTC: 36btZsgNxqiPibag6quTEtdX367wXskUnJ (old format)
ETH: 0x1D3E1701F1A0C379e7Fcb60BADBcd14AcE8160c4
DASH: XnKHHcmhZmR2SAqavP1x6FbEBrqTYa4kTk
If you want to use the script, please, let me know leaving a comment below.
Trade wisely and good luck out there.
Spreads + MA + Bollinger BandsCryptocurrency adoption is on a constant upward trajectory. The interest for trading 'crypto assets' could not stay anywhere behind. The amateur nature of the market together with huge 'price inefficiencies' is always giving rise to excellent arbitrage opportunities throughout the globe. This code aims to help traders to make money placing safe and profitable trades which will eventually help the community to move towards more efficient price discovery.
The script combines up to three assets to be monitored at the same time. It also allows the trader to plot Simple or Exponential Moving Averages and Bollinger Bands (BB) for each asset he wants to trade.
Instructions:
* International/local -- it allows the trader to switch between international spreads and local (currency) spreads, considering the market he is targeting. The default value is international. Unchecking the field will set the script for local trades.
* Fees -- enables one to add his effective operational cost directly on the chart. This feature might be potentially relevant for traders who engage with fast-moving markets which demands action to be taken right away. The logic for calculations when fees are in place is the following (fee ≠ 0): if (spread > 0), then (spread - fee). If (spread < 0), then (spread + fee). When the spread is too short, the code may plot somewhat weird charts. In this case, it might be interesting to keep fee = 0.
* Standard/ Absolute BB -- it changes from standard Bollinger Bands (default value) to absolute Bollinger Bands. The standard version calculates the bands over the moving average. The absolute version calculates each band in isolation taking absolute values as arguments. Play with the two options (and deviation) to see which is better regarding your market and the instrument of your choice. Uncheck the field to get the absolute version. Feedback on this point is particularly appreciated.
* Expon. Ma -- it switches everything from Simple Moving Averages (SMA) to Exponential Moving Averages (EMA). Default value: SMA.
I hope you guys manage to make money using the script. And if you do, feel free to show your appreciation. Any amount is welcome! Let's take advantage of what crypto enabled us.
Tips : =>
BTC: 33RUY4AXBEL89gEsoqDpXRgvdZWePhLrqc
LTC: M9mBqVhxWNuZuCPEsrRtH3ygxNYnCdMEki
LTC: 36btZsgNxqiPibag6quTEtdX367wXskUnJ (old format)
ETH: 0x1D3E1701F1A0C379e7Fcb60BADBcd14AcE8160c4
DASH: XnKHHcmhZmR2SAqavP1x6FbEBrqTYa4kTk
If you want to use the script, please, let me know leaving a comment below.
Trade wisely and good luck out there.
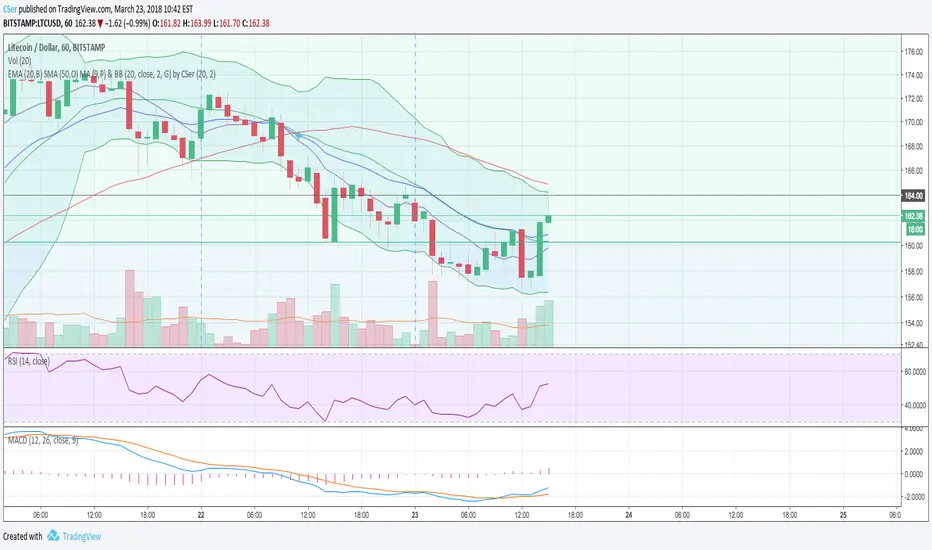
Moving Averages & Bollinger Bands by CSerCombination of Bollinger Bands (20, close, 2) and EMA (20), SMA (50) and the default MA (9) with the addition of crosses for EMA and SMA for quick decisions. Let me know your thoughts, corrections and/or additions.
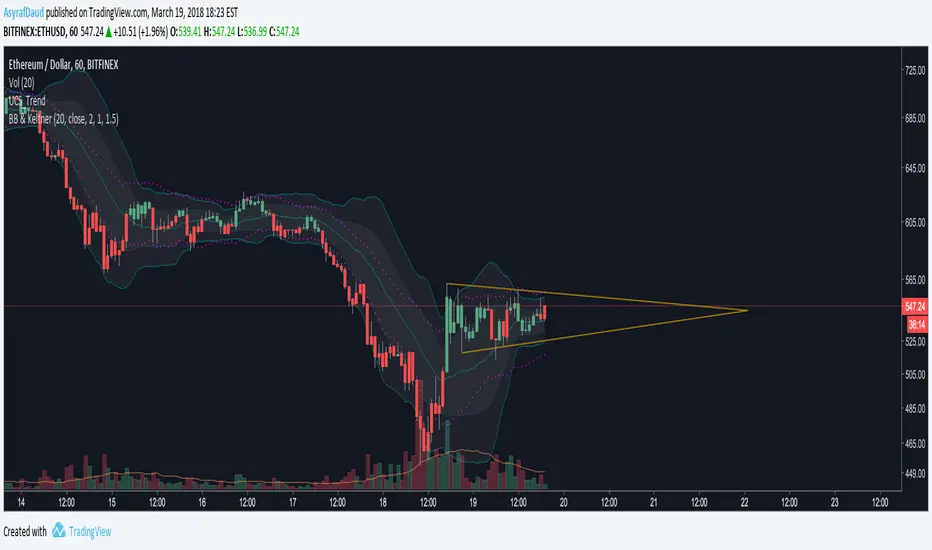
Bollinger Bands and Keltner Channel (BB and KC)Script that combines 2 Bollinger Bands (Std Dev = 1 and Std Dev = 2) with Keltner Channel (Std Dev = 1.5)
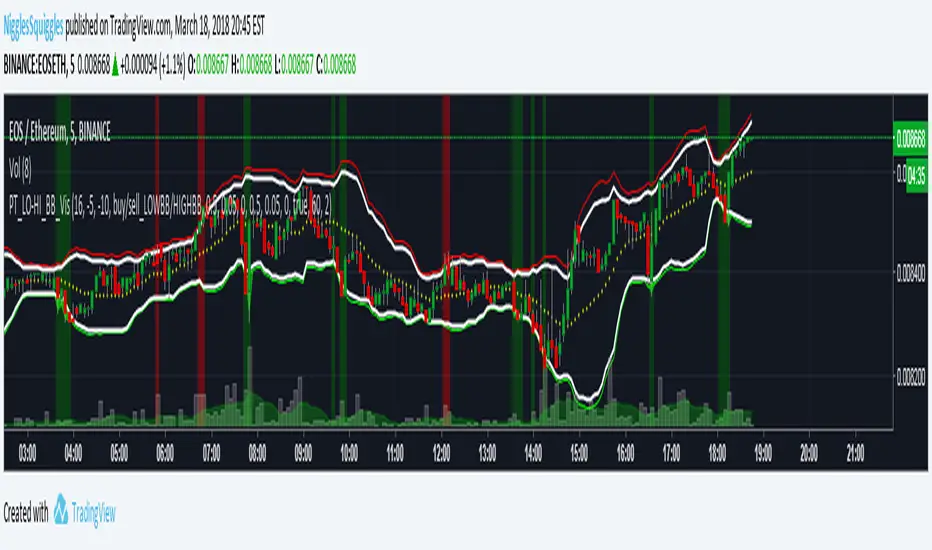
PT_LOW-HIGH BB VisualiserThis Bollinger Band indicator is customised for use with Profit Trailer.
It incorporates the various strategies (High BB, Low BB) and allows you to plot out your buy and sell values to see where your targets relate to price.
It incorporates trailing values, either manual trailing values or automatically calculated values based on volatility.
TEMA/hullMA Ribbon with Bollinger BandsDesigned for shorted time frames.
Bollinger bands based off of TEMA as source.
Ribbon based off TEMA and hullMA divergence.
RMA used to signal Bollinger bands.
Ribbon:
pinch -> reversal
blue -> sign of possible uptrend
red -> sign of possible downtrend
Bollinger bands background:
blue -> sign of continuing uptrend
red -> sign of continuing downtrend

OHLC Daily Resolution BandsShout out to nPE- for the idea.
Bands made with stdev from 10 day OHLC.
Keeps resolution to daily, so you can use bands as daily pivots for day trading.
Upper band 1=yesterday close + 0.5 std(ohlc,10)
Upper band 1=yesterday close + 1 std(ohlc,10)
Mid=yesterday close
Lower band 1=yesterday close - 0.5 std(ohlc,10)
Lower band 2=yesterday close - 1 std(ohlc,1


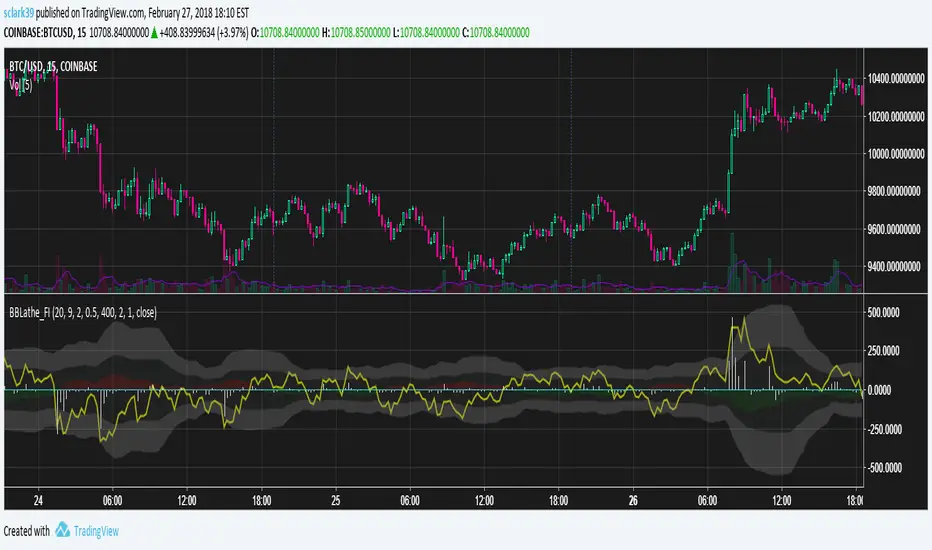
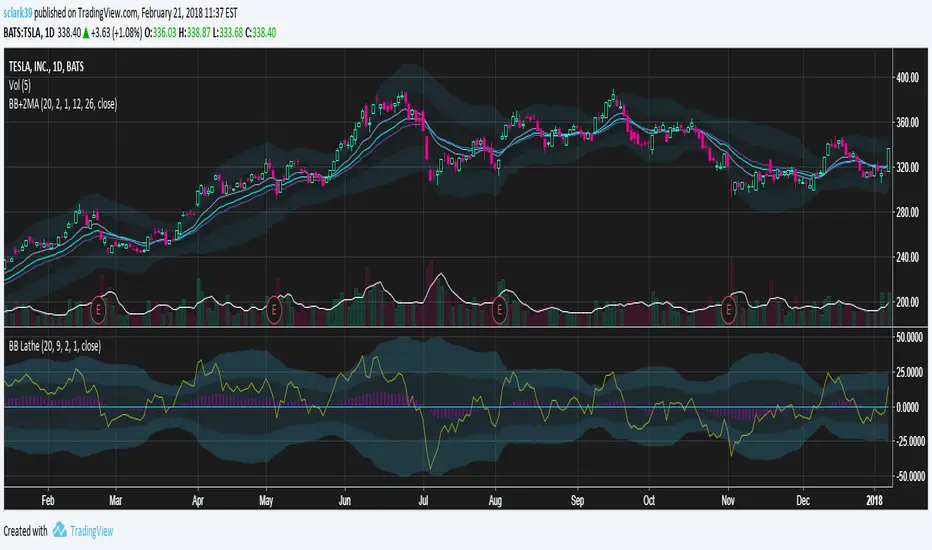
BBLathe2: Bollinger Band Lathe w/ Elder's Force Index [sclark39]Welcome to the second version of the BBLathe!
This shows Bollinger Bands centered on a horizontal basis, to make it easier to see how volatility is changing and identify squeeze opportunities. By default Bollinger bands are calculated using an exponential moving average and an improved higher precision stdev implementation, but this can be disabled. Version 2 also shows Elder's Force Index as a white histogram, so you can see some volume information to help confirm the power of the bears/bulls. The green/red shadow shows how the Bollinger's basis is changing, and when it is going up there will be a green shadow underneath the basis line (this can be inverted in the settings). There is also price line (yellow) showing the location of the price within the Bollinger Bands.
Use this indicator for trades at your own risk, I made this for fun and it is not a trade recommendation.
That being said, if you like my work please tip me!
ETH: 0xf8E0Ea503B5c833fD4546E7fa2c70EcE42A27C8A
Please comment with feedback and requests!
Bollinger/Donchian ChannelsProvides a blending of Bollinger Bands and Donchian Channels with shading criteria between.

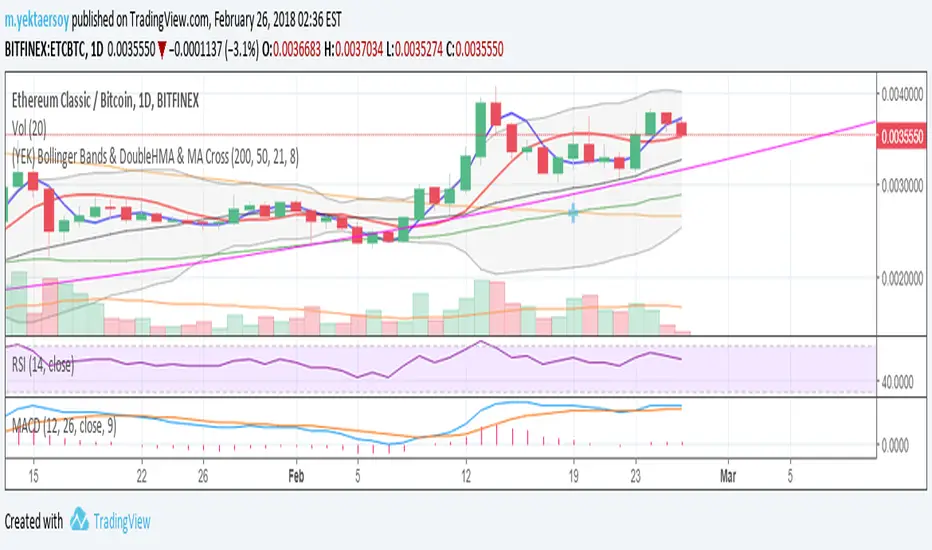
(YEK) Bollinger Bands & DoubleHMA & MA CrossMy favorite indicators ALL-IN-1: Bollinger Bands, Double Hull Moving Average (21,8), Double Moving Average (200,50)
Multi-Bollinger [DW]This is an experimental study designed to visualize trend activity and volatility using a set of two Bollinger Bands calculated with a basis moving average type of your choice.
The available moving averages in this script are:
-Exponential Moving Average
-Simple Moving Average
-Weighted Moving Average
-Volume Weighted Moving Average
-Hull Moving Average
-Least Squares Moving Average
-Arnaud Legoux Moving Average
-Coefficient of Variation Weighted Moving Average
-Fractal Adaptive Moving Average
-Kaufman's Adaptive Moving Average
In addition, a middle filter is calculated by taking the median of the two basis lines.
Multi-Timeframe functionality is included. You can choose any timeframe that Tradingview supports as the basis resolution for the bands.
Custom bar color scheme is included with four options to choose from.

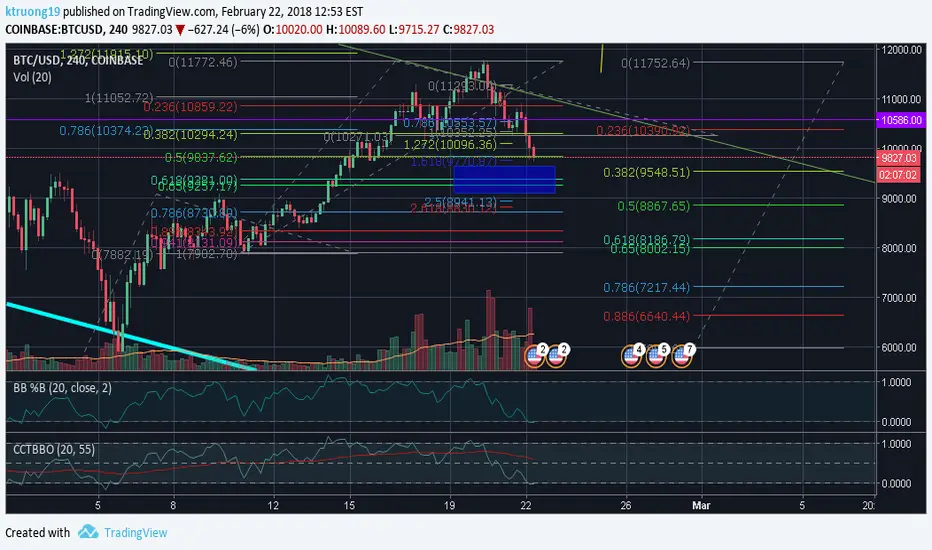
CCT Bollinger Band Oscillator - BB %B UpdateEdit of LazyBear's CCT Bollinger Band Oscillator. Includes changing the scale from 0-100 to 0-1, default length to 20 and line width to 1 to further match BB %B and address some middle line inconsistencies at certain zoom levels
Bollinger Bands + 2 MA (Exponential)Basic Bollinger Bands implementation, with the option to use an exponential moving average and a more accurate stdev function than the builtin. This also includes two extra MA lines which can be tuned as you like, to reduce the number of indicators needed (the bollinger basis is also a moving average, so in total you get 3MA out of this indicator). This draws an inner/outer envelope which can be tuned, by default it is set to 1-2STDEV.
This uses the same same improvement to stdev as my other bollinger indicator:
See more info about the bultin stdev here:
Exponential Bollinger Bands [Updated Feb 2018]The same as my previous Exponential Bollinger Bands script, but now you can set a desired offset for the indicator. I have published this as a new script that way those who prefer the old script can continue to use it without seeing any changes.

Bollinger BarsA partial implementation of Bollinger Bars, as developed by John Bollinger.
This seems to be as close as one can get to true Bollinger Bars with TradingView's current implementation of the Pine language.
It may be possible to complete one day.

Squeeze With Vitamin CThis is a script that is a work in progress while learnign the ins and outs of Pinescript. The script is invite only.

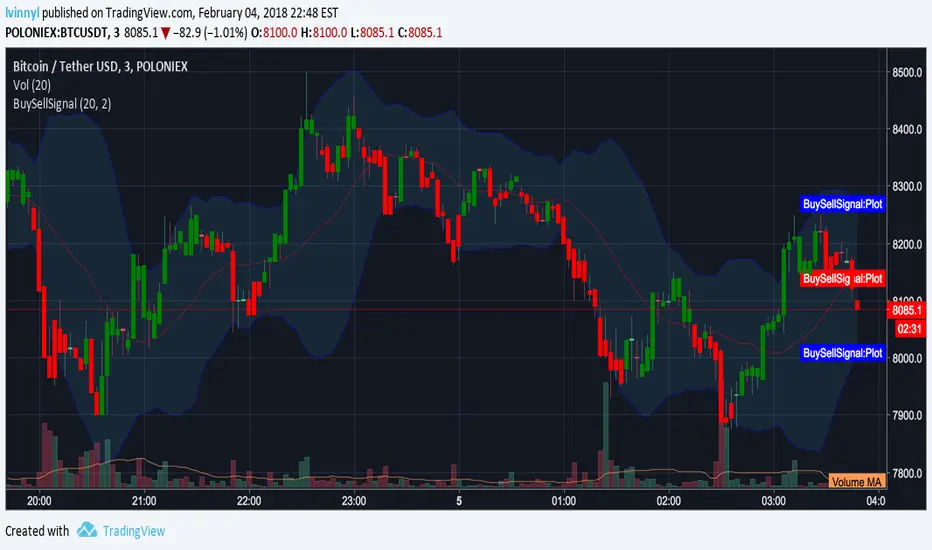
GreenRedSignal with Alerts by lvinnyl// Script created by JoinFree
// Modified by lvinnyl to trigger alerts
// Click on image below for original script...
Bollinger Bands Outside ReversalNot the most accurate indicator, but if combined with some others, it could help you.
BUY Conditions (green):
1. Blue candlestick closes above Bollinger Bands
2. Red candlestick opens outside Bollinger Bands
SELL Conditions (red):
1. Red candlestick closes below Bollinger Bands
2. Blue candlestick opens outside Bollinger Bands
Please always remember, there is no holy grail indicator!

Hull Moving Average + Bollinger BandsThis study make use of Hull Moving Average and Bollinger Bands.
The crosses give signal about HMA and BB crossovers, they are a bit lagging, if you stare well you will spot them a little earlier. It look like a good idea to buy and sell when HMA is near or on the outside of the outer bands.
By default the Bollinger Bands uses Simple Moving Average with 21 periodes, and Hull Moving Average use 9 periodes. You can alter the settings in the format dialog.
Please use as pleased, and if you do something clever with it I'll be happy to know :D
