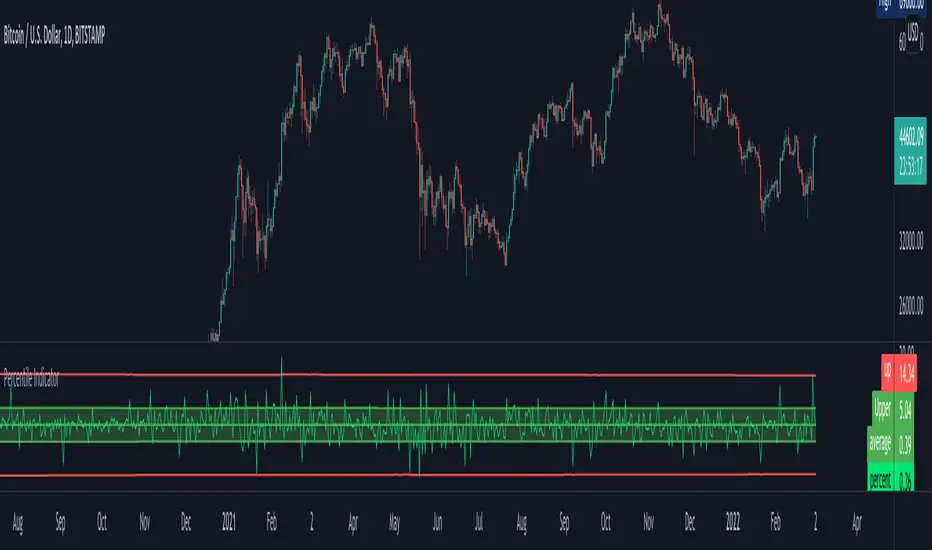
Percentile Major Move Indicator This indicator is a powerful tool for understanding how big of a move a product, crypto, or currency has recently had.
Anything inside of the green bars is a standard move with a 68% chance of happening based on your chart timeframe.
Any move that touches the red lines to the upside or downside has a 2%+ chance of happening in either direction.
This is a powerful indicator but just one point of data and should be used as such.
Cari dalam skrip untuk "bollingerband"
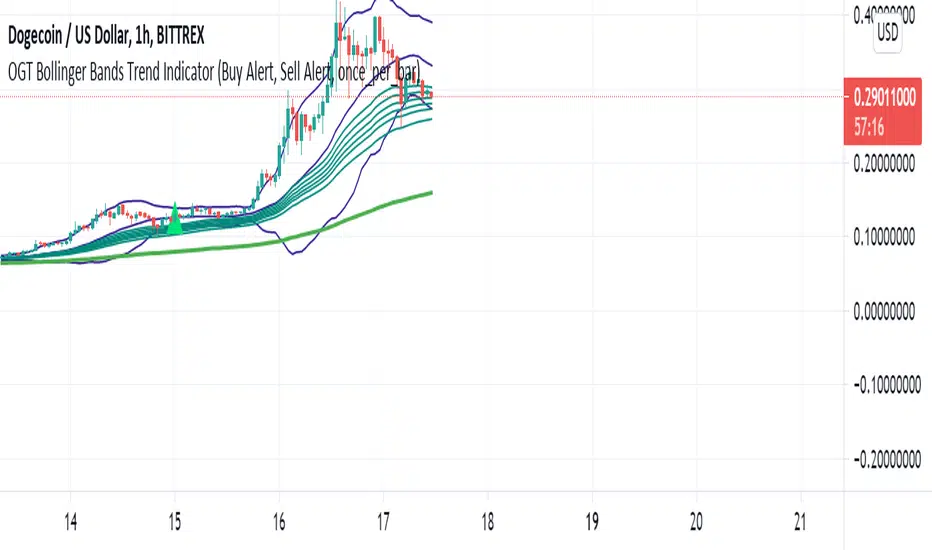
OGT Bollinger Bands Trend IndicatorWhat Is The OGT Bollinger Bands Trend Indicator?
This indicator is a pullback trend trading indicator which uses the following indicators:
- 200 EMA - Long Term Trend Direction
- 30, 35, 40, 45, 50, 60 EMAs - Shorter Term Trend Direction
- Bollinger Bands - Pullback / Entry Signal
How Are Signals Generated?
Buy
- Price above the 200 EMA
- Price touches lower BB with shorter term EMAs all aligned (not crossed)
- Indicator waits for price to close above midpoint BB with shorter term EMAs all still aligned (not crossed)
Sell
- Price below the 200 EMA
- Price touches upper BB with shorter term EMAs all aligned (not crossed)
- Indicator waits for price to close above midpoint BB with shorter term EMAs all still aligned (not crossed)
Alerts function built in, input settings customisable to show/not show indicators and change colours.
Beacon - Anthony Crudele's IndicatorBeacon uses the current volatility of the market based on your trading time frame to determine support and resistance levels, whether a trend is intact or ready to revert back in the range. One of the most difficult things I went through as a trader was determining whether we are in a trend day or if we are in grind up or grind down mode. I created Beacon to give me a simple look at the market to determine what type of environment we are in. I use Bollinger Bands (3 standard deviation) to determine the volatility cycle. Once the BB make peaks I took my Fibonacci Retracement tool and did a retracement from the peak high of the BB to the peak low. I use 70%, 50% and 30% for my support and resistance levels. I use those levels because I tested pretty much every percent level and those percentages averaged the highest performance on all tick charts and time charts. You can use Beacon on whatever time frame or tick chart you are trading on and it will determine that specific volatility cycle.

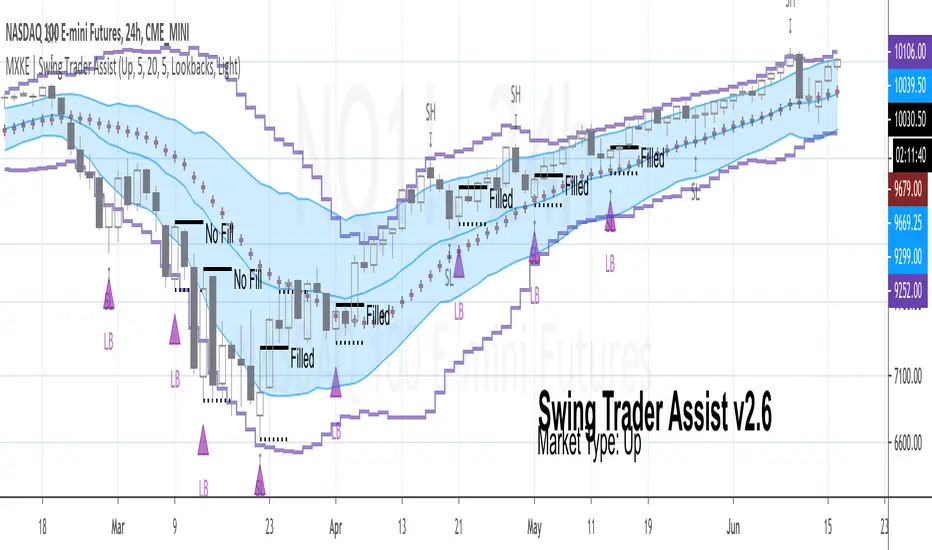
MXKE | Swing Trader AssistIntroduction
Swing Trader Assist indicator is designed to assist in the systematic identification of Hammers & Lookback signals within Uptrending markets, Stars & Lookback signals within Downtrending markets, and Mean Reversion signals within Sideways markets. The trader must first identify a strong market trend, then apply the indicator. Application of the indicator to weak trends will render equally weak signals. Application of the indicator to strong trends will render equally strong signals. Identification of strong trends is the responsibility of the individual trader and is instrumental to the successful deployment of this indicator and accompanying trading plan.
*Please comment below to request access*
*Please share with me on Twitter your usage and/or ideas for improvement so that I may improve this indicator in the future*
Market Types
Uptrend: Higher highs + Higher lows
Downtrend: Lower highs + Lower lows
Sideways: Higher highs + Lower lows (Expanding Range) or Lower highs + Higher lows (Narrowing Range)
Position Sizing
1R = .25%-2% of total nominal capital dependent upon timeframe and risk appetite
Order Types
Entry: Buy Stop 1 tick above High of “Up” Signal Bars; Sell Stop 1 tick below Low of “Down” Signal Bars
Stop: Bar Close <= 1 tick below Low of “Up” Signal Bar; Bar Close >= 1 tick above High of “Down” Signal Bar
Profit Target: 1.5R distance from “Up” or “Down” fill level with the option to trail stop on each new swing high/low; Bollinger Band Midline minimum 1.5R distance from “Sideways” fill level with option to trail stop on continuation to the opposite end of the range (opposite Bollinger Band)
Trading Plan
❑ Market Type is clearly identifiable as Up, Down or Sideways
❑ Swing Trader Assist indicator is set to the corresponding Market Type: Up, Down or Sideways
❑ Position size is no more than .25%-2% of total nominal capital (based on distance from Signal Bar fill level to Signal Bar stop level as 1R)
❑ Distance from Signal Bar fill level to potential Profit Target is minimum 1.5R
❑ On Hammer or Star fill: close position into trend extension at 1.5R+ or adjust trailing stop on each new swing high/low
❑ On Mean Reversion fill: close position at midline or adjust trailing stop on each continuation to opposite end of range
Usage Notes
The indicator will display developing signals intrabar and it is therefore suggested to wait until bar close to act on any signals. “Autodetect” setting under “Market Type” is currently in beta mode. While it is designed to reveal only relevant signals within strong trends based on a series of EMAs, this setting has not been extensively tested. Use with caution.
The indicator is not meant to be a mechanical trading system. It is designed to assist the trader in objectively and systematically identifying signal bars during the execution of the below swing trading plan. It is up to the trader to determine if overall price action warrants acting upon the signal bars or not.
Case Studies


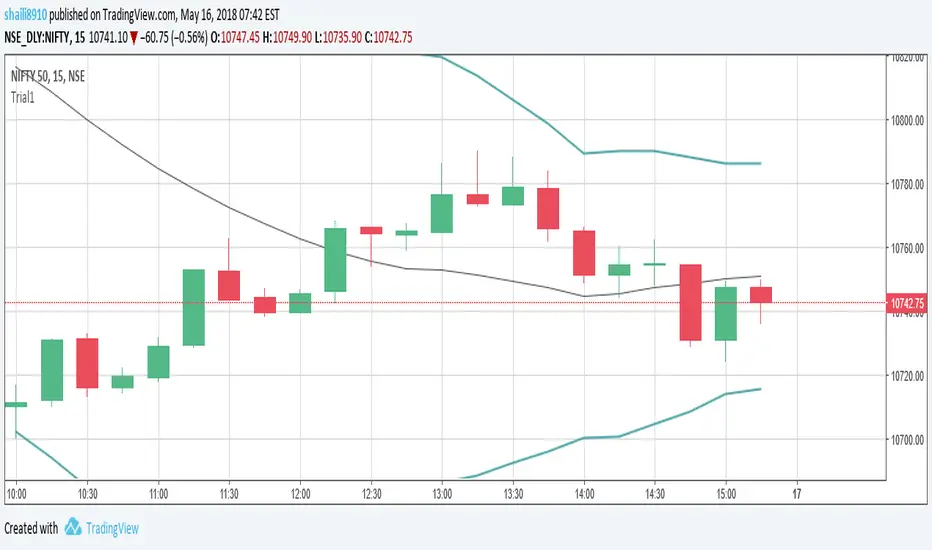
Calendar's Bollinger BandsHI guys, I'm Calendar
I made my 2nd indicator for my followers.
This indicator made by merging 2 Bollinger Bands.(SDV =1, 2)

Bollinger Band Open Gap Alert V1This is the bare bones of what I'm trying to achieve through pine script. The purpose of the script is to:
1. On a 15m chart, calculate and plot upper & lower Bollinger bands and simple moving average of 20 periods. (DONE)
2. On a new day, when the first 15m candle of a session forms, I want to check if a) the low of the new candle is outside the upper Bollinger band (also known as an open gap up) or b) if the high of the candle is the outside the lower Bollinger band (also known as open gap down). In other words, I want to know if the Bollinger Bands are not touching the new candle's wicks/shadows. (DONE)
3. Alert me if the above happens. (DONE)
4. Run the indicator through an entire watch list. I'm not sure if that's possible, yet. (HELP)
For the above job, this is what I could come up with. I need guidance for the last step . And any suggestions for corrections or improvements would be greatly appreciated!
Swing Trading Indicator: RSI + EMA + MACD + BB Signals**Swing Trading Indicator: Multi-Indicator Confluence Signals**
This indicator identifies high-probability swing trading setups using RSI pullbacks, EMA trend filter, MACD momentum confirmation, and Bollinger Bands for volatility-based entries. Perfect for daily/4H charts on stocks like TSLA or SPY.
**Key Features:**
- **Long Signal (Green ↑ Arrow)**: Uptrend (above 200 EMA) + RSI crosses above oversold (default 30) + MACD bullish crossover + Price at/near BB lower band + Optional squeeze filter.
- **Short Signal (Red ↓ Arrow)**: Mirror for downtrends.
- **Real-Time Dashboard**: Top-right table shows condition status (✓/✗) and "LONG/SHORT READY" alerts.
- **Customizable**: Adjust RSI levels, BB multiplier, enable/disable shorts/squeeze/arrows.
- **Alerts**: Built-in for entry notifications.
**How to Use:**
1. Add to chart (daily timeframe recommended).
2. Watch for arrows + "READY" in dashboard.
3. Manual entry: Risk 1% per trade, target 1:2 reward (e.g., trail stops).
**Backtest Note**: Based on similar setups, ~55-65% win rate in trending markets (test yourself). Not financial advice—trading involves risk. Fork and improve!
#swingtrading #RSI #MACD #BollingerBands #PineScript

Multi Timeframe Signal DashboardShows 10 indicators across 6 timeframes (5M, 15M, 30M, 1H, 4H, 1D):
EMA 50/100 crossover
RSI (with oversold/overbought highlighting)
MACD
DMI (DI+/DI-)
Stochastic (with extremes)
CCI
Bollinger Bands
VWAP
EMA 200 Trend
Momentum
Each cell shows ▲ (bullish/green) or ▼ (bearish/red), with scores per row and column, plus an overall BUY/SELL/HOLD signal.

CODEX OB + BBMA V1CODEX OB + BBMA is a multi-purpose Smart Money Concepts (SMC) indicator that automatically detects and visualizes key institutional trading elements such as Order Blocks, Fair Value Gaps, Rejection Blocks, Break of Structure, Pivots, High Volume Bars, and several qualitative SMC signals.
In addition to SMC tools, this indicator also incorporates multi-timeframe BBMA logic, allowing traders to view higher-timeframe momentum, trend direction, and volatility envelopes directly from the current chart. This makes it easier to align SMC setups—like OB, FVG, and BOS—with BBMA structure such as MA touches, re-entry zones, extreme candles, and volatility expansions.
This combination helps traders identify institutional footprints, multi-timeframe confluence, and displacement-based setups with high clarity.

Bollinger Bands Forecast [QuantAlgo]🟢 Overview
Bollinger Bands are widely recognized for mapping volatility boundaries around price action, but they inherently lag behind market movement since they calculate based on completed bars. The Bollinger Bands Forecast addresses this limitation by adding a predictive layer that attempts to project where the upper band, lower band, and basis line might position in the future. The indicator provides three unique analytical models for generating these projections: one examines swing structure and breakout patterns, another integrates volume flow and accumulation metrics, while the third applies statistical trend fitting. Traders can select whichever methodology aligns with their market view or trading style to gain visibility into potential future volatility zones that could inform position planning, risk management, and timing decisions across various asset classes and timeframes.
🟢 How It Works
The core calculation begins with traditional Bollinger Bands: a moving average basis line (configurable as SMA, EMA, SMMA/RMA, WMA, or VWMA) with upper and lower bands positioned at a specified number of standard deviations away. The forecasting extension works by first generating predicted price values for upcoming bars using the selected method. These projected prices then feed into a rolling calculation that simulates how the basis line would update bar by bar, respecting the mathematical properties of the chosen moving average type. As each new forecasted price enters the calculation window, the oldest historical price drops out, mimicking the natural progression of the moving average. The system recalculates standard deviation across this evolving price window and applies the multiplier to determine where upper and lower bands would theoretically sit. This process repeats for each of the forecasted bars, creating a connected chain of potential future band positions that render as dashed lines on the chart.
🟢 Key Features
1. Market Structure Model
This forecasting approach interprets price through the lens of swing analysis and structural patterns. The algorithm identifies pivot highs and lows across a definable lookback window, then tracks whether price is forming higher highs and higher lows (bullish structure) or lower highs and lower lows (bearish structure). The system looks for break of structure (BOS) when price pushes beyond a previous swing point in the trending direction, or change of character (CHoCH) when price starts creating opposing swing patterns.
When projecting future prices, the model considers current distance from recent swing levels and the strength of the established trend (measured by counting higher highs versus lower lows). If bullish structure dominates and price sits near a swing low, the forecast biases upward. Conversely, bearish structure near a swing high produces downward bias. ATR scaling ensures the projection magnitude relates to actual market volatility.
Practical Implications for Traders:
Useful when you trade based on swing points and structural breaks
The Structure Influence slider (0 to 1) lets you dial in how much weight structure analysis carries versus pure trend
Helps visualize where bands could form around key structural levels you're watching
Works better in trending conditions where structure patterns are clearer
Might be less effective in choppy, sideways markets without defined swings
2. Volume-Weighted Model
This method attempts to incorporate volume flow into the price forecast. It combines three volume-based metrics: On-Balance Volume (OBV) to track cumulative buying/selling pressure, the Accumulation/Distribution Line to measure money flow, and volume-weighted price changes to emphasize moves that occur on high volume. The algorithm calculates the slope of these indicators to determine if volume is confirming price direction or diverging from it.
Volume spikes above a configurable threshold are flagged as potentially significant, with the direction of the spike (whether it occurred on an up bar or down bar) influencing the forecast. When OBV, A/D Line, and volume momentum all align in the same direction, the model projects stronger moves. When they conflict or show weak volume support, the forecast becomes more conservative.
Practical Implications for Traders:
Relevant if you use volume analysis to confirm price moves
More meaningful in markets with reliable volume data
The Volume Influence parameter (0 to 1) controls how much volume factors into the projection
Volume Spike Threshold adjusts sensitivity to what constitutes unusual volume
Helps spot scenarios where volume doesn't support a move, suggesting possible consolidation
Might be less effective in low-liquidity instruments or markets where volume reporting is unreliable
3. Linear Regression Model
The simplest of the three methods, linear regression fits a straight line through recent price data using least-squares mathematics and extends that line forward. This creates a clean trend projection without conditional logic or interpretation of market characteristics. The forecast simply asks: if the recent trend continues at its current rate of change, where would price be in 10 or 20 bars?
Practical Implications for traders:
Provides a neutral, mathematical baseline for comparison
Works well when trends are steady and consistent
Can be useful for backtesting since results are deterministic
Requires minimal configuration beyond lookback period
Might not adapt to changing market conditions as dynamically as the other methods
Best suited for trending markets rather than ranging or volatile conditions
🟢 Universal Applications Across All Models
Regardless of which forecasting method you select, the indicator projects future Bollinger Band positions that may help with:
▶ Pre-planning entries and exits: See where potential support (lower band) or resistance (upper band) might develop before price gets there
▶ Volatility context: Observe whether forecasted bands are widening (suggesting potential volatility expansion) or narrowing (possible compression or squeeze setup)
▶ Target setting: Reference projected band levels when determining profit targets or stop placement
▶ Mean reversion scenarios: Visualize potential paths back toward the basis line when price extends to a band extreme
▶ Breakout anticipation: Consider where upper or lower bands might sit if price begins a strong directional move
▶ Strategy development: Build trading rules around forecasted band interactions, such as entering when price is projected to return to the basis or exit when forecasts show band expansion
▶ Method comparison: Switch between the three forecasting models to see if they agree or diverge, potentially using consensus as a confidence filter
It's critical to understand that these forecasts are projections based on recent market behavior. Markets are complex systems influenced by countless factors that cannot be captured in a technical calculation or predicted perfectly. The forecasted bands represent one possible scenario of how volatility might unfold, so actual price action may still diverge from these projections. Past performance and historical patterns provide no assurance of future results. Use these forecasts as one input within a broader trading framework that includes proper risk management, position sizing, and multiple forms of analysis. The value lies not in prediction accuracy but in helping you think probabilistically about potential market states and plan accordingly.

Fekry BB Entry/Exit with EMA FilterThis indicator is based on Bollinger Bands and exponential moving average strategy by Mr Kekry Zain

8EMA+BB-SubiProvides the facility to display 8 EMAs along with Bollinger Bands in the same indicator.

Intraday Volatility Map (Bajrang Bali Indicator)Indicator Name
Bollinger Bands on Historical Volatility (BB-HV) – Intraday Volatility Map
Concept
This indicator applies Bollinger Bands directly on Historical Volatility (HV) instead of price.
HV tells you the “energy” behind the move
Bollinger Bands on HV tell you when volatility is compressing or expanding
Works on all intraday timeframes for indices and stocks
You are not watching price alone — you are watching the strength behind price movement .
---
Core Logic
Historical Volatility is calculated using log returns, annualized
Bollinger Bands are plotted on the HV line (separate pane)
Upper/Lower bands show volatility expansion or contraction
User inputs: HV length, BB length, BB multiplier
---
What This Indicator Shows
Volatility Squeeze (Low HV) – HV stays below lower BB → quiet market, breakout coming
Volatility Expansion (High HV) – HV breaches upper BB → trend day or news-driven move
Normal Regime – HV oscillates between bands → balanced intraday structure
---
How to Use – Indices (NIFTY / BankNifty)
Trend Day Detection – Early HV breakout above upper band suggests strong directional movement
Range Day Identification – HV hugging lower band implies consolidation and mean reversion
Event Risk Mapping – Sudden HV spikes warn of macro data, gaps, policy events
---
How to Use – Stocks
Stock Selection – Choose stocks where HV is rising above mid-band → active, tradable
Entry Confirmation – Breakouts with rising HV have stronger follow-through
Risk Management – High HV → wide stops, low size; Low HV → tight stops, fakeouts possible
---
Signals Generated (For Alerts)
Squeeze Signal – HV < lower band for a set number of bars
Expansion Signal – HV crossing above upper band
Reversion Signal – HV falls back inside bands after a volatility spike
---
Best Timeframes
1m, 3m, 5m, 15m intraday
Works best on indices and liquid stocks
---
Suggested Inputs
HV Length: 20
BB Length: 20
BB Multiplier: 2.0
Squeeze Bars: 5–10
Expansion Filter: HV closing above upper band
---
Who Should Use This Indicator?
Scalpers – Identify high-energy zones
Day Traders – Ride trend days via volatility regime shifts
Option Traders – Read intraday realized volatility patterns
---
Trading Notes
This is a volatility-regime tool, not a buy/sell signal generator
Works best when combined with VWAP, structure, volume, or trend indicators
Always use personal judgment and risk management
---
Disclaimer
This script is for educational and research use only. It does not provide investment advice or guaranteed trading outcomes. Use at your own risk.

BB TrendDisclaimer: This Script works on daily chart for stocks. No SELL signal offered.
How to Use:
If BUY signal is shown on the chart, please take entry in the beginning of next candle.
please comment, if you find this useful.

Multi-Asset Option Strike PricesMulti-Asset Option Strike Prices automatically plots dynamic option strike levels for multiple assets on your chart. The indicator detects the active symbol and draws strike ladders above and below the current price using customizable strike increments (FX, indices, commodities, metals, etc.).
It also rounds price to the nearest strike, giving a precise structural reference used by institutional options desks. These strike levels help traders visualize trend direction, trend boundaries, and potential turning points based on how price interacts with known option clusters.
By mapping evenly spaced strike steps, the indicator also highlights natural stop-loss and take-profit zones within a trend, allowing traders to manage risk around predictable option-driven price levels.
Supports up to 10 assets, includes custom line styling, and provides automatic strike labeling.

BB Breakout + EMA Touch (50/100)Shows points only when BOTH happen on the same candle:
1️⃣ Price breaks through Bollinger Bands
2️⃣ Price touches (or crosses) EMA 50 or EMA 100

Bollinger Bands (MTF) + Bandwidth & %BJBB MTF: Bollinger Bands (MTF) + Bandwidth & %B
This Pine v6 indicator overlays multi‑timeframe Bollinger Bands on the price chart and adds a lower panel with normalized Bandwidth (histogram) and %B (line), plus squeeze/bulge markers and alerts for volatility shifts.
Key idea: See higher‑timeframe BB context on your working chart while tracking volatility regimes and price position within bands.
Features
- Multi‑Timeframe BBs: Up to four TFs (TF1–TF4) via request.security, each with visibility, colors, line widths, and optional background fills.
- Configurable Inputs: Length, MA type (SMA/EMA/SMMA/WMA/VWMA), Source, StdDev multiplier, and Offset.
- Lower Panel Metrics: %B (line) shows price position in the band; Bandwidth (histogram) shows width relative to basis, normalized and color‑coded vs its SMA. Reference lines at 0, 0.5, 1.0; raw highest/lowest bandwidth lines for context.
- Squeeze/Bulge Detection: Alerts when bandwidth equals the rolling lowest (Squeeze) or highest (Bulge).
How It Works
- Per timeframe, BBs use the chosen MA basis and standard deviation × multiplier to form upper/lower bands.
- A selectable TF (TF1–TF4) drives %B/Bandwidth calculations, independent of overlay TFs.
Bandwidth is normalized to the rolling min–max window with safeguards against division by zero.
Use Cases
- Visualize higher‑timeframe context directly on your chart.
- Spot volatility squeezes and expansions with objective markers and alerts.
Combine %B momentum with Bandwidth regime changes to refine entries and exits.

XAUUSD Pro Setup Suite manuel_lnt.fx is an advanced Pine Script v6 indicator designed exclusively for XAUUSD, built to automatically detect the 5 highest-probability setups in gold day trading.
It combines institutional price action, volatility patterns, mean reversion logic, and momentum confirmation to generate clean, filtered, and actionable signals.
The indicator automatically detects:
⸻
1️⃣ Break & Retest Premium (BR)
Identifies valid breaks of key levels and signals the retest with rejection wick, EMA20 trend confirmation, and neutral RSI.
→ Excellent for trend continuation.
⸻
2️⃣ Fakeout Liquidity Trap (FO)
Detects liquidity grabs above highs or below lows with an opposite close + engulfing candle confirmation.
→ The strongest setup for fast and explosive reversals on gold.
⸻
3️⃣ MACD Zero-Line Shift (MACD)
Signals when the MACD crosses the zero line while price breaks micro-structure.
→ Perfect for spotting the start of a new trend.
⸻
4️⃣ Bollinger Squeeze → Breakout (BB)
Recognizes volatility compression and signals when a breakout is likely to explode.
→ Ideal for clean breakout trades.
⸻
5️⃣ Mean Reversion on EMA50 (MR)
Highlights price extensions far away from the EMA50 with ATR confirmation and a reversal candle.
→ Great for pullbacks back toward the mean value.

Squeeze Go Momentum Pro [KingThies] █ OVERVIEW
The Squeeze Momentum Pro indicator identifies volatility compression phases and breakout opportunities by comparing Bollinger Bands to Keltner Channels. When price consolidates (squeeze), the bands contract inside the channels, signaling an imminent breakout. The momentum histogram shows directional bias, helping traders anticipate which way price will move when the squeeze releases.
This indicator displays in a separate panel below the price chart, providing clear visual signals without cluttering price action.
█ KEY FEATURES
Momentum Histogram
The histogram is the primary visual element, displaying momentum strength and direction with four distinct color states:
• Dark Green (#00C853) — Strong bullish momentum that is increasing. This signals strengthening upward pressure and potential continuation.
• Light Green (#26A69A) — Bullish momentum that is decreasing. Price remains in bullish territory but upward force is weakening.
• Dark Red (#D32F2F) — Strong bearish momentum that is increasing. This signals strengthening downward pressure and potential continuation.
• Light Red (#EF5350) — Bearish momentum that is decreasing. Price remains in bearish territory but downward force is weakening.
The color intensity provides immediate feedback on momentum strength and trend health.
Squeeze State Indicator
Colored dots on the zero line communicate the current volatility state:
• Orange Dots — Squeeze is ON. Bollinger Bands have contracted inside Keltner Channels, indicating consolidation and low volatility.
A breakout is building and traders should prepare for directional movement.
• Green Dots — Squeeze is OFF. Bollinger Bands have expanded outside Keltner Channels, indicating active momentum and higher volatility.
Price is moving with conviction in the current direction.
• Gray Dots — Neutral state. The bands are transitioning between squeeze states.
Release Triangles
Triangle shapes mark the exact bar when a squeeze releases, providing precise entry timing:
• Green Triangle Up — Bullish squeeze release. The squeeze has ended with positive momentum, suggesting a long setup opportunity.
• Red Triangle Down — Bearish squeeze release. The squeeze has ended with negative momentum, suggesting a short setup opportunity.
Information Panel
A compact dashboard in the top-right corner displays real-time trading intelligence:
• Squeeze Status — Current state: ON, OFF, or NEUTRAL with color coding
• Momentum Direction — Current bias: BULL or BEAR
• Momentum Value — Precise numerical reading of momentum strength
• Trading Signal — Actionable status: LONG SETUP, SHORT SETUP, WAIT, or MONITOR
Configurable Parameters
All calculation inputs are adjustable to match your trading style and timeframe:
• BB Length — Bollinger Bands period (default: 20)
• BB StdDev — Bollinger Bands standard deviation multiplier (default: 2.0)
• KC Length — Keltner Channels period (default: 20)
• KC ATR Multiplier — Keltner Channels range multiplier (default: 1.5)
• Momentum Length — Linear regression period for momentum calculation (default: 20)
Alert System
Four alert conditions notify you of critical trading opportunities:
• Bullish Squeeze Release — Squeeze has released with bullish momentum, indicating a potential long entry
• Bearish Squeeze Release — Squeeze has released with bearish momentum, indicating a potential short entry
• Squeeze Started — Volatility compression detected, prepare for upcoming breakout
• Squeeze Ended — Volatility expansion confirmed, breakout is active
█ TRADING METHODOLOGY
The indicator follows a clear four-step process for identifying and trading squeeze breakouts:
1 - Wait for Orange Dots . When orange dots appear on the zero line, a squeeze is building. This indicates price consolidation and declining volatility.
Do not enter trades during this phase. Instead, prepare by identifying key support and resistance levels and potential breakout directions.
2 - Watch for Release Triangle . When a triangle appears, the squeeze has released and a breakout is beginning. This is your entry signal.
The triangle color (green up or red down) combined with the histogram direction indicates the breakout direction.
3 - Confirm with Histogram Direction . Check the momentum histogram for directional confirmation:
• Green histogram + green triangle up = Go long. Bullish momentum supports upward breakout.
• Red histogram + red triangle down = Go short. Bearish momentum supports downward breakout.
4 - Monitor Momentum Intensity . Stay in the trade while histogram bars maintain their dark, intense color.
When colors lighten (dark green to light green, or dark red to light red), momentum is weakening and you should consider taking profits or tightening stops.
█ INTERPRETATION GUIDE
Squeeze Detection Logic
A squeeze occurs when Bollinger Bands contract inside Keltner Channels. This happens when:
• Standard deviation of price decreases (BB narrows)
• Price consolidates within a tight range
• Volatility compresses to unsustainable levels
The orange dots signal this condition, warning traders that explosive movement is imminent.
Squeeze Release Logic
A squeeze releases when Bollinger Bands expand outside Keltner Channels. This happens when:
• Price volatility increases sharply
• Price breaks out of consolidation
• Volume typically expands (check volume separately)
The green dots and release triangles signal this condition, indicating the direction and timing of the breakout.
Momentum Reading
The histogram uses linear regression to calculate momentum relative to the midpoint of the recent range:
• Above Zero : Price is trading above the range midpoint with bullish pressure
• Below Zero : Price is trading below the range midpoint with bearish pressure
• Increasing Bars : Momentum is strengthening in the current direction (darker color)
• Decreasing Bars : Momentum is weakening in the current direction (lighter color)
█ BEST PRACTICES
• Timeframe Selection — The indicator works on all timeframes but performs best on 15-minute to daily charts.
Lower timeframes may produce more false signals due to noise.
• Confluence Trading — Combine squeeze releases with support/resistance levels, trend lines, or other indicators for higher probability setups.
• Volume Confirmation — Check that squeeze releases occur with increasing volume. Low volume breakouts are more likely to fail.
• Multiple Timeframe Analysis — Check higher timeframes for overall trend direction. Trade squeeze releases that align with the larger trend.
• Parameter Adjustment — Increase BB and KC lengths for smoother signals on higher timeframes. Decrease for more sensitive signals on lower timeframes.
█ LIMITATIONS
• The indicator does not predict breakout direction before the squeeze releases. The momentum histogram provides bias but is not definitive until the breakout occurs.
• False breakouts can occur, particularly in choppy or low-volume market conditions. Always use proper risk management and stop losses.
• The indicator works best in trending markets. In deeply ranging markets with no clear direction, squeeze signals may be less reliable.
• Momentum calculations use linear regression which can lag during extremely fast price movements. Confirm signals with price action.
█ NOTES
This implementation uses linear regression for momentum calculation rather than simple moving averages, providing more responsive and accurate directional signals. The four-color histogram system gives traders nuanced feedback on momentum strength that binary color schemes cannot provide.
The indicator automatically adjusts to any symbol and timeframe without modification, making it suitable for stocks, forex, crypto, and futures markets.
█ CREDITS
Squeeze methodology inspired by John Carter's TTM Squeeze indicator. Momentum calculation and visual design optimized for modern trading workflows.

Ultimate RSI Suite [BigBeluga]🔵 OVERVIEW
The Ultimate RSI Suite elevates the classic RSI into a full professional trading system.
It combines momentum analysis, advanced divergence detection, volatility-based RSI channels, multi-timeframe signals, deviation tracking, and reversal alerts into one powerful tool.
This is no ordinary RSI — it’s a complete momentum intelligence engine designed to identify trend strength, exhaustion, breakout conditions, and reliable reversal points with high precision.
⚠️ Note:
This suite enhances RSI with MTF dashboards, dynamic channels, deviation logic, and smart alerting — ideal for scalpers, swing traders, and institutional-style trend followers.
🔵 CONCEPTS
Measures market momentum to detect overbought/oversold zones and trend health
Tracks RSI behavior relative to dynamic channels (BB/Keltner/Donchian)
Identifies regular bullish & bearish divergences
Detects deviation moves after divergence to confirm trend continuation or exhaustion
Multi-timeframe RSI conditions reveal higher-timeframe confluence
Reversal triggers confirm early momentum shifts
Overbought/oversold gradients visually highlight exhaustion zones
🔵 FEATURES
Classic + Enhanced RSI with configurable lookback & price source
RSI-Channel System (Bollinger, Keltner, Donchian) for volatility-adaptive trend structure
RSI-Smoothing MA for trend direction filters
RSI Reversal Signals for early trend inflection detection
RSI Reversal Signals Deviation Levels +1 / +2 for advanced continuation confirmation
Overbought/Oversold Gradient Zones at 35/65 or user-defined levels
Divergence Engine for bullish & bearish momentum exhaustion signals
On-Chart Divergence & Signals (full overlay capability)
Divergence Engine Deviation Levels +1 / +2 for advanced continuation confirmation
Multi-Timeframe Dashboard (RSI OB/OS, signals, divergences, channel breaks)
• Hover your mouse over any signal cell to see how many bars ago it was triggered
• Signals automatically expire after 50 bars
Smart Alerts for divergence, reversals, channel breaks, and deviation triggers
🔵 HOW TO USE
Enter long when RSI reverses from oversold & prints bullish divergence or a ▲ signal
Enter short when RSI reverses from overbought & prints bearish divergence or ▼
Use channel breaks to confirm momentum expansions or trend shifts
Look for deviation crosses (+1 / +2) for strong confirmation after divergence
Track MTF table — more timeframe agreement = stronger conviction
Avoid trading against MTF RSI extremes (OB/OS stacked zones)
Combine with market structure or volume-based tools for maximum precision
🔵 ALERTS
Includes full automation suite:
Bullish / Bearish divergence
Reversal signals (▲ / ▼)
Channel breakouts (Up/Down)
Deviation +1 / +2 confirmation triggers
Extra RSI signal deviation alerts for precision continuation reads
Great for automated systems, confirmation models, and high-probability intraday/swing entries.
🔵 CONCLUSION
The Ultimate RSI Suite transforms RSI into a smart momentum-analysis system.
With multi-timeframe logic, dynamic channels, advanced divergence/deviation systems, and powerful visual cues, it offers institutional-grade trend, exhaustion, and reversal detection.
If you rely on RSI, this toolkit provides superior clarity, deeper context, and stronger execution timing — making it an elite upgrade for professional traders.
Skrip berbayar

Liquidity & Momentum Master (LMM)💎 Liquidity & Momentum Master (LMM)
A professional dual-system indicator that combines:
📦 High-Volume Support/Resistance Zones and
📊 RSI + Bollinger Band Combo Signals — to visualize both smart money footprints and momentum reversals in one clean tool.
🧱 1. High-Volume Liquidity Zones (Support/Resistance Boxes)
Conditions
Visible only on 1H and higher timeframes (1H, 4H, 1D, etc.)
Detects candles with abnormally high volume and strong ATR-based range
Separates bullish (support) and bearish (resistance) zones
Visualization
All boxes are white, with adjustable transparency (alphaW, alphaBorder)
Each box extends to the right automatically
Only the most important (Top-N) zones are kept — weaker ones are removed automatically
Interpretation
White boxes = price areas with heavy liquidity and volume concentration
Price approaching these zones often leads to bounces or rejections
Narrow spacing = consolidation, wide spacing = potential large move
💎 2. RSI Exit + BB-RSI Combo Signals
RSI Exit (Overbought/Oversold Recovery)
RSI drops from overbought (>70) → plots red “RSI” above the candle
RSI rises from oversold (<30) → plots green “RSI” below the candle
Works on 15m, 30m, 1H, 4H, 1D
→ Indicates short-term exhaustion recovery
BB-RSI Combo (Momentum Reversal Confirmation)
Active on 1H and higher only
Requires both:
✅ RSI divergence (bullish or bearish)
✅ Bollinger Band re-entry (after temporary breakout)
Combo Buy (Green Diamond)
Bullish RSI divergence
Candle closes back above lower Bollinger Band
Combo Sell (Red Diamond)
Bearish RSI divergence
Candle closes back below upper Bollinger Band
→ Confirms stronger reversal momentum compared to standard RSI signals
