Cari dalam skrip untuk "bollingerband"
Bollinger band (band display 5σ)Set the color for each bands and indicate the Bollinger bands.
In order to indicate with simple moving average line,hide the bollonger bands line and set the color for bands.
ボリンジャーバンドの帯域ごとに色を設定して表示します。
単純移動平均線と同時表示しても見やすいように、ボリンジャーバンドの線を非表示にして、帯域に色を設定して表示することができます。

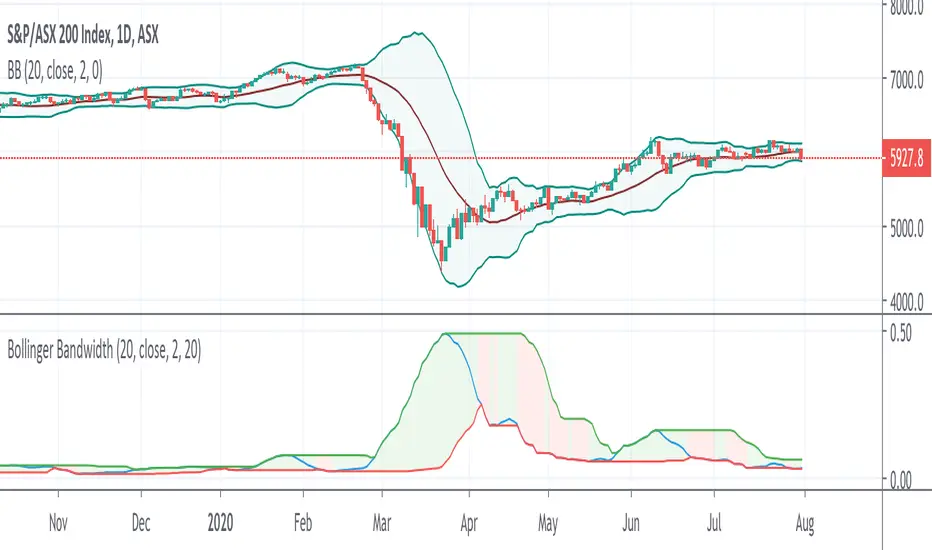
Bollinger Bandwidth - Bulge and squeezeThis is Bollinger bandwidth indicator:
Bandwidth = high-low/main
I have added lowest and highest of N periods to programmatically identify bulge and squeeze. When bandwidth at N periods low, it is in squeeze. If bandwidth at N periods high, it is in bulge.
Bollinger band 1+2Bollinger band with 1 and 2 standard deviation
Default with 21 SMA
Also count number of candlesticks of previous trend when crossing 1 standard deviation

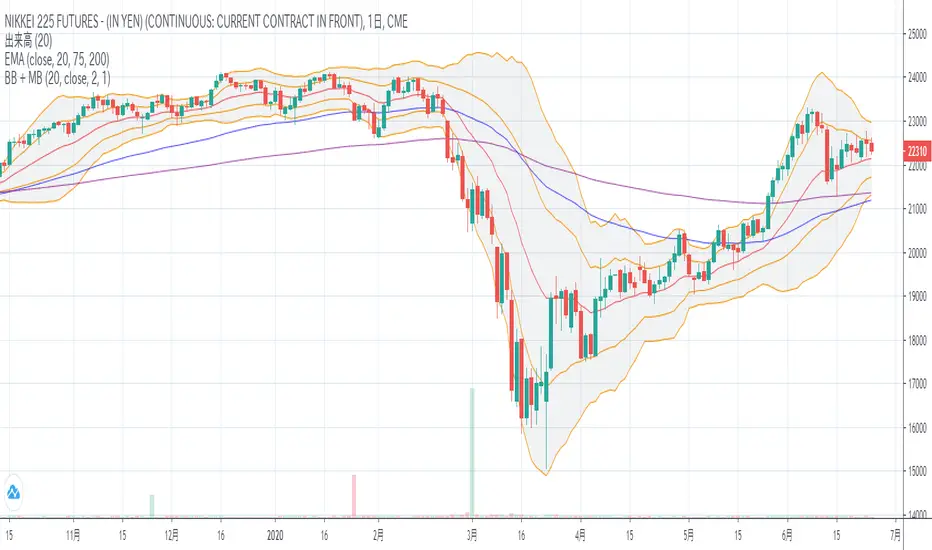
Bolinger Band + Mid Band using EMAEMA become more popular than SMA.
EMA reacts faster than SMA.
Mid Band helps you to find out trend.
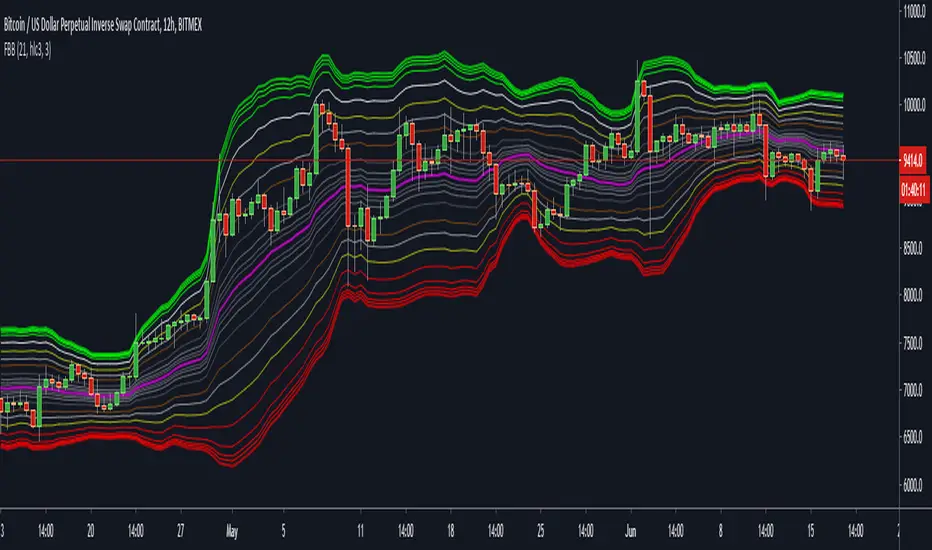
Better Bollinger Bands (now open source)General purpose Bollinger band indicator with a number of configuration options and some additional color-coded information. The main advantages of it over standard Bollinger bands are:
1) Better statistics:
* Uses volume weighted moving averages, variance, and standard deviation by default. The volume dependence can be disabled with a checkbox option, but generally makes it more responsive improves its ability to distinguish true outlier events from random variation.
* Lets you pick between different time windows (simple, sawtooth (WMA), exponential) in addition to the volume weighting, with appropriate Bessel corrections to make the estimators unbiased and to get consistent result for different weights.
* Has a checkbox option to use a linear regression in the band calculation if you don't want average momentum to be counted in the volatility. This turns the centerline into a last squares moving average, and the band width at each time step is given by the variance away from the regression line instead of from a moving average. Weights in the least squares regression are changed according to the other options. For tickers with a strong long-term trend this makes the bands track the price action more closely.
2) Geometric
* This does all calculations on log(price) instead of the prices themselves.
* Makes almost no difference in most cases, but gives better results on charts with strongly exponential behaviour that range between several orders of magnitude.
* Properly centered around price action on log plots.
* Will never annoy you by rescaling a log plot due to a negative lower band. The lower band is always positive for positive prices.
3) Some built in oscillators.
* This aims to reduce clutter by building in some other indicators into the band color scheme. You can pick between various momentum & RSI operators to color the center line and the bands, or leave the bands plain.
I've been using these bands myself for a few months & have been gradually adding functionality & polish. Feel free to comment, or to refer to me if you borrow any ideas.

CBMA Bollinger Bands Strategy directed [ChuckBanger]I just did a Bollinger Bands script with my newly CB moving average
While I'm generally against posting strategies because it's very easy to fake performance numbers... This is just to share a cool strategy snippet. My settings are 10 contracts/order with pyramiding set to 10. You can make the profitability a lot higher if you set the order size higher. But that dosent help you getting more out of this script when u make a bot of this script. I set the order size to 10 contracts to get your attention not to showcase the performance.
When the price is going down and outside of the lower side of the band. And when the price comes back into the channel the strategy buys. Usually that means the price is going up. And when the price is going up and outside of the upper band. The strategy sells when it crosses back in to the channel.
It is a very simple strategy but it is effective. I guess you need a proper stop-loss for this script to bee really profitable in a bot environment.

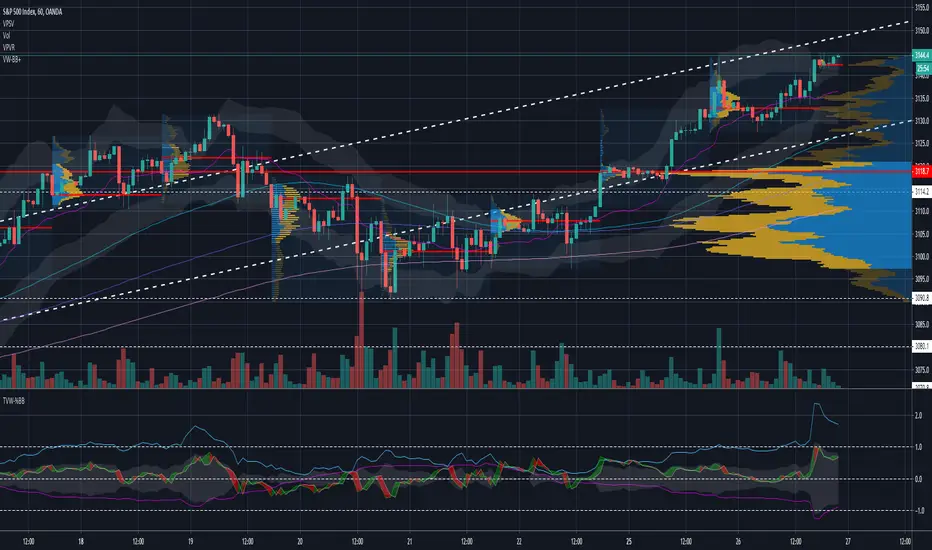
VW %BB +Volume weighted %BB Based on Closing price (green line)
%BB of 50 period ema of the 20 period volume weighted moving average at each point (blue)
difference of %BB green - %bb Blue shading around mid-band (ie width between two in band terms)
added an additional line which is the sum of the absolute distance from mid-band of the ema + top half of bandwidth difference
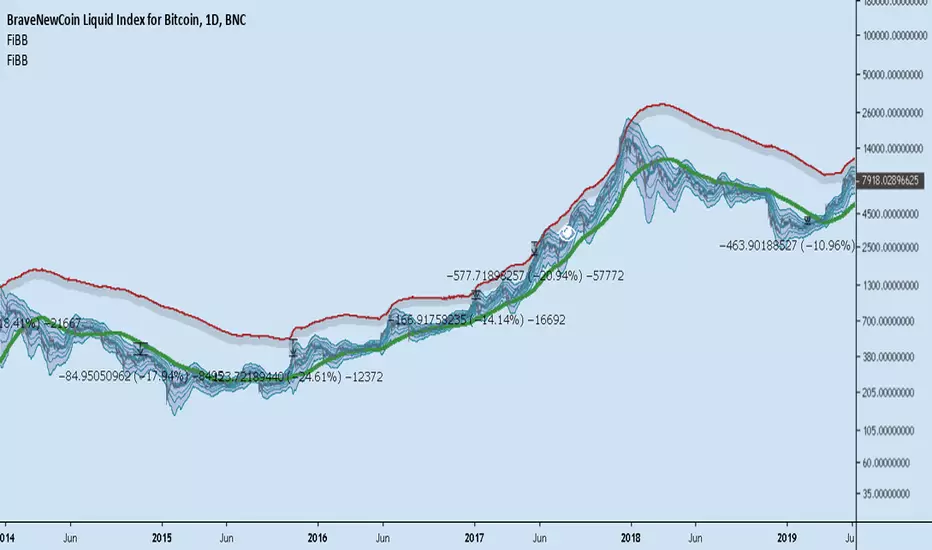
Geometric Bollinger BandsAnalogous to Bollinger bands but performs all computations on the logarithms of the values.
Unlike the regular bollinger bands (or most other variations of them available on tradingview), these won't annoy you by rescaling the chart when you try to look at the Bitcoin weekly chart or any other chart with strongly exponential behaviour, and the moving average is perfectly centered between the two bands on your log chart. The lower band is guarenteed to be positive for positive inputs.


HLC Bollinger BandsThis is just a Bollinger band indicator that uses the highs & lows in addition to the close in the calculation of volatility / deviations from average. These bands will be slightly wider than regular Bollingers as a result.
I've found it useful with very short lookback lengths (3 to 5) for identifying periods when the bands are contracted... usually leads to an expansion of volatilty, so good for scalps.
Enjoy.


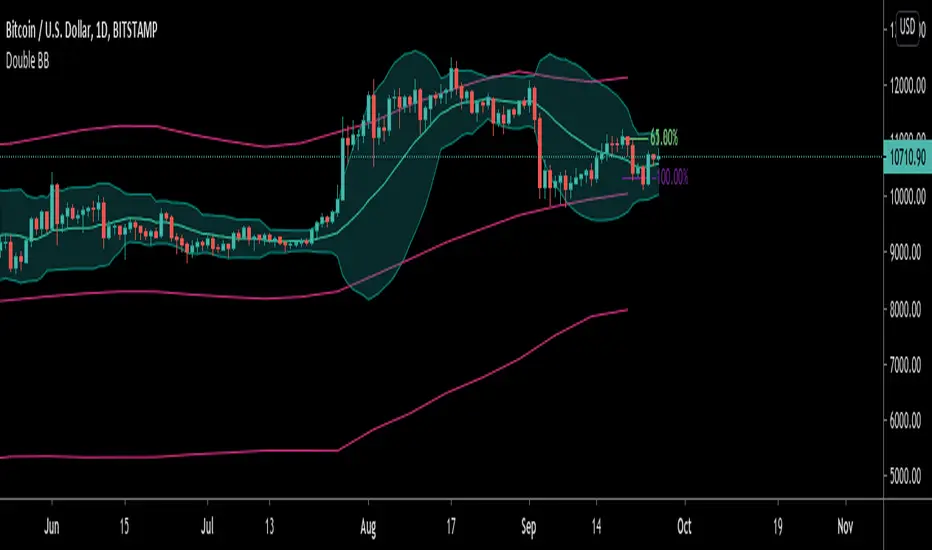
Double Bollinger BandsOn fundamentally strong stocks for entry points. The area in the Gray lines is the best one to enter and reasonable valuation. The area in the Red lines indicates higher Valuation. The area in the Green lines indicates lower Valuation and better to be careful and avoid.

Bollinger Bands Changing ColorOriginal Bollinger Bands but the basis line changes color when the slope is positive or negative
If slope is positive the color is green (or lime)
If slope is negative the color is red
If slope is flat the color is black
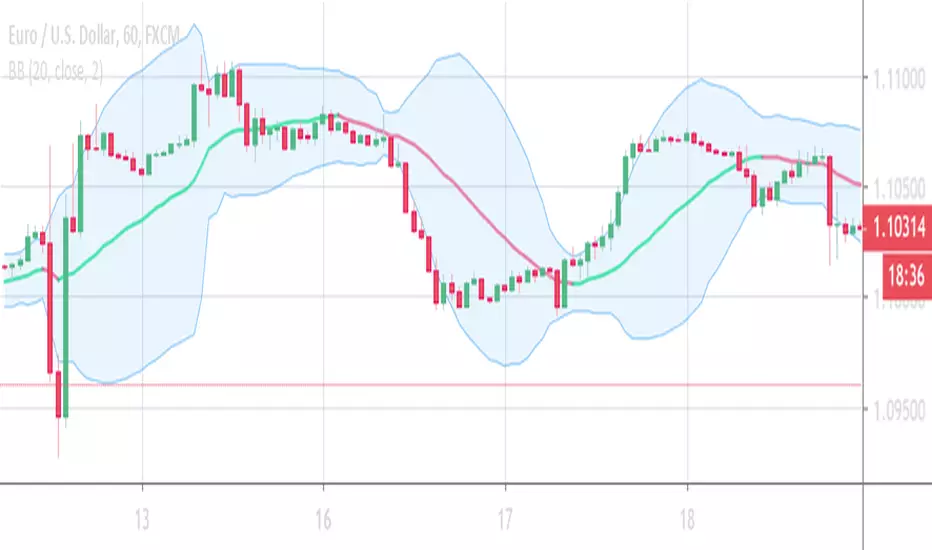
EMA Bollinger BandsThis is a simple Bollinger Bands indicator that uses the exponential moving average instead of the simple moving average.


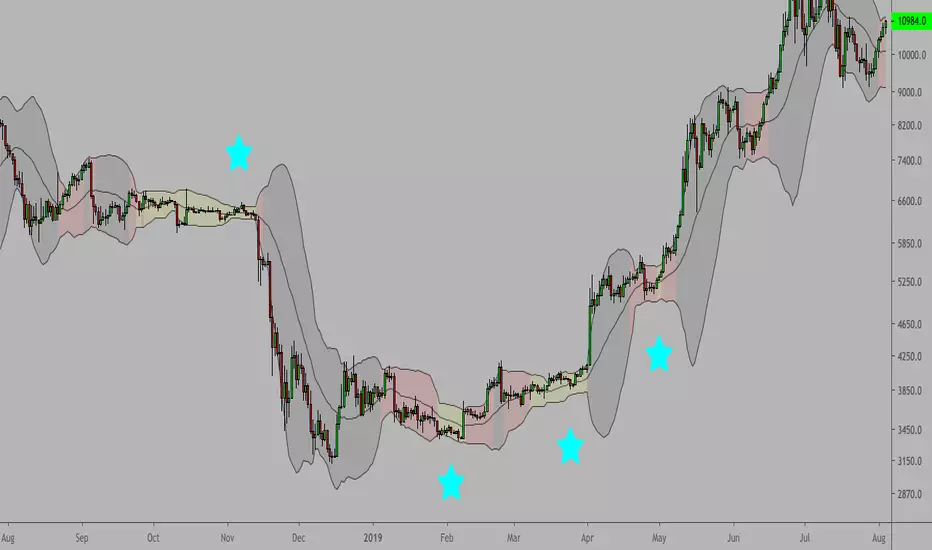
BolingerBands_Contraction_Bitcoin_dailyThe script visualises the contraction or tightness of the Bollinger Bands (example Bitcoin on the daily timeframe). The contraction values have to be adjusted for each asset/coin/stock and timeframe. See what works for you.
Bollinger Bands, multi toolBollinger bands multi tool.
The user is allowed to turn on/off four sets of bollinger bands.
The calculation uses simple moving average as default.
However have other options:
Basis options:
options : "SMA", "EMA", "WMA", "VWMA", "SMMA", "DEMA", "TEMA", "HullMA", "LSMA", "VWAP"
Basis can be turned on/off.
The tool allows the user to adjust standard deviation and period.
Two bands with same timeframe as used on chart.
Two bands with option to choose different timeframe.
Very powerfull tool to identify important pivots in volatility analysis.
But can also be used to identify

BB Over Bought / Sold MTF// Enter a long position or exit a short position when all bands concentrate below 0.15 in lime color.
// Exit a long position or enter a short position when all bands concentrate above 0.9 in fuchsia color.

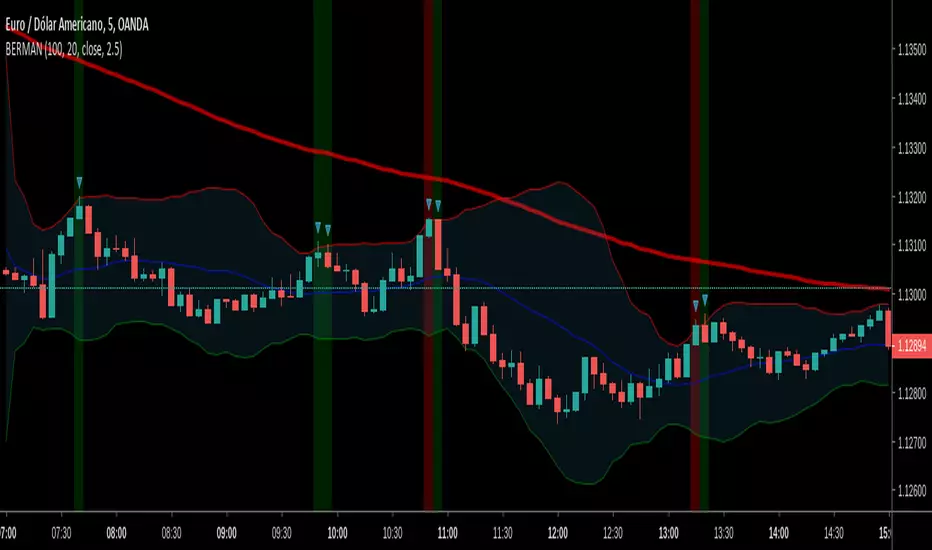
berman idicatorScript do indicaor Berman
Entradas Sempre para a expiraçao da vela de M5 quando O indicador mostra Um X No candle
Multi-TimeFrame Bollinger BandsMulti-timeframe bollinger band
This script generates higher timeframe bollinger band in a lower timeframe chart, which can be used to find better reference of entry and exit.
