Hedge Coin M - Statistical Support and ResistanceHedge Coin M - Statistical Support and Resistance
Introduction
"Hedge Coin M - Statistical Support and Resistance" is a sophisticated, statistically-driven indicator designed specifically for traders in the COIN-M market on Binance. It offers a nuanced approach to identifying key market levels, focusing on the dynamics of support and resistance through advanced volatility analysis.
Foundation and Credits:
This script is an advanced adaptation of TradingView's standard code for the Bollinger Bands indicator. It extends the foundational concept of Bollinger Bands by integrating additional volatility metrics.
Calculation Method
This indicator employs Volume Weighted Moving Averages (VWMA) to create two distinct sets of Bollinger Bands, named BB-a and BB-b.
BB-a is derived from the VWMA of high prices, targeting potential resistance levels.
BB-b is based on the VWMA of low prices, aimed at identifying critical support levels.
Users can independently adjust the standard deviation (SD) multipliers for the upper and lower bands of both BB-a and BB-b, accommodating different market conditions.
Enhanced Volatility Analysis
The indicator calculates additional standard deviation lines for the upper band of BB-a and the lower band of BB-b. These lines provide deeper insights into market volatility.
Plotted Graphs
The primary plots include the upper and lower bands of BB-a and BB-b, marked in distinct colors for clarity.
Additional SD lines are plotted to indicate potential extended levels of support and resistance, offering traders a broader view of possible market movements.
Purpose and Usage
"Hedge Coin M - Statistical Support and Resistance" is designed to provide traders with a consistent, statistical method for identifying significant price levels.
It aids in scaling entry into positions, helping traders to navigate the COIN-M market with more informed decision-making.
This tool is especially useful for traders who combine long-term holding with swing trading strategies, offering a balanced approach to market engagement.
Integration and Adaptation
Easily integrate this indicator into your TradingView chart for the COIN-M market.
Use the insights provided to complement your overall trading strategy, particularly in identifying and reacting to significant market movements.
Disclaimer
Important Note: This indicator is provided for informational purposes only. It does not constitute financial advice, investment advice, trading advice, or any other sort of advice. Trading decisions should be made based on your own analysis, prudence, and judgment. Please be aware of the risks involved in trading and consult a financial advisor if necessary.
Cari dalam skrip untuk "bollingerband"

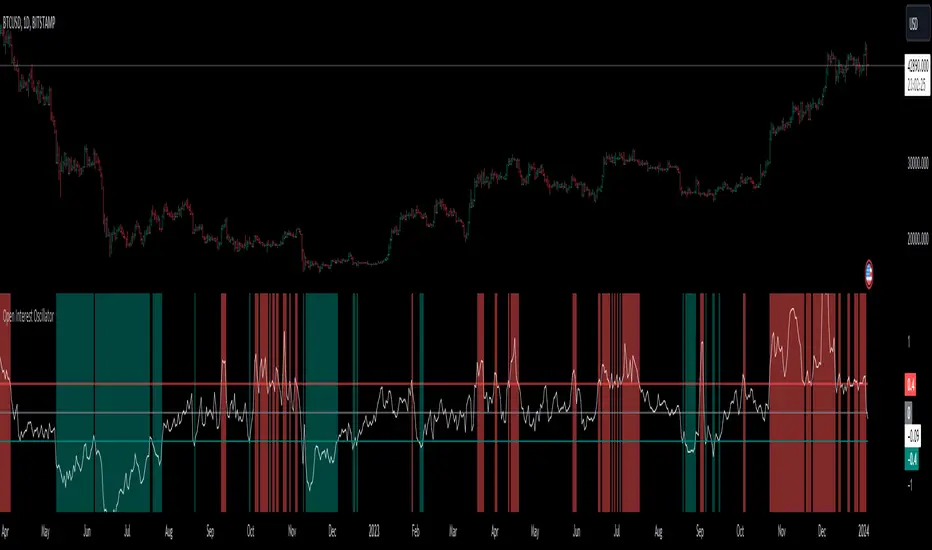
Open Interest OscillatorIn the middle of a bustling cryptocurrency market, with Bitcoin navigating a critical phase and the community hype over potential ETF approvals, current funding rates, and market leverage, the timing is optimal to harness the capabilities of sophisticated trading tools.
Meet the Open Interest Oscillator – special indicator tailored for the volatile arena of cryptocurrency trading. This powerful instrument is adept at consolidating open interest data from a multitude of exchanges, delivering an in-depth snapshot of market sentiment across all timeframes, be it a 1-minute sprint or a weekly timeframe.
This versatile indicator is compatible with nearly all cryptocurrency pairs, offering an expansive lens through which traders can gauge the market's pulse.
Key Features:
-- Multi-exchange Data Aggregation: This feature taps into the heart of the crypto market by aggregating open interest data from premier exchanges such as BINANCE, BITMEX, BITFINEX, and KRAKEN. It goes a step further by integrating data from various pairs and stablecoins, thus providing traders with a rich, multi-dimensional view of market activities.
-- Open Interest Bars: Witness the flow of market dynamics through bars that depict the volume of positions being opened or closed, offering a clear visual cue of trading behavior. In this mode, If bars are going into negative zone, then traders are closing their positions. If they go into positive territory - leveraged positions are being opened.
-- Bollinger Band Integration: Incorporate a layer of statistical analysis with standard deviation calculations, which frame the open interest changes, giving traders a quantified edge to evaluate the market's volatility and momentum.
-- Oscillator with Customizable Thresholds: Personalize your trading signals by setting thresholds that resonate with your unique trading tactics. This customization brings the power of tailored analytics to your strategic arsenal.
-- Max OI Ceiling Setting: In the fast-paced crypto environment where data can surge to overwhelming levels, the Max OI Ceiling ensures you maintain a clear view by capping the open interest data, thus preserving the readability and interpretability of information, even when market activity reaches feverish heights.
Bollinger Bands Trend - Boosted [UOI]The legendary John Bollinger, the creator of Bollinger Bands , has done it again. He recently observed that an interaction between a long-term Bollinger band (BB 50) and a shorter-term Bollinger band (BB 20) can not only provide a frame of reference for price action and volatility but also identify trends and offer excellent entry and exit guidance. Although the concept of Bollinger Bands is not new, the concept of BB trend is. The 'Bollinger Bands Trend - Boosted' indicator is an advanced and versatile trading tool, designed to offer comprehensive analysis of market trends, price action, and volatility. This new concept captures interesting market dynamics invisible to other indicators. In addition to the power of Bollinger Band trends, this indicator is boosted and skillfully combines several technical analysis elements, including Bollinger Bands, Donchian Channels, an Exponential Moving Average (EMA), Super Trend, and a Choppiness Index, to further improve the model's performance. Each component is crafted to provide a multi-dimensional view of market dynamics. Key features include:
Dual Bollinger Bands: The indicator uses two sets of Bollinger Bands with distinct periods (50 and 20) to capture different aspects of market volatility and trend momentum. Users have the flexibility to show or hide the upper, middle, and lower bands for both sets, allowing for a customized view of market movements. Users can also enable a fill function with 90% transparency to show the area between the upper and lower BB bands. By default, only the midlines of BB 20 and BB 50 are shown on the chart, and the rest are hidden and need to be enabled by the user. Here is the default plot of BB20 and BB50:
Dynamic Color Coding of Lines: The middle bands of the Bollinger Bands dynamically change colors based on their relation to the price, offering an intuitive visual representation of the trend direction. The color turns green when the price is above the band and red when below. Dynamic Line Coloring aids traders in easily identifying trends and never going against the market trend. In this image below: BB20, BB50, Mid Donchian, EMA 100, and Super Trend all change color relative to the position of the price:
Crossover and Crossunder Detection: Detects crossovers and crossunders between the 20-period and 50-period Bollinger Bands, which can signal potential trading opportunities. Color filling and the change of color of the Bollinger midlines provide a great visual for trend detection. The color filling even without the Buy and Sell signal clearly shows the direction of the trend:
Customizable Buy and Sell Signals: The indicator generates buy and sell signals based on a complex set of conditions involving the relationship between price, Bollinger Bands, EMA, Donchian Channel, and other elements. Users can customize the length and parameters of these conditions to tailor the signals to the specific equity or market they are trading. This flexibility allows traders to optimize the indicator for different equities, trading strategies, and market conditions, making it a versatile tool for various trading styles, including short-term trading and longer-term trend following. The beauty of the "buy and sell signal" of this indicator is that users control the frequency and accuracy of the signals by changing the numbers in the setting for their favorite equity to trade:
Donchian Channel: This tool incorporates a customizable Donchian Channel to pinpoint potential support and resistance areas, providing key insights into market trends. It is especially effective in highlighting breakout points by showing the highest high and lowest low over a set number of periods, thus helping traders to identify potential entry and exit points based on price movements. The middle line of the channel changes color (lime or fuchsia) based on its position relative to the price, aiding in trend identification and strength assessment, with an option for traders to toggle its visibility on the chart.
Exponential Moving Average (EMA): Features a 100-period EMA (default but users can change the value), with an option for traders to toggle its visibility on the chart. The color of the EMA line adapts to green or red depending on whether the price is above or below it, further aiding in trend analysis.
Super Trend Indicator: Adds a Super Trend line to the analysis, providing insights into market trend direction and potential reversal points. This feature is customizable, allowing users to adjust its visibility and settings as per their analysis needs. The Super Trend is an adjustable indicator to help traders not lose sight of the longer trend:
Choppiness Index: An additional tool to assess market chop or trend robustness, with customizable settings for changing candle colors based on a defined choppiness threshold. Here is an example:
The Bollinger Band Width: BBW is a separate technical indicator derived from Bollinger Bands, used to measure market volatility. It has been added to this BB Trend indicator in an innovative manner to improve the BBT indicator. It calculates the gap between the upper and lower Bollinger Bands. A narrow BBW indicates low volatility, often seen in consolidating markets leading to a squeeze or buying opportunity, while a wide BBW signals high volatility, as observed during strong price movements or breakouts which often leads to distribution in Wyckoff terms. This indicator is crucial for traders to identify periods of market contraction and expansion, aiding in predicting volatility changes and potential trend shifts. Here is a visual presentation of BB Width:
User-Friendly Customizability: The indicator offers inputs for adjusting lengths, visibility, and parameters of its various components, empowering traders to customize the tool according to their individual trading style and preferences.
This indicator is ideal for traders who prefer a single but multi-faceted strategy, offering a blend of trend analysis, volatility measurement, and market momentum insights. Its adaptability makes it suitable for a wide range of markets and trading approaches.

Universal Volatility IndexThe Universal Volatility Index (UVI) is a robust indicator designed to gauge market volatility across various asset classes. By synthesizing multiple volatility measures, the UVI offers traders a nuanced understanding of market dynamics, aiding in the assessment of risk and the decision-making process.
How It Works:
The UVI incorporates three key components to calculate a composite volatility score:
Average True Range (ATR): This represents the average volatility over the specified period, giving a base measure of market movement.
Bollinger Bands Width: Highlights the expansion or contraction of price ranges, offering insights into market volatility relative to recent price action.
Rate of Change (ROC): Captures the momentum or the velocity of price changes, adding a temporal dimension to volatility assessment.
By combining these components, the UVI delivers a singular volatility metric that adapts to changing market conditions, providing a valuable tool for traders in any market.
Usage:
To apply the UVI to your chart, add the indicator from the Pine Script library and adjust the input parameters as desired.
The plot will display a line representing the composite volatility score, with higher values indicating increased market volatility and lower values suggesting calmer market conditions.
Benefits:
The UVI is versatile and can be applied to any market, making it a universal tool for traders.
The indicator helps in identifying periods of high risk where tighter risk management may be warranted.
It assists in pinpointing potential breakouts when volatility is expanding after a period of consolidation.
Compliance with TradingView House Rules:
This script is provided for educational purposes and does not constitute financial advice. It has been created to contribute to the TradingView community by offering a versatile tool that helps traders understand and navigate market volatility.

Fibonacci Enhanced Bollinger BandsDiscover the synergistic power of Fibonacci ratios with traditional Bollinger Bands in the 'Fibonacci Enhanced Bollinger Bands' indicator. Ideal for traders seeking dynamic price levels for strategic entries and exits, this tool adds a unique Fibonacci twist to your technical analysis toolkit.
Introduction to Fibonacci Enhanced Bollinger Bands
'Fibonacci Enhanced Bollinger Bands' is a trading indicator that combines the classic Bollinger Bands approach with the powerful insights of Fibonacci ratios. By integrating these two concepts, this indicator offers traders a unique perspective on market volatility and potential support/resistance levels.
How It Works
Core Concept : The indicator calculates Bollinger Bands using a selected Fibonacci ratio. This ratio is applied to the standard deviation of the price series, providing a dynamic range around a Simple Moving Average (SMA).
Trading Strategies
Long Opportunities : The area below the lower band can be considered a potential zone for long positions. Prices in this zone may indicate an oversold market condition, suggesting a possible reversal or pullback.
Short Opportunities : Conversely, the area above the upper band might signal short-selling opportunities. Prices in this region could imply an overbought scenario, potentially leading to a price decline.
Versatility : Whether you're a day trader, swing trader, or long-term investor, this indicator adapts to various timeframes and assets, making it a versatile tool in your trading arsenal.
Conclusion
The 'Fibonacci Enhanced Bollinger Bands' indicator is designed for traders who wish to leverage the power of Fibonacci ratios in conjunction with the volatility insights provided by Bollinger Bands. It's an excellent tool for identifying potential reversal zones and refining entry and exit points. Try it out to enhance your market analysis and support your trading decisions with the combined wisdom of Fibonacci and Bollinger Bands.

Logarithmic Bollinger Bands [MisterMoTA]The script plot the normal top and bottom Bollinger Bands and from them and SMA 20 it finds fibonacci logarithmic levels where price can find temporary support/resistance.
To get the best results need to change the standard deviation to your simbol value, like current for BTC the Standards Deviation is 2.61, current Standard Deviation for ETH is 2.55.. etc.. find the right current standard deviation of your simbol with a search online.
The lines ploted by indicators are:
Main line is a 20 SMA
2 retracement Logarithmic Fibonacci 0.382 levels above and bellow 20 sma
2 retracement Logarithmic Fibonacci 0.618 levels above and bellow 20 sma
Top and Bottom Bollindger bands (ticker than the rest of the lines)
2 expansion Logarithmic Fibonacci 0.382 levels above Top BB and bellow Bottom BB
2 expansion Logarithmic Fibonacci 0.618 levels above Top BB and bellow Bottom BB
2 expansion Logarithmic Fibonacci level 1 above Top BB and bellow Bottom BB
2 expansion Logarithmic Fibonacci 1.618 levels above Top BB and bellow Bottom BB
Let me know If you find the indicator useful or PM if you need any custom changes to it.

Optimal Length BackTester [YinYangAlgorithms]This Indicator allows for a ‘Optimal Length’ to be inputted within the Settings as a Source. Unlike most Indicators and/or Strategies that rely on either Static Lengths or Internal calculations for the length, this Indicator relies on the Length being derived from an external Indicator in the form of a Source Input.
This may not sound like much, but this application may allows limitless implementations of such an idea. By allowing the input of a Length within a Source Setting you may have an ‘Optimal Length’ that adjusts automatically without the need for manual intervention. This may allow for Traditional and Non-Traditional Indicators and/or Strategies to allow modifications within their settings as well to accommodate the idea of this ‘Optimal Length’ model to create an Indicator and/or Strategy that adjusts its length based on the top performing Length within the current Market Conditions.
This specific Indicator aims to allow backtesting with an ‘Optimal Length’ inputted as a ‘Source’ within the Settings.
This ‘Optimal Length’ may be used to display and potentially optimize multiple different Traditional Indicators within this BackTester. The following Traditional Indicators are included and available to be backtested with an ‘Optimal Length’ inputted as a Source in the Settings:
Moving Average; expressed as either a: Simple Moving Average, Exponential Moving Average or Volume Weighted Moving Average
Bollinger Bands; expressed based on the Moving Average Type
Donchian Channels; expressed based on the Moving Average Type
Envelopes; expressed based on the Moving Average Type
Envelopes Adjusted; expressed based on the Moving Average Type
All of these Traditional Indicators likewise may be displayed with multiple ‘Optimal Lengths’. They have the ability for multiple different ‘Optimal Lengths’ to be inputted and displayed, such as:
Fast Optimal Length
Slow Optimal Length
Neutral Optimal Length
By allowing for the input of multiple different ‘Optimal Lengths’ we may express the ‘Optimal Movement’ of such an expressed Indicator based on different Time Frames and potentially also movement based on Fast, Slow and Neutral (Inclusive) Lengths.
This in general is a simple Indicator that simply allows for the input of multiple different varieties of ‘Optimal Lengths’ to be displayed in different ways using Tradition Indicators. However, the idea and model of accepting a Length as a Source is unique and may be adopted in many different forms and endless ideas.
Tutorial:
You may add an ‘Optimal Length’ within the Settings as a ‘Source’ as followed in the example above. This Indicator allows for the input of a:
Neutral ‘Optimal Length’
Fast ‘Optimal Length’
Slow ‘Optimal Length’
It is important to account for all three as they generally encompass different min/max length values and therefore result in varying ‘Optimal Length’s’.
For instance, say you’re calculating the ‘Optimal Length’ and you use:
Min: 1
Max: 400
This would therefore be scanning for 400 (inclusive) lengths.
As a general way of calculating you may assume the following for which lengths are being used within an ‘Optimal Length’ calculation:
Fast: 1 - 199
Slow: 200 - 400
Neutral: 1 - 400
This allows for the calculation of a Fast and Slow length within the predetermined lengths allotted. However, it likewise allows for a Neutral length which is inclusive to all lengths alloted and may be deemed the ‘Most Accurate’ for these reasons. However, just because the Neutral is inclusive to all lengths, doesn’t mean the Fast and Slow lengths are irrelevant. The Fast and Slow length inputs may be useful for seeing how specifically zoned lengths may fair, and likewise when they cross over and/or under the Neutral ‘Optimal Length’.
This Indicator features the ability to display multiple different types of Traditional Indicators within the ‘Display Type’.
We will go over all of the different ‘Display Types’ with examples on how using a Fast, Slow and Neutral length would impact it:
Simple Moving Average:
In this example above have the Fast, Slow and Neutral Optimal Length formatted as a Slow Moving Average. The first example is on the 15 minute Time Frame and the second is on the 1 Day Time Frame, demonstrating how the length changes based on the Time Frame and the effects it may have.
Here we can see that by inputting ‘Optimal Lengths’ as a Simple Moving Average we may see moving averages that change over time with their ‘Optimal Lengths’. These lengths may help identify Support and/or Resistance locations. By using an 'Optimal Length' rather than a static length, we may create a Moving Average which may be more accurate as it attempts to be adaptive to current Market Conditions.
Bollinger Bands:
Bollinger Bands are a way to see a Simple Moving Average (SMA) that then uses Standard Deviation to identify how much deviation has occurred. This Deviation is then Added and Subtracted from the SMA to create the Bollinger Bands which help Identify possible movement zones that are ‘within range’. This may mean that the price may face Support / Resistance when it reaches the Outer / Inner bounds of the Bollinger Bands. Likewise, it may mean the Price is ‘Overbought’ when outside and above or ‘Underbought’ when outside and below the Bollinger Bands.
By applying All 3 different types of Optimal Lengths towards a Traditional Bollinger Band calculation we may hope to see different ranges of Bollinger Bands and how different lookback lengths may imply possible movement ranges on both a Short Term, Long Term and Neutral perspective. By seeing these possible ranges you may have the ability to identify more levels of Support and Resistance over different lengths and Trading Styles.
Donchian Channels:
Above you’ll see two examples of Machine Learning: Optimal Length applied to Donchian Channels. These are displayed with both the 15 Minute Time Frame and the 1 Day Time Frame.
Donchian Channels are a way of seeing potential Support and Resistance within a given lookback length. They are a way of withholding the High’s and Low’s of a specific lookback length and looking for deviation within this length. By applying a Fast, Slow and Neutral Machine Learning: Optimal Length to these Donchian Channels way may hope to achieve a viable range of High’s and Low’s that one may use to Identify Support and Resistance locations for different ranges of Optimal Lengths and likewise potentially different Trading Strategies.
Envelopes / Envelopes Adjusted:
Envelopes are an interesting one in the sense that they both may be perceived as useful; however we deem that with the use of an ‘Optimal Length’ that the ‘Envelopes Adjusted’ may work best. We will start with examples of the Traditional Envelope then showcase the Adjusted version.
Envelopes:
As you may see, a Traditional form of Envelopes even produced with a Machine Learning: Optimal Length may not produce optimal results. Unfortunately this may occur with some Traditional Indicators and they may need some adjustments as you’ll notice with the ‘Envelopes Adjusted’ version. However, even without the adjustments, these Envelopes may be useful for seeing ‘Overbought’ and ‘Oversold’ locations within a Machine Learning: Optimal Length standpoint.
Envelopes Adjusted:
By adding an adjustment to these Envelopes, we may hope to better reflect our Optimal Length within it. This is caused by adding a ratio reflection towards the current length of the Optimal Length and the max Length used. This allows for the Fast and Neutral (and potentially Slow if Neutral is greater) to achieve a potentially more accurate result.
Envelopes, much like Bollinger Bands are a way of seeing potential movement zones along with potential Support and Resistance. However, unlike Bollinger Bands which are based on Standard Deviation, Envelopes are based on percentages +/- from the Simple Moving Average.
We will conclude our Tutorial here. Hopefully this has given you some insight into how useful adding a ‘Optimal Length’ within an external (secondary) Indicator as a Source within the Settings may be. Likewise, how useful it may be for automation sake in the sense that when the ‘Optimal Length’ changes, it doesn’t rely on an alert where you need to manually update it yourself; instead it will update Automatically and you may reap the benefits of such with little manual input needed (aside from the initial setup).
If you have any questions, comments, ideas or concerns please don't hesitate to contact us.
HAPPY TRADING!

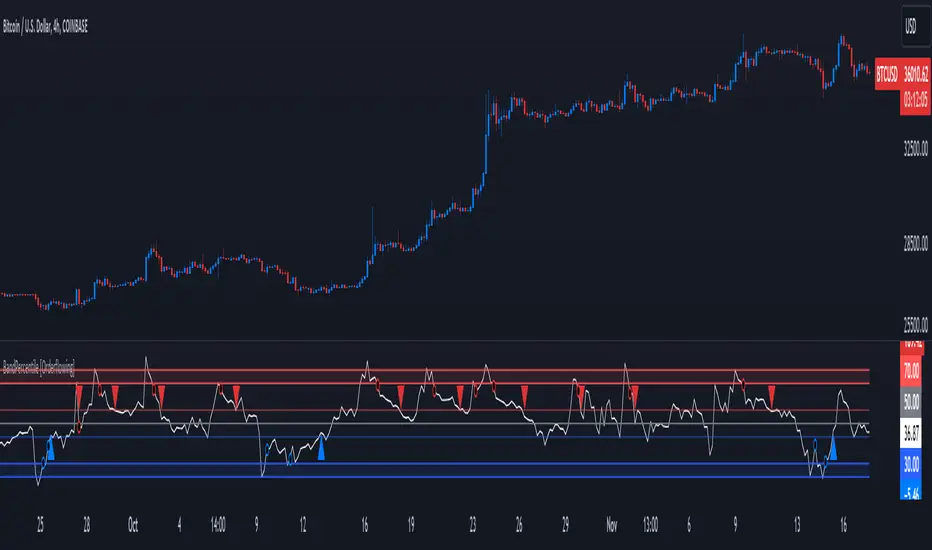
BandPercentile [Orderflowing]BandPercentile | Bollinger Band Analysis | Bandpass Filtering | Customizable (+)
Built using Pine Script V5.
Introduction
The BandPercentile indicator is a technical analysis tool that improves the traditional Bollinger Bands as a Percentile concept.
Inspiration and Evolution
The BandPercentile was born of the simplicity of calculating the Bollinger Bands Percentile.
It evolves this concept by addressing a need for greater customization and precision.
The integration of the Experimental version of the Bandpass Filter & Super Smoothing, a concept by John Ehlers, adds a layer of sophistication - allowing for a different view.
Core Functionality
The BandPercentile calculates percentile values based on the position of the price within the Bollinger Bands, offering a way to see overbought and oversold market conditions.
The indicator is designed to provide clear visual cues for market extremes, aiding in decision-making for entries and exits.
These market extremes or overbought/sold levels are fully customizable.
Unique Features and Customization
Overbought/Oversold Dots: Visual markers for identifying critical market thresholds.
Divergence Detection: Highlights potential bullish and bearish divergences, aiding in predictive analysis.
Multiple Moving Average Types: Choose from SMA, Hull, Dema, EMA, WMA, and LINREG for calculations.
Customizable Parameters: Adjust length, multiplier, and overbought/oversold levels to fit various trading styles.
Roofing Filter Integration: Incorporates Ehlers' Bandpass Filter for signal processing.
Example of 2 pole bandpass filtering on daily calculation / 4 hour chart:
Example of 3 pole bandpass filtering on daily calculation / 4 hour chart:
Analysis and Interpretation
The indicator provides a scale, ranging from extreme overbought to extreme oversold levels, with customizable levels for divergence/confirmed trend shift analysis.
This scale is useful for traders to understand market sentiment and potential reversal points.
Interpretation and Visuals
The BandPercentile indicator is designed with a clear, color-coded system for better readability and quick interpretation:
Primary Overbought and Oversold Lines: These are marked in red and blue, respectively, to signify the most critical overbought and oversold levels.
Extended Overbought and Oversold Lines: Additional red and blue lines represent extended overbought and oversold levels, showing more extreme market conditions.
Middle Line: This line acts as a central balance point, providing a reference for the current market state relative to overbought and oversold conditions.
Intermediate Middle Levels: These are additional lines marked in lighter shades of blue and red, indicating lower mid and higher mid levels that can signal emerging trends or potential reversals.
Markers: Distinct shapes are used to highlight potential trend reversals, helping with identifying opportunities.
Multi-Timeframe
The indicator's flexibility allows for application across most asset classes and timeframes, making it suitable for different trading strategies, from day trading to long-term investing.
Example using the Daily BandPercentile on a 4H chart:
Trading Style
Whether you are a momentum trader, swing trader, or a long-term investor.
The BandPercentile can be made to suit diverse trading styles and risk parameters.
Usage and Applications
Market Extremes Identification - Pinpoint overbought and oversold conditions.
Divergence Analysis - Detect potential trend reversals before they occur.
Customizable Analysis - Edit the indicator inputs to align with personal trading strategies and preferences.
The Value
BandPercentile stands out as an innovative tool.
It also respects the individuality of each trader's approach.
Its advanced filtering and customization capabilities makes it valuable.
Conclusion
The BandPercentile indicator is a useful tool for traders to optimize their strategy.
Its unique blend of traditional concepts and modern filtering techniques makes it one-of-a-kind.
Do not solely rely on the signals from the BandPercentile.
The indicator is meant to be used as confluence to your existing strategy.
What RSI? Weighted Heiken Ashi Triple RSIWhat You're Looking At:
The indicator presents a few key elements on its pane which is separate from the price chart:
Smoothed RSI Average Line: This line represents an average of three different RSI calculations, each weighted differently. It's been smoothed out to reduce noise and help you see the trend more clearly.
Moving Average Line: This is a line that smooths out the average RSI line even further and helps you identify the overall trend.
Bollinger Bands: These are two lines that create a channel around the RSI average line. The upper band typically represents an overbought condition, and the lower band represents an oversold condition.
Background Color: The background of the indicator pane will change colors to indicate buy (green) or sell (red) signals.
Horizontal Lines: There are horizontal lines drawn at levels 70, 50, and 30. These represent overbought, midpoint, and oversold levels, respectively.
How to Operate and Interpret:
Trend Identification: Look at the moving average line. If it's trending upwards, the overall momentum may be considered bullish. If it's trending downwards, the momentum may be bearish.
Buy Signals: You may consider a buy signal when:
The smoothed RSI average crosses above the moving average line.
The smoothed RSI average is below 30 and starts to rise, crossing the oversold line.
The background color turns green, signifying favorable conditions to buy according to the indicator's logic.
Sell Signals: You may consider a sell signal when:
The smoothed RSI average crosses below the moving average line.
The smoothed RSI average is above 70 and starts to fall, crossing the overbought line.
The background color turns red, signifying favorable conditions to sell according to the indicator's logic.
Overbought/Oversold Conditions: When the smoothed RSI line touches or crosses the Bollinger Bands, it could be indicating that the asset is overbought (upper band) or oversold (lower band). Some traders use these conditions to look for potential reversals.
Cautions for Trading:
If the smoothed RSI average is between the bands and near the middle line (50), the market might be considered neutral, and some traders may choose to wait for clearer signals.
Just because the indicator gives a buy or sell signal, it doesn't mean the price will immediately move in that direction. It's important to consider other factors in your trading strategy.
Final Notes:
Always use this indicator in conjunction with other analysis methods. No indicator is perfect, and they should be used to supplement your trading strategy, not replace it.
It's important to set stop losses according to your risk tolerance when entering any trades based on these signals.
Practice with the indicator in a demo account to become familiar with its behavior before using it with real money.
By following the movements and signals of this indicator, you can get a sense of the momentum and potential entry or exit points in the markets you are trading.

Bollinger Bands (Nadaraya Smoothed) | Flux ChartsTicker: AMEX:SPY , Timeframe: 1m, Indicator settings: default
General Purpose
This script is an upgrade to the classic Bollinger Bands. The idea behind Bollinger bands is the detection of price movements outside of a stock's typical fluctuations. Bollinger Bands use a moving average over period n plus/minus the standard deviation over period n times a multiplier. When price closes above or below either band this can be considered an abnormal movement. This script allows for the classic Bollinger Band interpretation while de-noising or "smoothing" the bands.
Efficacy
Ticker: AMEX:SPY , Timeframe: 1m, Indicator settings: Standard Dev: 2; Level 1 : off; Level 2: off; labels: off
Upper Band Key:
Blue: Bollinger No smoothing
Orange: Bollinger SMA smoothing period of 10
Purple: Bollinger EMA smoothing period of 10
Red: Nadaraya Smoothed Bollinger bandwidth of 6
Here we chose periods so that each would have a similar offset from the original Bollinger's. Notice that the Red Band has a much smoother result while on average having a similar fit to the other smoothing techniques. Increasing the EMA's or SMA's period would result in them being smoother however the offset would increase making them less accurate to the original data.
Ticker: AMEX:SPY , Timeframe: 1m, Indicator settings: Standard Dev: 2; Level 1: off; Level 2: off; labels: off
Upper Band Key:
Blue: Bollinger No smoothing
Orange: Bollinger SMA smoothing period of 20
Purple: Bollinger EMA smoothing period of 20
Red: Nadaraya Smoothed Bollinger bandwidth of 6
This makes the Nadaraya estimator a particularly efficacious technique in this use case as it achieves a superior smoothness to fit ratio.
How to Use
This indicator is not intended to be used on its own. Its use case is to identify outlier movements and periods of consolidation. The Smoothing Factor when lowered results in a more reactive but noisy graph. This setting is also known as the "bandwidth" ; it essentially raises the amplitude of the kernel function causing a greater weighting to recent data similar to lowering the period of a SMA or EMA. The repaint smoothing simply draws on the Bollinger's each chart update. Typically repaint would be used for processing and displaying discrete data however currently it's simply another way to display the Bollinger Bands.
What makes this script unique.
Since Bollinger bands use standard deviation they have excess noise. By noise we mean minute fluctuations which most traders will not find useful in their strategies. The Nadaraya-Watson estimator, as used, is essentially a weighted average akin to an ema. A gaussian kernel is placed at the candlestick of interest. That candlestick's value will have the highest weight. From that point the other candlesticks' values effect on the average will decrease with the slope of the kernel function. This creates a localized mean of the Bollinger Bands allowing for reduced noise with minimal distortion of the original Bollinger data.

Z-Score - AsymmetrikZ-Score-Asymmetrik User Manual
Introduction
The Z-Score Indicator is a powerful tool used in technical analysis to measure how far a data point is from the mean value of a dataset, measured in terms of standard deviations. This indicator helps traders identify potential overbought or oversold conditions in the market.
This user manual provides a comprehensive guide on how to use the Z-Score Indicator in TradingView.
0. Quickstart
- Set the thresholds based on your asset (number of standard deviations that you consider being extreme for this asset / timeframe).
- Red background indicates a possible overbought situation, green background an oversold one.
- The color and direction of the Z-Score Line acts as a confirmation of the trend reversal.
1. Indicator Overview
The Z-Score Indicator, also known as the Z-Score Oscillator, is designed to display the Z-Score of a selected financial instrument on your TradingView chart. The Z-Score measures how many standard deviations an asset's price is from its mean (average) price over a specified period.
The indicator consists of the following components:
- Z-Score Line: This line represents the Z-Score value and is displayed on the indicator panel.
- Background Color: The background color of the indicator panel changes based on user-defined thresholds.
2. Inputs
The indicator provides several customizable inputs to tailor it to your specific trading preferences:
- Number of Periods: This input allows you to define the number of periods over which the Z-Score will be calculated. A longer period will provide a smoother Z-Score line but may be less responsive to recent price changes.
- Z-Score Low Threshold: Sets the lower threshold value for the Z-Score. When the Z-Score crosses below this threshold, the background color of the indicator panel changes accordingly.
- Z-Score High Threshold: Sets the upper threshold value for the Z-Score. When the Z-Score crosses above this threshold, the background color of the indicator panel changes accordingly.
3. How to Use the Indicator
Here are the steps to use the Z-Score Indicator:
- Adjust Parameters: Modify the indicator's inputs as needed. You can change the number of periods for the Z-Score calculation and set your desired low and high thresholds.
- Interpret the Indicator: Observe the Z-Score line on the indicator panel. It fluctuates above and below zero. Pay attention to the background color changes when the Z-Score crosses your specified thresholds.
4. Interpreting the Indicator
- Z-Score Line: The Z-Score line represents the current Z-Score value. When it is above zero, it suggests that the asset's price is above the mean, indicating potential overvaluation. When below zero, it suggests undervaluation.
- Background Color: The background color of the indicator panel changes based on the Z-Score's position relative to the specified thresholds. Green indicates the Z-Score is below the low threshold (potential undervaluation), while red indicates it is above the high threshold (potential overvaluation).
- Z-Score Line Color: The color of the Z-Score line shows that the Z-Score is trending up compared to its moving average. This can be used as a validation of the background color.
5. Customization Options
You can customize the Z-Score Indicator in the following ways:
- Adjust Inputs: Modify the number of periods and the Z-Score thresholds.
- Change Line and Background Colors: You can customize the colors of the Z-Score line and background by editing the indicator's script.
6. Troubleshooting
If you encounter any issues while using the Z-Score Indicator, make sure to check the following:
- Ensure that the indicator is applied correctly to your chart.
- Verify that the indicator's inputs match your intended settings.
- Contact me for more support if needed
7. Conclusion
The Z-Score Indicator is a valuable tool for traders and investors to identify potential overbought and oversold conditions in the market. By understanding how the Z-Score works and customizing it to your preferences, you can integrate it into your trading strategy to make informed decisions.
Remember that trading involves risk, and it's essential to combine technical indicators like the Z-Score with other analysis methods and risk management strategies for successful trading.

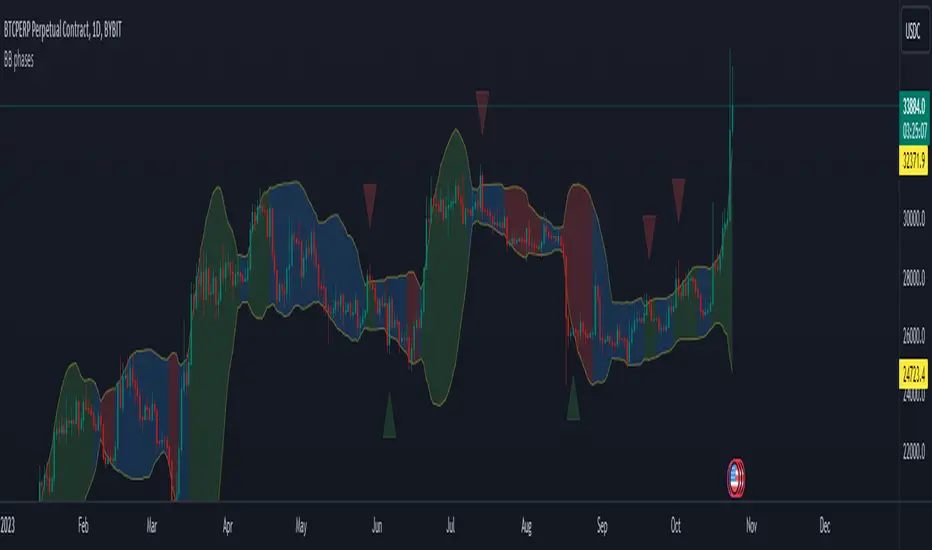
BB phasesThis indicator is designed to visually represent different market phases based on Bollinger Bands (BB) and provide insights into potential bullish and bearish signals. Let's break down what the indicator does:
The indicator smoothly transitions from the "squeeze" phase to "bullish" or "bearish" phases based on specific price conditions. Here's a more detailed explanation of how this transition occurs:
Squeeze Phase: The "squeeze" phase is identified when the closing price is within the range between the upper Bollinger Band (upper BB) and the lower Bollinger Band (lower BB).
Transition to Bullish Phase: The transition from "squeeze" to "bullish" phase occurs when the price closes above the upper BB. The bullish phase will last while the price hasn't closed below the middle BB.
Transition to Bearish Phase: Conversely, the transition from "squeeze" to "bearish" phase occurs when the price closes below the lower BB. The bearish phase will last while the price hasn't closed above the middle BB.
Another feature of the indicator is to display bearish/bullish triangles when the price reintegrate the bollinger bands after it previously breaked it. For example if the price closes below the lower BB and then the next candle in above the lower BB, a bullish triangle will be displayed.
Fiboborsa+BistTitle: "Fiboborsa+Bist Indicator for TradingView"
Description: The "Fiboborsa+Bist" indicator is a powerful tool designed for TradingView users. This indicator offers a comprehensive set of technical indicators to assist you in your technical analysis and trading decisions.
Features:
Simple Moving Averages (SMA): You can enable or disable SMA with different periods (20, 50, 100, 200) to observe different timeframes and trends.
SMA Strategy: Use SMA crossovers to determine trends. Watch for the 20-period SMA crossing above the 50-period SMA for a bullish signal. For a bearish signal, observe the 50-period SMA crossing below the 100-period SMA.
Exponential Moving Averages (EMA): Similar to SMA, you can enable or disable EMA with different periods (5, 8, 14, 21, 34, 55, 89, 144, 233) for more precise trend analysis.
EMA Strategy: Use EMA crossovers and crossunders for short-term trend changes. A buy signal may occur when the 5-period EMA crosses above the 14-period EMA, while a crossunder suggests a selling opportunity.
Weighted Moving Averages (WMA): Customize WMA settings with various periods (5, 13, 21, 34, 89, 144, 233, 377, 610, 987) to suit your trading style.
WMA Strategy: Use WMA crossovers to verify trends. When the 13-period WMA crosses above the 34-period WMA, it may indicate an uptrend.
Buy and Sell Signals: The indicator provides buy and sell signals based on EMA crossovers and crossunders. Strong signals are also highlighted.
EMA Buy and Sell Strategy: Make informed trading decisions using buy and sell signals generated by EMA crossovers and crossunders.
Ichimoku Cloud: You can enable the Ichimoku Cloud for a clear visual representation of support and resistance levels.
Ichimoku Strategy: Use the Ichimoku Cloud to determine trend direction. Entering long positions is common when the price is above the cloud and considering short positions when it's below the cloud. Verify the trend with the Chikou Span.
Bollinger Bands: Easily visualize price volatility by enabling the Bollinger Bands feature.
Bollinger Bands Strategy: Bollinger Bands help you visualize price volatility. Look for potential reversal points when the price touches or crosses the upper or lower bands.
Use the "Fiboborsa+Bist" indicator to enhance your trading strategies and make informed decisions in the dynamic world of financial markets.
Additional Information:
Bollinger Bands: Bollinger Bands are a technical analysis tool used to monitor price volatility and determine overbought or oversold conditions. This indicator consists of three components:
Middle Moving Average (SMA): Typically, a 20-day SMA is used.
Upper Band: Calculated by adding two times the standard deviation to the SMA.
Lower Band: Calculated by subtracting two times the standard deviation from the SMA.
As the price moves between these two bands, it becomes possible to identify potential buying or selling points by comparing its height or low with these bands.
Ichimoku Cloud: The Ichimoku Cloud is a comprehensive indicator used for trend identification, defining support and resistance levels, and measuring trend strength. The Ichimoku Cloud comprises five key components:
Tenkan Sen (Conversion Line): Used to identify short-term trends.
Kijun Sen (Base Line): Used to identify medium-term trends.
Senkou Span A (Leading Span A): Calculated as (Tenkan Sen + Kijun Sen) / 2 and shows future support and resistance levels.
Senkou Span B (Leading Span B): Calculated as (highest high + lowest low) / 2 and indicates future support and resistance levels.
Chikou Span (Lagging Line): Enables tracking the price backward.
The Ichimoku Cloud interprets a price above the cloud as an uptrend and below the cloud as a downtrend. The Chikou Span assists in verifying the current trend.
ADDITIONAL STRATEGY WITH RSI AND MACD INDICATORS
**Strategy: Two-Stage Trading Strategy Using RSI, MACD, and Fiboborsa+Bist Indicators**
**Stage 1: Determining the Trend and Selecting the Trading Direction**
1. **Trend Identification with Fiboborsa+Bist Indicator:**
- Analyze the simple moving averages (SMA), exponential moving averages (EMA), and weighted moving averages (WMA) used with the Fiboborsa+Bist indicator. These indicators will provide information about the direction of the market trend.
2. **Identifying Overbought and Oversold Conditions with RSI:**
- Use the RSI indicator to identify overbought (70 and above) and oversold (30 and below) conditions. This helps in measuring the strength of the trend. If RSI enters the overbought zone, a downward correction is likely. If RSI enters the oversold zone, an upward correction is probable.
3. **Evaluating Momentum with MACD:**
- Examine price momentum using the MACD indicator. When the MACD line crosses above the signal line, it may indicate an increasing upward momentum. Conversely, a downward cross can suggest an increasing downward momentum.
**Stage 2: Generating Buy and Sell Signals**
4. **Combining RSI, MACD, and Fiboborsa+Bist Indicators:**
- To generate a buy signal, wait for RSI to move out of the oversold region into an uptrend and for the MACD line to cross above the signal line.
- To generate a sell signal, wait for RSI to move out of the overbought region into a downtrend and for the MACD line to cross below the signal line.
5. **Confirmation with Fiboborsa+Bist Indicator:**
- When you receive a buy or sell signal, use the Fiboborsa+Bist indicator to confirm the market trend. Confirming the trend can strengthen your trade signals.
6. **Setting Stop-Loss and Take-Profit Levels:**
- Remember to manage risk when opening buy or sell positions. Set stop-loss and take-profit levels to limit your risk.
7. **Monitor and Adjust Your Trades:**
- Continuously monitor your trade positions and adjust your strategy as per market conditions.
This two-stage trading strategy offers the ability to determine trends and generate trade signals using different indicators. However, every trading strategy involves risks, so risk management and practical application are essential. Also, it's recommended to test this strategy in a demo account before using it in a real trading account.

Better RSIThis script is an enhancement of the original RSI (Relative Strength Index) indicator for TradingView. While the core RSI functionality remains intact, several powerful features have been added to make it a "Better RSI" tool for traders and investors.
Key Features:
1. Divergence Detection: The script now includes both Bullish and Hidden Divergence detection. Bullish Divergence helps identify potential trend reversals when the price makes lower lows, but the RSI makes higher lows. Conversely, Hidden Divergence highlights instances where the RSI and price move in opposite directions, signaling potential trend continuation or reversal.
2. Bollinger Band Breakout Highlight: Users have the option to select "Bollinger Bands" as the Moving Average (MA) type in the settings. When enabled, this feature highlights RSI-Bollinger Band breakouts. It's a valuable tool for traders looking to capitalize on RSI movements in conjunction with Bollinger Bands.
3. Customizable Settings: The script provides a range of customizable settings, allowing you to adjust parameters like RSI length, MA type, Bollinger Bands standard deviation, and more to suit your trading strategy.
4. Clear Visuals: The script offers clear visual cues, with colored backgrounds indicating RSI overbought and oversold levels, as well as extreme breakouts. Bullish and bearish divergence points are also marked with distinct crosses, making it easy to spot potential trading opportunities.
Whether you're a seasoned trader or just starting, the "Better RSI" script empowers you with advanced tools to make more informed trading decisions. Use it to identify potential trend reversals, continuation patterns, and RSI-Bollinger Band breakouts in the market.
Multi Timeframe Moving AveragesThe Multi Timeframe Moving Averages indicator is a powerful tool for technical analysis that allows traders to visualize and analyze moving averages from multiple timeframes on a single chart. This can be helpful for identifying trends, support and resistance levels, and potential entry and exit points.
The indicator is highly customizable, allowing traders to choose the number of moving averages to plot, the timeframe for each moving average, and the color and style of each line. Traders can also choose to plot the moving averages as solid lines, dashed lines, or filled bands.
The indicator also includes a number of additional features, such as:
The ability to plot standard deviations around the moving averages
The ability to display a table of all the moving averages on the chart
The ability to draw arrows on the chart to indicate when prices cross the moving averages
The Multi Timeframe Moving Averages indicator can be used by traders of all experience levels and is a valuable tool for any technical trader's arsenal.
EXAMPLE USAGE
One way to use the Multi Timeframe Moving Averages indicator is to identify trends. If the moving averages on all timeframes are sloping in the same direction, then the market is likely trending in that direction. For example, if the 50-day, 100-day, and 200-day moving averages are all sloping upwards, then the market is likely in a bullish trend.
Another way to use the Multi Timeframe Moving Averages indicator is to identify support and resistance levels. Moving averages can act as both support and resistance levels, depending on the direction of the trend. For example, if the market is in a bullish trend, then the 50-day moving average can act as a support level. If the market price falls below the 50-day moving average, it could signal a potential reversal of the trend.
The Multi Timeframe Moving Averages indicator can also be used to identify potential entry and exit points. For example, a trader could enter a long position when the price crosses above the 50-day moving average and exit the position when the price crosses below the 200-day moving average.
BOLLINGER BANDS SIGNAL
For every available timeframe, if prices bounce off the lower band and cross above their moving average, the upper band becomes the upper price target. A crossing below the moving average would identify the lower band as the downside target. In a strong uptrend, prices will usually fluctuate between the upper band and the average. In that case, a crossing below the average warns of a trend reversal to the downside.
USER INPUT SETTINGS
The elements below reflect the indicator’s settings menu structure:
Near Hit % : Reduce/increase target distance by setting them closer/further away from the band. This is a percentage of the distance between the moving average and its bands.
Gradient (Size & Style) : if on, plots a customizable gradient of colors instead of lines to represent standard deviations. Each color can be changed in the Moving Average Settings” section of the settings menu
Arrows (width & Shift) : if on, will display arrow-shaped lines at the right of the real-time bar. After an MA crossover/crossunder, the arrow starts at the moving average and ends at the corresponding band until the target gets hit.
Backtest Table (Location & Size) : if on, shows a timeframe screener table. Use “Small” as a Size for better mobile screen displays. This table allows you to see active targets and their directions across every timeframe. The table also displays the weighted average (%) of Hit targets signals, from the chart's timeframe point of view to all other timeframes.
St. Dev. (length & Mult.) : Bollinger Bands / Standard deviation lookback period & multiplier
Trade Labels : off by default, highlight crossovers, crossunders, and target hit with a label numbered with its corresponding moving average from the settings menu: MA01, MA02, etc.
Moving Averages : Show/hide plotted Moving Averages Lines
Moving Average Settings (plotted)
These are the 5 moving averages and corresponding bands that can be plotted on the chart. For each of those, you can customize their timeframes, types (SMA, EMA, etc.), and lookback periods
Other Moving Averages (no plots)
Similar to the above, these moving averages will reflect on the vertical arrows and inside the table
CONCLUSION
The Multi Timeframe Moving Averages indicator is a powerful tool for technical analysis that can be used to identify trends, support and resistance levels, and potential entry and exit points. The indicator is highly customizable and includes a number of additional features, such as the ability to plot standard deviations and display a table of all the moving averages on the chart. The Multi Timeframe Moving Averages indicator is a valuable tool for any technical trader's arsenal.

DIY Custom Strategy Builder [ZP] - v1DISCLAIMER:
This indicator as my first ever Tradingview indicator, has been developed for my personal trading analysis, consolidating various powerful indicators that I frequently use. A number of the embedded indicators within this tool are the creations of esteemed Pine Script developers from the TradingView community. In recognition of their contributions, the names of these developers will be prominently displayed alongside the respective indicator names. My selection of these indicators is rooted in my own experience and reflects those that have proven most effective for me. Please note that the past performance of any trading system or methodology is not necessarily indicative of future results. Always conduct your own research and due diligence before using any indicator or tool.
===========================================================================
Introducing the ultimate all-in-one DIY strategy builder indicator, With over 30+ famous indicators (some with custom configuration/settings) indicators included, you now have the power to mix and match to create your own custom strategy for shorter time or longer time frames depending on your trading style. Say goodbye to cluttered charts and manual/visual confirmation of multiple indicators and hello to endless possibilities with this indicator.
What it does
==================
This indicator basically help users to do 2 things:
1) Strategy Builder
With more than 30 indicators available, you can select any combination you prefer and the indicator will generate buy and sell signals accordingly. Alternative to the time-consuming process of manually confirming signals from multiple indicators! This indicator streamlines the process by automatically printing buy and sell signals based on your chosen combination of indicators. No more staring at the screen for hours on end, simply set up alerts and let the indicator do the work for you.
Available indicators that you can choose to build your strategy, are coded to seamlessly print the BUY and SELL signal upon confirmation of all selected indicators:
EMA Filter
2 EMA Cross
3 EMA Cross
Range Filter (Guikroth)
SuperTrend
Ichimoku Cloud
SuperIchi (LuxAlgo)
B-Xtrender (QuantTherapy)
Bull Bear Power Trend (Dreadblitz)
VWAP
BB Oscillator (Veryfid)
Trend Meter (Lij_MC)
Chandelier Exit (Everget)
CCI
Awesome Oscillator
DMI ( Adx )
Parabolic SAR
Waddah Attar Explosion (Shayankm)
Volatility Oscillator (Veryfid)
Damiani Volatility ( DV ) (RichardoSantos)
Stochastic
RSI
MACD
SSL Channel (ErwinBeckers)
Schaff Trend Cycle ( STC ) (LazyBear)
Chaikin Money Flow
Volume
Wolfpack Id (Darrellfischer1)
QQE Mod (Mihkhel00)
Hull Suite (Insilico)
Vortex Indicator
2) Overlay Indicators
Access the full potential of this indicator using the SWITCH BOARD section! Here, you have the ability to turn on and plot up to 14 of the included indicators on your chart. Simply select from the following options:
EMA
Support/Resistance (HeWhoMustNotBeNamed)
Supply/ Demand Zone ( SMC ) (Pmgjiv)
Parabolic SAR
Ichimoku Cloud
Superichi (LuxAlgo)
SuperTrend
Range Filter (Guikroth)
Average True Range (ATR)
VWAP
Schaff Trend Cycle ( STC ) (LazyBear)
PVSRA (TradersReality)
Liquidity Zone/Vector Candle Zone (TradersReality)
Market Sessions (Aurocks_AIF)
How it does it
==================
To explain how this indictor generate signal or does what it does, its best to put in points.
I have coded the strategy for each of the indicator, for some of the indicator you will see the option to choose strategy variation, these variants are either famous among the traders or its the ones I found more accurate based on my usage. By coding the strategy I will have the BUY and SELL signal generated by each indicator in the backend.
Next, the indicator will identify your selected LEADING INDICATOR and the CONFIRMATION INDICATOR(s).
On each candle close, the indicator will check if the selected LEADING INDICATOR generates signal (long or short).
Once the leading indicator generates the signal, then the indicator will scan each of the selected CONFIRMATION INDICATORS on candle close to check if any of the CONFIRMATION INDICATOR generated signal (long or short).
Until this point, all the process is happening in the backend, the indicator will print LONG or SHORT signal on the chart ONLY if LEADING INDICATOR and all the selected CONFIRMATION INDICATORS generates signal on candle close. example for long signal, the LEADING INDICATOR and all selected CONFIRMATION INDICATORS must print long signal.
The dashboard table will show your selected LEADING and CONFIRMATION INDICATORS and if LEADING or the CONFIRMATION INDICATORS have generated signal. Signal generated by LEADING and CONFIRMATION indicator whether long or short, is indicated by tick icon ✔. and if any of the selected CONFIRMATION or LEADING indicator does not generate signal on candle close, it will be indicated with cross symbol ✖.
how to use this indicator
==============================
Using the indicator is pretty simple, but it depends on your goal, whether you want to use it for overlaying the available indicators or using it to build your strategy or for both.
To use for Building your strategy: Select your LEADING INDICATOR, and then select your CONFIRMATION INDICATOR(s). if on candle close all the indicators generate signal, then this indicator will print SHORT or LONG signal on the chart for your entry. There are plenty of indicators you can use to build your strategy, some indicators are best for longer time frame setups while others are responsive indicators that are best for short time frame.
To use for overlaying the indicators: Open the setting of this indicator and scroll to the SWITCHBOARD section, from there you can select which indicator you want to plot on the chart.
For each of the listed indicators, you have the flexibility to customize the settings and configurations to suit your preferences. simply open indicator setting and scroll down, you will find configuration for each of the indicators used.
I will also release the Strategy Backtester for this indicator soon.

Bollinger RSI BandsIndicator Description:
The "Bollinger RSI Bands" is an advanced technical analysis tool designed to empower traders with comprehensive insights into market trends, reversals, and overbought/oversold conditions. This multifaceted indicator combines the unique features of candle coloration and Bollinger Bands with the Relative Strength Index (RSI), making it an indispensable tool for traders seeking to optimize their trading strategies.
Purpose:
The primary purpose of the "Bollinger RSI Bands" indicator is to provide traders with a holistic view of market dynamics by offering the following key functionalities:
Candle Coloration: The indicator's signature candle colors - green for bullish and red for bearish - serve as a visual representation of the prevailing market trend, enabling traders to quickly identify and confirm market direction.
RSI-Based Moving Average: A smoothed RSI-based moving average is plotted, facilitating the detection of trend changes and potential reversal points with greater clarity.
RSI Bands: Upper and lower RSI bands, set at 70 and 30, respectively, help traders pinpoint overbought and oversold conditions, aiding in timely entry and exit decisions.
Bollinger Bands: In addition to RSI bands, Bollinger Bands are overlaid on the RSI-based moving average, offering insights into price volatility and highlighting potential breakout opportunities.
How to Use:
To maximize the utility of the "Bollinger RSI Bands" indicator, traders can follow these essential steps:
Candle Color Confirmation: Assess the color of the candles. Green candles signify a bullish trend, while red candles indicate a bearish trend, providing a clear and intuitive visual confirmation of market direction.
Overbought and Oversold Identification: Monitor price levels relative to the upper RSI band (70) for potential overbought signals and below the lower RSI band (30) for potential oversold signals, allowing for timely adjustments to trading positions.
Trend Reversal Recognition: Observe changes in the direction of the RSI-based moving average. A transition from bearish to bullish, or vice versa, can serve as a valuable signal for potential trend reversals.
Volatility and Breakout Opportunities: Keep a watchful eye on the Bollinger Bands. Expanding bands signify increased price volatility, often signaling forthcoming breakout opportunities.
Why Use It:
The "Bollinger RSI Bands" indicator offers traders several compelling reasons to incorporate it into their trading strategies:
Clear Trend Confirmation: The indicator's distinct candle colors provide traders with immediate confirmation of the current trend direction, simplifying trend-following strategies.
Precise Entry and Exit Points: By identifying overbought and oversold conditions, traders can make more precise entries and exits, optimizing their risk-reward ratios.
Timely Trend Reversal Signals: Recognizing shifts in the RSI-based moving average direction allows traders to anticipate potential trend reversals and adapt their strategies accordingly.
Volatility Insights: Bollinger Bands offer valuable insights into price volatility, aiding in the identification of potential breakout opportunities.
User-Friendly and Versatile: Despite its advanced features, the indicator remains user-friendly and versatile, catering to traders of all experience levels.
In summary, the "Bollinger RSI Bands" indicator is an indispensable tool for traders seeking a comprehensive view of market dynamics. With its unique combination of candle coloration and Bollinger Bands, it empowers traders to make more informed and strategic trading decisions, ultimately enhancing their trading outcomes.
Note: Always utilize this indicator in conjunction with other technical and fundamental analysis tools and exercise prudence in your trading decisions. Past performance is not indicative of future results.

Bollinger Bands Heatmap (BBH)The Bollinger Bands Heatmap (BBH) Indicator provides a unique visualization of Bollinger Bands by displaying the full distribution of prices as a heatmap overlaying your price chart. Unlike traditional Bollinger Bands, which plot the mean and standard deviation as lines, BBH illustrates the entire statistical distribution of prices based on a normal distribution model.
This heatmap indicator offers traders a visually appealing way to understand the probabilities associated with different price levels. The lower the weight of a certain level, the more transparent it appears on the heatmap, making it easier to identify key areas of interest at a glance.
Key Features
Dynamic Heatmap: Changes in real-time as new price data comes in.
Fully Customizable: Adjust the scale, offset, alpha, and other parameters to suit your trading style.
Visually Engaging: Uses gradients of colors to distinguish between high and low probabilities.
Settings
Scale
Tooltip: Scale the size of the heatmap.
Purpose: The 'Scale' setting allows you to adjust the dimensions of each heatmap box. A higher value will result in larger boxes and a more generalized view, while a lower value will make the boxes smaller, offering a more detailed look at price distributions.
Values: You can set this from a minimum of 0.125, stepping up by increments of 0.125.
Scale ATR Length
Tooltip: The ATR used to scale the heatmap boxes.
Purpose: This setting is designed to adapt the heatmap to the instrument's volatility. It determines the length of the Average True Range (ATR) used to size the heatmap boxes.
Values: Minimum allowable value is 5. You can increase this to capture more bars in the ATR calculation for greater smoothing.
Offset
Tooltip: Offset mean by ATR.
Purpose: The 'Offset' setting allows you to shift the mean value by a specified ATR. This could be useful for strategies that aim to capitalize on extreme price movements.
Values: The value can be any floating-point number. Positive values shift the mean upward, while negative values shift it downward.
Multiplier
Tooltip: Bollinger Bands Multiplier.
Purpose: The 'Multiplier' setting determines how wide the Bollinger Bands are around the mean. A higher value will result in a wider heatmap, capturing more extreme price movements. A lower value will tighten the heatmap around the mean price.
Values: The minimum is 0, and you can increase this in steps of 0.2.
Length
Tooltip: Length of Simple Moving Average (SMA).
Purpose: This setting specifies the period for the Simple Moving Average that serves as the basis for the Bollinger Bands. A higher value will produce a smoother average, while a lower value will make it more responsive to price changes.
Values: Can be set to any integer value.
Heat Map Alpha
Tooltip: Opacity level of the heatmap.
Purpose: This controls the transparency of the heatmap. A lower value will make the heatmap more transparent, allowing you to see the price action more clearly. A higher value will make the heatmap more opaque, emphasizing the bands.
Values: Ranges from 0 (completely transparent) to 100 (completely opaque).
Color Settings
High Color & Low Color: These settings allow you to customize the gradient colors of the heatmap.
Purpose: Use contrasting colors for better visibility or colors that you prefer. The 'High Color' is used for areas with high density (high probability), while the 'Low Color' is for low-density areas (low probability).
Usage Scenarios for Settings
For Volatile Markets: Increase 'Scale ATR Length' for better smoothing and set a higher 'Multiplier' to capture wider price movements.
For Trend Following: You might want to set a larger 'Length' for the SMA and adjust 'Scale' and 'Offset' to focus on more probable price zones.
These are just recommendations; feel free to experiment with these settings to suit your specific trading requirements.
How To Interpret
The heatmap gives a visual representation of the range within which prices are likely to move. Areas with high density (brighter color) indicate a higher probability of the price being in that range, whereas areas with low density (more transparent) indicate a lower probability.
Bright Areas: Considered high-probability zones where the price is more likely to be.
Transparent Areas: Considered low-probability zones where the price is less likely to be.
Tips For Use
Trend Confirmation: Use the heatmap along with other trend indicators to confirm the strength and direction of a trend.
Volatility: Use the density and spread of the heatmap as an indication of market volatility.
Entry and Exit: High-density areas could be potential support and resistance levels, aiding in entry and exit decisions.
Caution
The Bollinger Bands Heatmap assumes a normal distribution of prices. While this is a standard assumption in statistics, it is crucial to understand that real-world price movements may not always adhere to a normal distribution.
Conclusion
The Bollinger Bands Heatmap Indicator offers traders a fresh perspective on Bollinger Bands by transforming them into a visual, real-time heatmap. With its customizable settings and visually engaging display, BBH can be a useful tool for traders looking to understand price probabilities in a dynamic way.
Feel free to explore its features and adjust the settings to suit your trading strategy. Happy trading!

Bollinger Bands Liquidity Cloud [ChartPrime]This indicator overlays a heatmap on the price chart, providing a detailed representation of Bollinger bands' profile. It offers insights into the price's behavior relative to these bands. There are two visualization styles to choose from: the Volume Profile and the Z-Score method.
Features
Volume Profile: This method illustrates how the price interacts with the Bollinger bands based on the traded volume.
Z-Score: In this mode, the indicator samples the real distribution of Z-Scores within a specified window and rescales this distribution to the desired sample size. It then maps the distribution as a heatmap by calculating the corresponding price for each Z-Score sample and representing its weight via color and transparency.
Parameters
Length: The period for the simple moving average that forms the base for the Bollinger bands.
Multiplier: The number of standard deviations from the moving average to plot the upper and lower Bollinger bands.
Main:
Style: Choose between "Volume" and "Z-Score" visual styles.
Sample Size: The size of the bin. Affects the granularity of the heatmap.
Window Size: The lookback window for calculating the heatmap. When set to Z-Score, a value of `0` implies using all available data. It's advisable to either use `0` or the highest practical value when using the Z-Score method.
Lookback: The amount of historical data you want the heatmap to represent on the chart.
Smoothing: Implements sinc smoothing to the distribution. It smoothens out the heatmap to provide a clearer visual representation.
Heat Map Alpha: Controls the transparency of the heatmap. A higher value makes it more opaque, while a lower value makes it more transparent.
Weight Score Overlay: A toggle that, when enabled, displays a letter score (`S`, `A`, `B`, `C`, `D`) inside the heatmap boxes, based on the weight of each data point. The scoring system categorizes each weight into one of these letters using the provided percentile ranks and the median.
Color
Color: Color for high values.
Standard Deviation Color: Color to represent the standard deviation on the Bollinger bands.
Text Color: Determines the color of the letter score inside the heatmap boxes. Adjusting this parameter ensures that the score is visible against the heatmap color.
Usage
Once this indicator is applied to your chart, the heatmap will be overlaid on the price chart, providing a visual representation of the price's behavior in relation to the Bollinger bands. The intensity of the heatmap is directly tied to the price action's intensity, defined by your chosen parameters.
When employing the Volume Profile style, a brighter and more intense area on the heatmap indicates a higher trading volume within that specific price range. On the other hand, if you opt for the Z-Score method, the intensity of the heatmap reflects the Z-Score distribution. Here, a stronger intensity is synonymous with a more frequent occurrence of a specific Z-Score.
For those seeking an added layer of granularity, there's the "Weight Score Overlay" feature. When activated, each box in your heatmap will sport a letter score, ranging from `S` to `D`. This score categorizes the weight of each data point, offering a concise breakdown:
- `S`: Data points with a weight of 1.
- `A`: Weights below 1 but greater than or equal to the 75th percentile rank.
- `B`: Weights under the 75th percentile but at or above the median.
- `C`: Weights beneath the median but surpassing the 25th percentile rank.
- `D`: All that fall below the 25th percentile rank.
This scoring feature augments the heatmap's visual data, facilitating a quicker interpretation of the weight distribution across the dataset.
Further Explanations
Volume Profile
A volume profile is a tool used by traders to visualize the amount of trading volume occurring at specific price levels. This kind of profile provides a deep insight into the market's structure and helps traders identify key areas of support and resistance, based on where the most trading activity took place. The concept behind the volume profile is that the amount of volume at each price level can indicate the potential importance of that price.
In this indicator:
- The volume profile mode creates a visual representation by sampling trading volumes across price levels.
- The representation displays the balance between bullish and bearish volumes at each level, which is further differentiated using a color gradient from `low_color` to `high_color`.
- The volume profile becomes more refined with sinc smoothing, helping to produce a smoother distribution of volumes.
Z-Score and Distribution Resampling
Z-Score, in the context of trading, represents the number of standard deviations a data point (e.g., closing price) is from the mean (average). It’s a measure of how unusual or typical a particular data point is in relation to all the data. In simpler terms, a high Z-Score indicates that the data point is far away from the mean, while a low Z-Score suggests it's close to the mean.
The unique feature of this indicator is that it samples the real distribution of z-scores within a window and then resamples this distribution to fit the desired sample size. This process is termed as "resampling in the context of distribution sampling" . Resampling provides a way to reconstruct and potentially simplify the original distribution of z-scores, making it easier for traders to interpret.
In this indicator:
- Each Z-Score corresponds to a price value on the chart.
- The resampled distribution is then used to display the heatmap, with each Z-Score related price level getting a heatmap box. The weight (or importance) of each box is represented as a combination of color and transparency.
How to Interpret the Z-Score Distribution Visualization:
When interpreting the Z-Score distribution through color and alpha in the visualization, it's vital to understand that you're seeing a representation of how unusual or typical certain data points are without directly viewing the numerical Z-Score values. Here's how you can interpret it:
Intensity of Color: This often corresponds to the distance a particular data point is from the mean.
Lighter shades (closer to `low_color`) typically indicate data points that are more extreme, suggesting overbought or oversold conditions. These could signify potential reversals or significant deviations from the norm.
Darker shades (closer to `high_color`) represent data points closer to the mean, suggesting that the price is relatively typical compared to the historical data within the given window.
Alpha (Transparency): The degree of transparency can indicate the significance or confidence of the observed deviation. More opaque boxes might suggest a stronger or more reliable deviation from the mean, implying that the observed behavior is less likely to be a random occurrence.
More transparent boxes could denote less certainty or a weaker deviation, meaning that the observed price behavior might not be as noteworthy.
- Combining Color and Alpha: By observing both the intensity of color and the level of transparency, you get a richer understanding. For example:
- A light, opaque box could suggest a strong, significant deviation from the mean, potentially signaling an overbought or oversold scenario.
- A dark, transparent box might indicate a weak, insignificant deviation, suggesting the price is behaving typically and is close to its average.

The Bull Trader's ZonesTBT Zones - Preferably used on the 4H chart. You should combine this script with other technical indicators as well.
In general the script helps find buy and sell opportunities early enough so as to make better decisions before taking a trade. Basically, it uses the rsi indicator, the long lower and long upper shadow candle sticks to create buy and sell zones.
The script is visibly engaging so one could easily know when the price is reverting into an Overbought or Sell zone after an uptrend, or reverting into an Oversold or Buy zone after an downtrend.
There is also the well known Bollinger Band Indicator, and it could be safer taking short trades when the price of the asset is above the Bollinger Basis, preferably close to the upper Bollinger Band. Vice-versa for long trades.
Adding the Camarilla L3 and H3 strategy could give an edge. Respecting the zones, if the open price is between H3 and L3;
BUY when the price moves back above L3 after going below L3. Target will be H1, H2, H3 levels. Stop loss can be placed at L4 level. Or trail an SL,
SELL when the price moves back below H3 after going above H3. Target will be L1,L2 L3 levels and stop loss above H4. Or trail an SL. Or simply take realistic profits.
By default the zones will extend left (back in history) which could give a view on how the zone previously performed. This option could be unchecked in the options. However, information on past performance is not necessarily a guide to future performance. Trade safe. Get out on time. Wait for another opportunity to set up.
When you add this indicator to your chart you can set up alerts to be informed when a new zone is formed.
Much thanks to @cyatophilum, the pinescript coder who made this a reality.
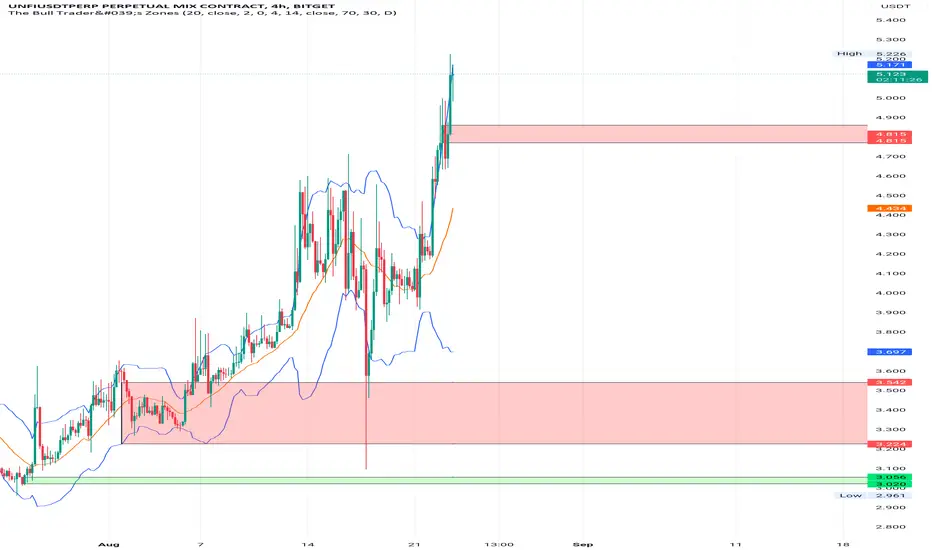
Floor and Roof IndicatorThe Floor and Roof indicator is a tool developed to help traders identify potential areas of support and resistance both for trend following and for mean reversal trading decisions.
The indicator plots the "Roof" which is the main level of resistance, and the "Floor" which is the main level of support. These lines are calculated on the "Lenght" parameter and smoothed by the "Smooth" parameter, and they use both the volatility and the main market structure as calculation methods.
Additionally, this indicator plots an area that can be modified by the "Zone width" parameter and two other lines, called "Second floor" and "Second roof" respectively, which are plotted only whenever they are significant to the price current level.
This indicator can be used in several ways:
- In a clear trend, you could wait for a break of the second floor or roof as an indication of a change in the market direction
- As the price goes out of the reversal zones, this can be an indication of a reversal
- In a clear trend, you can wait for the price to bounce on the second floor or roof lines to enter a trade
DBMA - Dual Bollinger Moving AverageThe Dual Bollinger moving average (DBMA) consists of a moving average (MA) & two Bollinger Bands (BB), with the color of the bands representing the level of price compression. In its default settings, it is a 20-day simple moving average with 2 upper Bollinger Bands, having the standard deviation (SD) settings of 0.5 & 1, respectively.
How close the price is to the moving average?
For a pullback trader, the entry point should be close to the moving average, preferably with price compression. How close should it be, is where the bands serve as a guide. The low of the pullback candle should be within the bands, that is, at least within the far band (1 SD of the MA), or even better if it's within the near band (0.5 SD). When the price is outside the bands, it should not be considered favourable for a pullback entry.
For how long has the price been closer to the moving average?
John Carter’s TTM Squeeze indicator looked at the relationship between Bollinger Bands and Keltner's Channels to help identify period of volatility contractions. Bollinger Bands being completely enclosed within the Keltner Channels is indicative of a very low volatility. This is a state of volatility contraction known as squeeze. Using different ATR lengths (1.0, 1.5 and 2.0) for Keltner Channels, we can differentiate between levels of squeeze (High, Mid & Low compression, respectively). Greater the compression, higher the potential for explosive moves.
The squeeze portion of the script is based on LazyBear's script ( Squeeze Momentum Indicator )
The High, Mid & Low compression squeezes are depicted via the color of the bands being red, orange, or yellow, respectively. With the low of the pullback candle within the bands, & the squeeze color changing to red, it should be considered favourable for a pullback entry.
Trailing the price with the lower bands
The lower bands can be used for trailing with the moving average. While trailing, once the price closes below the moving average, the trailing stoploss (TSL) is said to be triggered, & the trade is exited. Here we use the bands to give it some cushion. Let the price close below the 1SD band for labelling the TSL as being triggered to exit the trade. If the price closes below the MA but is still within the bands, the signal is to keep holding the trade.

Extreme Reversal SignalThe Extreme Reversal Signal is designed to signal potential pivot points when the price of an asset becomes extremely overbought or oversold. Extreme conditions typically signal a brief or extensive price reversal, offering valuable entry or exit points. It's important to note that this indicator may produce multiple signals, making it essential to corroborate these signals with other forms of analysis to determine their validity. While the default settings provide valuable insights, it might be beneficial to experiment with different configurations to ensure the indicator's efficacy.
Two primary conditions define extremely overbought and oversold states. The first condition is that the price must deviate by two standard deviations from the 20-day Simple Moving Average (SMA). The second condition is that the 3-day SMA of the 14-day Stochastic Oscillator (STO) derived from the 14-day Relative Strength Index (RSI) is above or below the upper or lower limit.
Oversold states arise when the first condition is met and the 3-day SMA of the 14-day Stochastic RSI falls below the lower limit, suggesting a buy signal. These are visually represented by green triangles below the price bars. Overbought states arise when the first condition is met and the 3-day SMA of the 14-day Stochastic RSI rises above the upper limit, suggesting a sell signal. These are visually represented by red triangles above the price bars. It's also possible to set up automated alerts to get notifications when either of these two conditions is met to avoid missing out.
While this indicator has traditionally identified overbought and oversold conditions in various different assets, past performance does not guarantee future results. Therefore, it is advisable to supplement this indicator with other technical tools. For instance, trend indicators can greatly improve the decision-making process when planning for entries and exit points.
