Moving Average, T3 and Bollinger StrategyThis strategy uses a SMA much like an the faster EMA in many oscillators and the T3 average of the same period as the intermediate trend. Exits are defined by encounters with the Bollinger Band. The long term trend is defined by T3 moving averages of an even longer period.
Cari dalam skrip untuk "bollingerband"

Ultimate VWAP Bands- Ultimate VWAP Bands is a script that helps to decide and further clarify areas of oversold and overbought conditions.
- For example, when the price is in the lowest band it is extremely oversold relative to the VWAP . Hence it should be considered a good place to buy with a high risk to reward payoff.
- Each band is set at a fixed offset away from the VWAP . The "VWAP Band Multiplier" adjusts this and is a key part of the script. This allows the indicator to be adjusted based on the assets volatility . For example, with Crypto. A multiplier of 1 would be strongly advised. Whilst a multiplier of 0.1-0.25 would be useful for currency pairs.
- This indicator can be used for all manners of trading. However, it is most effective when used for scalping and swing trading.

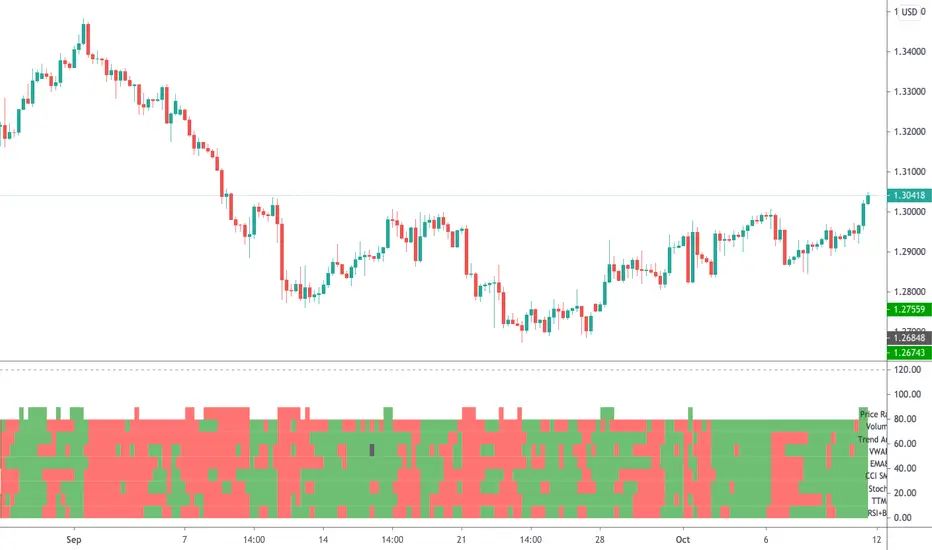
Radar Screen v3This is a combination of various indicators that very rarely conflict, thus giving us a good understanding:
- "Price Rally" detecting whether price is rallying, giving us confidence it will continue.
- Volume - knowing volume is going with the trend is a good confidence check.
- Trend Angle - This will go red or green depending on whether the price angle is going up or down, taken over three bars.
- VWAP for all of these stock traders.
- EMA8 is a very sensitive moving average, good for short term trades.
- CCI SMA is a strategy I commonly use, please check out my other indicators for a functional description.
- Stochastics is used throughout many systems.
- RSI BB shows where price is rebounding of the bollinger band and then moving up or down.
As per all of my indicators, the system is simple - The more green lines you see, the stronger the buy signal. The more red lines you see, the stronger the sell. If its a 50/50 mix of red and green, then don't trade.
I can customise this further or add other strategies, please message me.
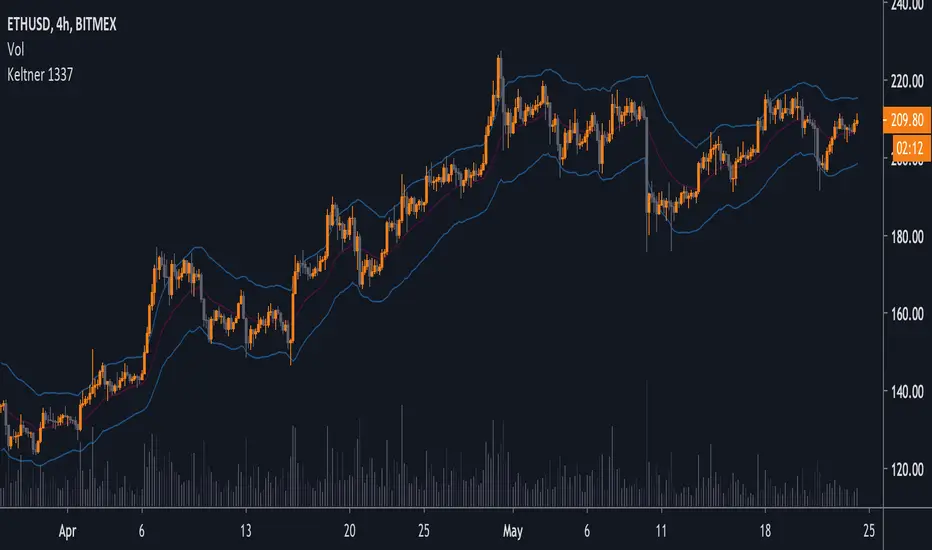
Volatility Bands by DGTVolatility represents how large an asset's prices swing around the mean price, the degree of variation of a trading price over time, and is commonly measured with beta (β) coefficients, standard deviations (σ) of returns where tools such as Average True Range, Bollinger Bands, Keltner Channel, Squeeze Indicator, etc presents volatility concept
Volatility often refers to the amount of uncertainty or risk related to the size of changes in a security's value. The higher the volatility, the riskier the security - the price of the security can change dramatically over a short time period in either direction. A lower volatility - security's value does not fluctuate dramatically, and tends to be more steady
This study, Volatility Bands , attempts to present a way to measure and visualize volatility , using standard deviations (σ) and average true range indicator, and aims to point out areas that might indicate potential trading opportunities
I will try to explain the usage with examples,
same setup with different option selected
as you may observe from the examples different setting may have advantages and disadvantages over one another, it is recommended to verify a trading setup with different available options.
Additionally, It is recommended to use this indicator in conjunction with other technical indicators, or verify using chart/candle patterns. Below is an usage example using in conjunction with other indicator, in the given example “Neglected Volume by DGT” is selected
Similarities and Differences
Bollinger Bands depicts two standard deviations above and below a simple moving average, and Keltner Channel depicts two times average true range (ATR) above and below an exponential moving average
Volatility Bands study combines the approach of both Bollinger Bands and Keltner Channel, with different settings and different visualization
Default settings are one standard deviations and one time average true range (ATR) above and below 13 period exponential moving average. Setting can be adjusted by users but let me remind all testes are performed with the default settings.
Mathematically expressed as
Upper band area between “ema + stdev” and “ema + atr”
Lower band area between “ema – stdev” and “ema – atr”
A different display is added with the inspiration I get from one of the @quantgym ‘s study, many thanks @quantgym 😉
When difference band display is selected the study will reflect the area between “ema + stdev – atr” and “ema – stdev + atr”. As shown in the examples above
Note: standard deviation calculation can be adjusted based on price action or its moving average.
Other differentiation between BB and KC is with V-BANDS mostly we look for trade opportunities when price action move out of the bands and in most cases we assume market is consolidating when the price action is within the bands
The other indicator that presents similarities to Volatility Bands is Squeeze Indicator, which measures the relationship between Bollinger Bands and Keltner's Channels to help identify consolidations and signal when prices are likely to break out. Mainly Volatility Bands is different version of Squeeze indicator, in fact the purpose is almost same but visualization is completely different. Additionally Volatility Bands Offers trading opportunities whereas Squeeze indicator only presents market states unless a momentum indicator is adapted to Squeeze indicator.
Disclaimer:
Trading success is all about following your trading strategy and the indicators should fit within your trading strategy, and not to be traded upon solely
The script is for informational and educational purposes only. Use of the script does not constitute professional and/or financial advice. You alone have the sole responsibility of evaluating the script output and risks associated with the use of the script. In exchange for using the script, you agree not to hold dgtrd TradingView user liable for any possible claim for damages arising from any decision you make based on use of the script

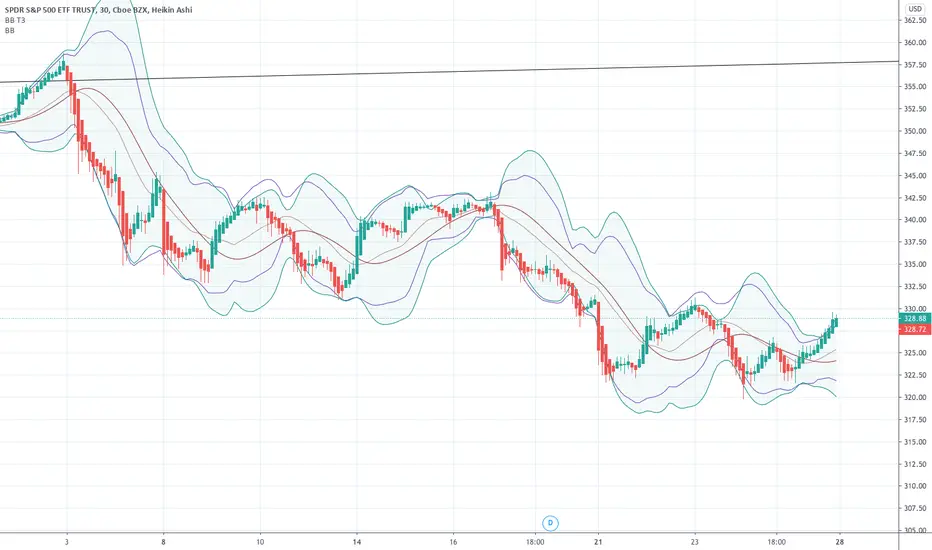
A smoother Bollinger BandThe Bollinger Band is a popular indicator due to it's ability to accurately predict future ranges based on prior volatility. However the bands can fluctuate wildly as a result of acute changes to the price. This results in a channel that is sensitive though replete with sharp angles. Replacing the simple moving average basis line with a Tillson T3 moving average results in a smoother albeit slower basis line. Deriving the bands from partially smoothed data results in more continuous bands than those of the original equation.
GLANTALL AT A DEEP GLANCE
Monitor the whole market at a glance
Give your analysis double-dimensional depth
With the help of this assistant , you can quickly aware about the various dimensions of the market and improve the quality of your trading experience.
Everything is clear in the picture so I will avoid further explanation.
All functions are controllable and highly customizable
Get instantly and accurate report of
Volume
Volume changes
Volume is higher or lower than average
Volume significant increase
2 oscillators of your choice, each one at 4 time frame of your choice, at the same time (Stoch, RSI, StochRSI, MFI, StochMFI)
Selected oscillators changes and direction
Selected oscillators divergences with full coordinate
Bollinger bands
Bollinger bands middle line changes
Bollinger bands width changes and direction
Amount of volatility
4 moving averages as type as your choice at a same time (SMA, EMA, WMA, HMA)
Mark up the moving averages as dynamic support or resistance
Crosses of the 4 averages as type as your choice at a same time (SMA, EMA, WMA, HMA) (completely separately than above mentined MAs) with full coordinate
More than 500 line code.. but Clean and Clear !
Gifts to all of you dear ones.

EMA ICHI BB [Rogulabo]3 indicators in 1.
Included Indicators are:
- EMA 8,13,21,55,100,200,450
- Ichimoku
- Bollinger Band
These can be used to determine changes in trends when:
- EMA's collide, trajectories shift, or certain levels are reached.
- Ichimoku cloud is above or below the candles.
- Bollinger Band's width changes, or range is broken.
Reasons for 3 in 1 assembly:
This indicator is intended to be used by students, and followers of Dan Takahashi
(a prominent educator of investing in Japan who is also a user of TradingView) .
Those who wants to use and learn with the same setup as Dan, would greatly benefit from this since,
the complex setting up process which can be a pain for beginners can be skipped with a simple click.
Every stylistic choice of color and placement were made to make it similar to the chart used by Dan.
Simple customizations are available such as:
- Changing color
- Changing the values
- Hide/show controls
Notes:
This is intended to be used alongside “STOCH RSI ” for the complete the setup.
Any questions, please refer to:
@rogulabo
==
高橋ダンさんが使用されてるチャートと同様のセットアップの為にご活用ください。
複数のインジケータをグループにしておりますので、無料版を使われてる方は効率よく使っていただけると思います。
また、“STOCH RSI ”どいうタイトルのインジケータも同時に公開しておりますので、セットアップを完成させたい方はこちらもご活用ください。
以下のインジケータを含みます。
・EMA線
・一目均等表
・ボリンジャーバンド
カスタマイズされたい方はご自由に値を変更ください。
ご質問は @rogulabo までよろしくお願いいたします。

Configurable BB+RSI+Aroon strategy backtest for binary optionsI wanted to share this strategy that I use myself for binary options trading. After trading binary options for several years I have learned that every single day is unique... assets behave differently every single day. So, when I start the day I want to know which is the optimum combination of parameters in my indicators that will give me the signals I want during the day and I get that by doing a quick backtest of the parameters combination in a specific asset that same day. When trading Binary Options I usually do 3 or 4 trades max per day and, yes, there are moments in which even with the right backtest data the signals fail (I strongly believe that there is no strategy that guarantees 100% success in any type of trade, and this one here is not an exception - but has worked well with some assets). So, here is my contribution to improve your productivity by automating a bit that backtesting part.
How this script works?
It is a simple price crossunder / crossover Bollinger Bands (BB) with a confirmation from RSI overbought / oversold signals and a fast Aroon. You will see the BB plotted with its confirmations:
(1) a blue circle that plots in the chart when the price is coming back inside the channel (within the Bollinger Bands)
(2) an orange square that plots in the chart when the RSI is coming back from the overbought or oversold areas
(3) a triangle that could be red or green depending on the Aroon confirmation: Red if Aroon Down is crossing down Aroon Up or green if vice versa.
The strategy will call for long (Call) if:
(1) the price is crossing over the lower band of the Bollinger Bands, coming back inside the channel
(2) Aroon Up is crossing or has crossed above Aroon Down
(3) RSI is crossing over the oversold limit
Consequently, the strategy will call for a short (Put) if:
(1) the price is crossing down the upper band of the Bollinger Bands, coming back inside the channel
(2) Aroon Down is crossing or has crossed below Aroon Up
(3) RSI is crossing under the overbought limit
You can configure:
1. Aroon length (keep it as fast as possible: 3, 4 or 5 are recommended values)
2. The point where Aroon Up and Aroon Down cross to make the signal valid (50 is by default. It could also be 25 or 75)
3. The RSI length
4. RSI Overbought and Oversold limits (they do not need to be symmetric: you can use 29 and 93, for example)
5. Bollinger Bands length and standard deviation
6. Number of bars to keep your option open. Depending on the timeframe used, this will determine the time you will keep your binary option open. If you are in a 1 min chart and keep this parameter in 3, then you will need to configure your binary option to expire in 3 minutes.
How to evaluate your backtest?
In Binary Options you only need the success rate, so what I do is that when I am manually updating the parameters I keep my strategy tester window open checking the winning trades vs losing trades ratio ("Percent Profitable"). I personally will only keep an asset monitored looking for signals that day if the Percent Profitable on the backtest of the same day is above 80%.
Regarding the code: it is open, public and free. No need to ask for permission if you want to copy+paste and use it in whole or parts.
Happy pip hunting!
-marco

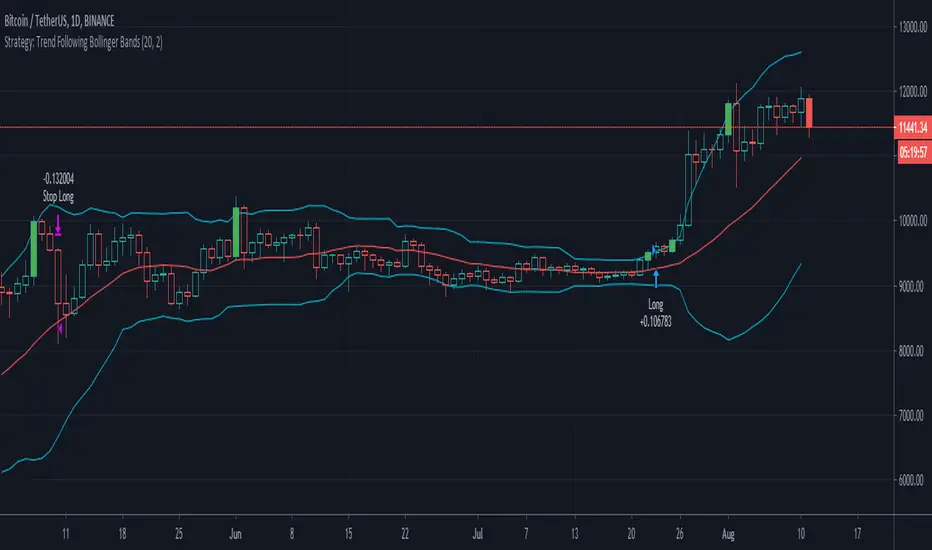
Setup Trend Following Bollinger Bands - ValenteBuy when the candle closes above upper BB
Sell when the candle closes bellow lower BB
Stop always on base line
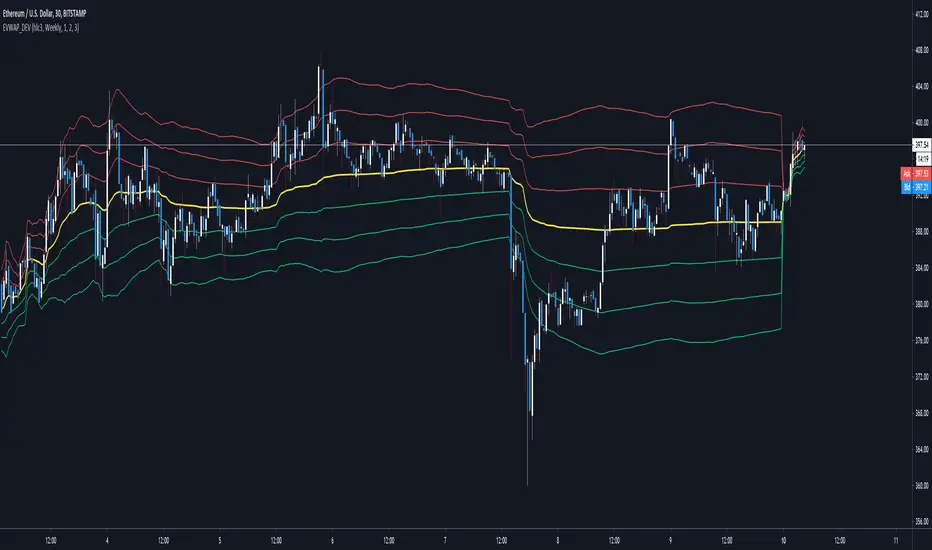
Exponential VWAP & DeviationsExponential Volume Weighted Average Price and Deviations.
Selectable intervals (daily/weekly/monthly/yearly vwap). Options to change deviation multipliers and display interval closing values for the previous interval.
Uses volume weighted EMA for the interval as the basis/vwap & exponential deviations calculated using the exponential vwap as the mean.
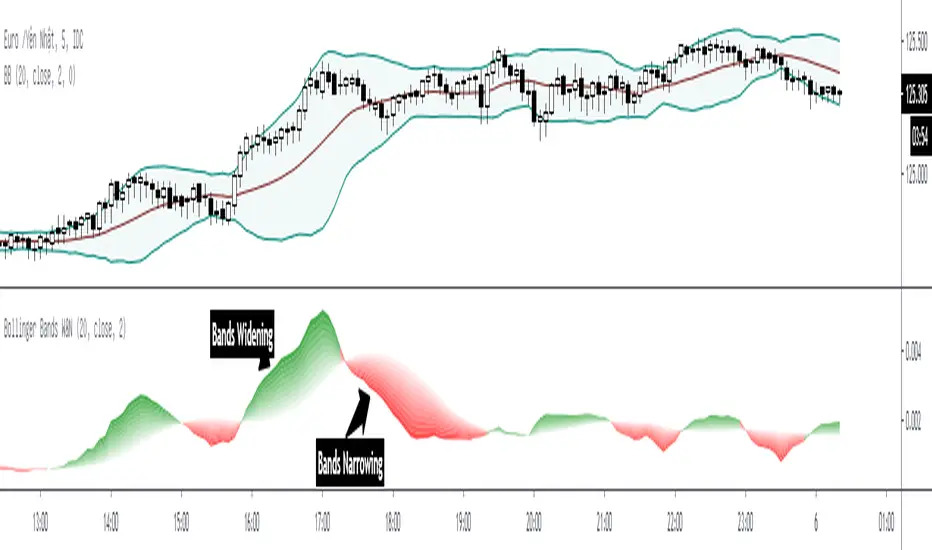
Bollinger Bands Wide & Narrow* Bollinger Bands Wide & Narrow apply a Simple Moving Average (SMA) on Bollinger Bands Width with same period of middle bands to regconize the bands are widening or narrowing.
* "Bands Widening" is marked by green shade.
* "Bands Narrowing" is marked by red shade.
Double Bollinger BandThe double bollinger band indicator uses a normal bollinger band with a multitude of 2 and on outer band with a multitude of 3. The indicator shows momentum by the price being stuck between the higher or lower bands. If price is in the middle then it is a neutral zone. The band's moving average is a default of 20 sma but included there are two extra simple moving averages just as extra indicators. This is my first published code and the code is messy; however, it gets the job done nice and simple. (:
Enjoy!

Bollinger Band Reversal StudyThis strategy was inspired by ParallaxFX.
This strategy attempts to predict when a price reversal will happen. It uses bollinger bands, stochastics and candle formations.
The idea is that when an indecision candle, such as a doji, crosses outside the bollinger bands, then is followed by another candle that pushed sharply back inside the bands, you have a setup.
These setups are marked with green arrows to go long and red arrows to go short. Wait until the next candle begins before acting. The arrow may come and go as the price fluctuates, so wait until the candle closes.
Another play is when the same setup occurs, but on the middle bollinger band instead of the outer band.
These setups are marked with blue arrows to go long and yellow arrows to go short. Wait until the next candle begins before acting. The arrow may come and go as the price fluctuates, so wait until the candle closes.
Closing can happen a number of ways. You can use a predetermined risk-reward or look to sell when the price reaches another band.
In summary.
Go long when a green or blue arrow appears.
Go Short when a red or yellow arrow appears.
Green arrows show signs of reversal from lower BB.
Blue arrows show signs of reversal from middle BB.
Red arrows show signs of reversal from upper BB.
Yellow arrows show signs of reversal from middle BB.
Wait for candle with arrow to close before taking trade.

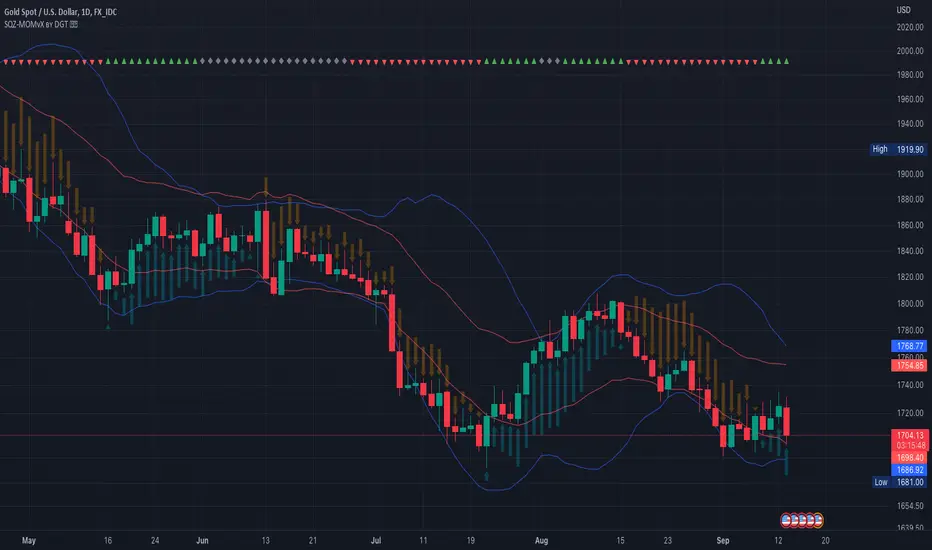
Squeeze Momentum Indicator [LazyBear] vX by DGTModified version of Squeeze Momentum Indicator visualizing on Price Chart
author: LazyBear, modified by KıvançÖZBİLGİÇ
Ichimoku ++ public v0.9Description:
The intention of this script is to build/provide a kind of work station / work bench for analysing markets and especially Bitcoin . Another goal is to get maximum market information while maintaining a good chart overview. A chart overloaded with indicators is useless because it obscures the view of the chart as the most important indicator. The chart should be clear and market structure should be easy to see. In addition, some indicator signals can be activated to better assess the quality of signals from the past. The chart environment or the chart context is important for the quality of a signal.
The intention of this script is not to teach someone how to trade or how to use these Indicators but to provide a tool to analyse markets better and to help to draw conclusions of market behaviour in a higher quality.
A general advise:
Use the included indicators and signals in a confluent way to get stoploss, buy and sell entry points. SR clusters can be identified for use in conjunction with fractals as entry and exit pints. My other scripts can also help. Prefer 4 hours, daily and a longer time frame. There is no "Holy Grail" :).
If someone is new to trading you should learn about the indicators first. Definitely learn about Ichimoku Cloud Indicator.
Integrated indicators are:
Ichimoku Cloud and signals
Parabolic SAR and signal
ATR stop
Bollinger Bands
EMA / SMA and background color as signal
Williams Fractals and signal
Puell Multiple signal

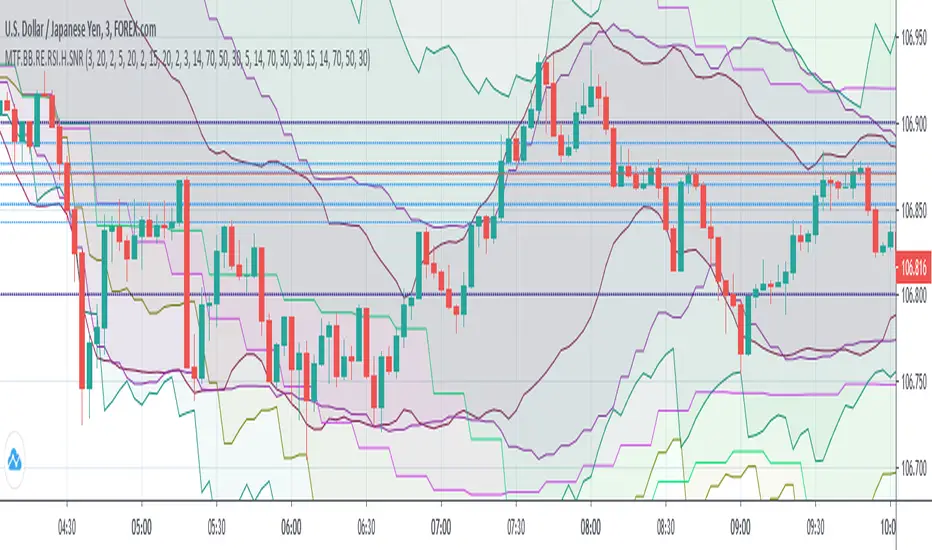
(MTF) Bollinger Bands + RE RSIs + Hidden Supports & ResistancesI merged some of my previous written indicators, because a combination of multi-timeframe Bollinger Bands, RE RSI and Resistance/Support levels could help a lot.
Don't forget to add my other useful indicator (Classical SnR) to the chart to maximize your profit!
Price Distance to its MA by DGTPrices high above the moving average (MA) or low below it are likely to be remedied in the future by a reverse price movement as stated in an Article by Denis Alajbeg, Zoran Bubas and Dina Vasic published in International Journal of Economics, Commerce and Management
Here comes a study to indicate the idea of this article, Price Distance to its Moving Averages (P/MA Ratio)
The analysis expressed in the paper indicates that there is a connection between the distance of the prices to moving averages and subsequent returns : portfolios of stocks with lower prices to moving averages generally outperformed portfolios of stocks with higher prices to moving averages. This “overextended” effect is more pronounced when using shorter moving averages of 20 and 50 days, and is especially strong in short-term holding periods like one and two weeks. The highest annual returns are recorded when buying in the range of 0-5% below shorter moving averages of 20/50 days, and 0-10% below longer moving averages of 100/200 days. However, buying very far below almost all moving averages on almost all holding periods produces the lowest returns.
The concept of this study recognizes three different modes of action.
In a clearly established upward trend traders should be buying when prices are near or below the MA line and selling when prices move too far above the MA.
Conversely, in downward trend stocks should be shorted when reaching or going above the moving average and covered when they drop too far below the MA line.
In a sideways movement traders are advised to buy if the price is too low below the moving average and sell when it goes too far above it
Short-term traders can expect to outperform in a one or two week time window if buying stocks with lower prices compared to their 20 and 50 SMA/EMA, one to two-week holding periods is quite high, ranging from 72,09% to 90,61% for the SMA(20, 50) and 85,03% to 87,5% for the EMA(20, 50). The best results for the SMA 20 and 50, on average, are concentrated in the region of 0-5% below the MA for the majority of holding periods. Buying very far below almost all MA in almost all holding periods turns out to be the worst possible option
Candle patterns, momentum could be used in conjunction with this indicator for better results. Try Colored DMI and Ichimoku colored SuperTrend by DGT

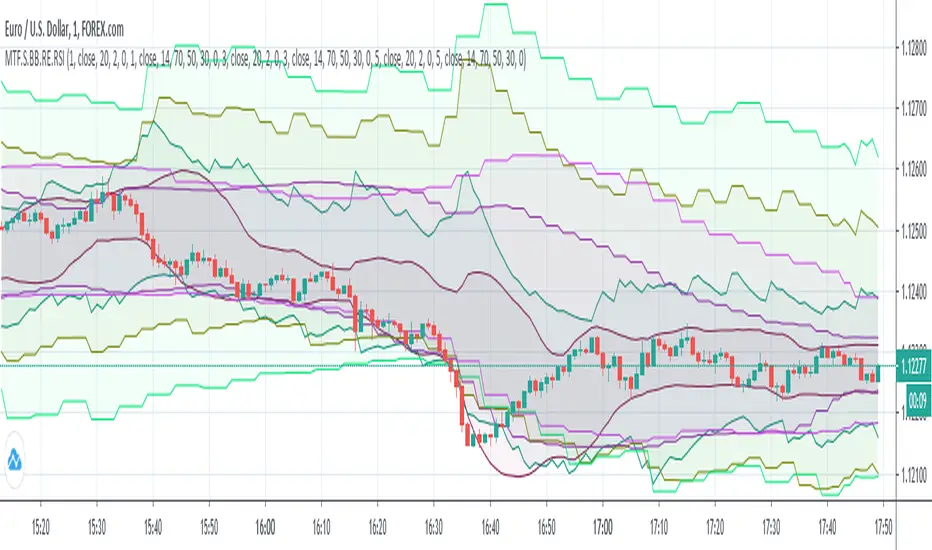
MTF Shifting BBs + Reverse Engineering RSIs Overlay on ChartAnother multi-timeframe indicator presents 3 MTF (each) Bollinger Bands and 3 MTF (each) Reverse Engineering RSI and of course with shifting (left/right) capability.
RERSI in a simple term is the RSI but on the main chart alongside with candles.
There are many adjustable options like:
- Show/Hide each BB
- Show/Hide each MA
- Non-integer BB deviation values
- Positive/Negative shifting values
- Show/Hide each RSI
- Show/Hide each RSI Mid Level
- Adjustable Overbought, Oversold and Mid Levels values
I wrote this after my first script MTFSBB, because it's very useful to have BBs and RSIs together on a chart.
Calculating RERSIs will take some time, so be patient with it and feel free to use it.
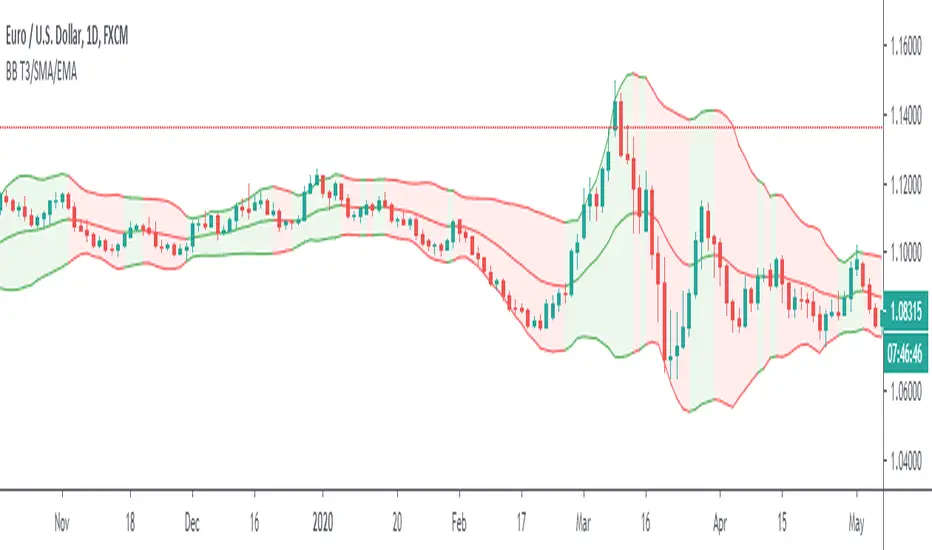
Bollinger Bands T3/SMA/EMAThis is Bollinger Bands script with an option to choose three different moving averages. The simple moving average is the original settings used by Mr Bollinger. Exponential is a popular choice as it adds more value to the recent price movements. T3 is a lot faster at adapting to the recent price. Compared to exponential, it gives even more value to the recent prices and furthermore, it is smoother. I use it to polish my True Range scripts.
Another upgrade is the ability to have a different colour of the channel when the baseline moves up or down.
Back to calculation? Is it better to use T3 with Bollinger? My opinion is that it depends on the trader. Both of them give you slightly different information and it is essential to look at the historical behaviour and answer for yourself. Will I use T3 calculation? Well, I built this script to find out if I want to.
Have a great trade!
Triple MA + EMA + SMMA + BBCombined multiple scripts under one script.
Great for Free account users. ;-)
This script contains:
Moving Average
Exponential Moving Average
Smoothed Moving Moving Average
Bollinger Bands

Overlay_set by HallyIt is a set of overlay indicators that combine 5 simple moving averages, Bollinger band, and clouds of Ichimoku cloud.
The reason I made this is because I want to make it easier to switch the display of the indicator when trading in a short time.
For example, if you double-click SMA, the setting dialog for this indicator opens. Immediately check the check box of the Bollinger you want to add and close the dialog.
You can quickly switch the display with this feeling and save the amount of mouse movement.
x0xXx0xx0xXx0xx0xXx0xx0xXx0xx0xXx0xx0xXx0xx0xXx0xx0xX
単純移動平均線5本と、ボリンジャー・バンド、一目均衡表の雲を1つにまとめたオーバーレイ系のインジケーターのセットです。
これを作った理由は短い時間でのトレードの際にインジケーターの表示を切り替えるのを楽にしたいからです。
たとえば、SMAをダブルクリックすればこのインジケーターの設定ダイアログが開くのですぐに追加表示したいボリンジャーのチェックボックスにチェックしてダイアログを閉じる。
という感じで素早く表示を切り替えることが出来き、マウスの移動量を節約できます。

BB Monitor IndicatorThis is a basic volatile indicator based in the Bollinger Bands that show the explosive market moves (up/down).
