Bollinger Bands Liquidity Cloud [ChartPrime]This indicator overlays a heatmap on the price chart, providing a detailed representation of Bollinger bands' profile. It offers insights into the price's behavior relative to these bands. There are two visualization styles to choose from: the Volume Profile and the Z-Score method.
Features
Volume Profile: This method illustrates how the price interacts with the Bollinger bands based on the traded volume.
Z-Score: In this mode, the indicator samples the real distribution of Z-Scores within a specified window and rescales this distribution to the desired sample size. It then maps the distribution as a heatmap by calculating the corresponding price for each Z-Score sample and representing its weight via color and transparency.
Parameters
Length: The period for the simple moving average that forms the base for the Bollinger bands.
Multiplier: The number of standard deviations from the moving average to plot the upper and lower Bollinger bands.
Main:
Style: Choose between "Volume" and "Z-Score" visual styles.
Sample Size: The size of the bin. Affects the granularity of the heatmap.
Window Size: The lookback window for calculating the heatmap. When set to Z-Score, a value of `0` implies using all available data. It's advisable to either use `0` or the highest practical value when using the Z-Score method.
Lookback: The amount of historical data you want the heatmap to represent on the chart.
Smoothing: Implements sinc smoothing to the distribution. It smoothens out the heatmap to provide a clearer visual representation.
Heat Map Alpha: Controls the transparency of the heatmap. A higher value makes it more opaque, while a lower value makes it more transparent.
Weight Score Overlay: A toggle that, when enabled, displays a letter score (`S`, `A`, `B`, `C`, `D`) inside the heatmap boxes, based on the weight of each data point. The scoring system categorizes each weight into one of these letters using the provided percentile ranks and the median.
Color
Color: Color for high values.
Standard Deviation Color: Color to represent the standard deviation on the Bollinger bands.
Text Color: Determines the color of the letter score inside the heatmap boxes. Adjusting this parameter ensures that the score is visible against the heatmap color.
Usage
Once this indicator is applied to your chart, the heatmap will be overlaid on the price chart, providing a visual representation of the price's behavior in relation to the Bollinger bands. The intensity of the heatmap is directly tied to the price action's intensity, defined by your chosen parameters.
When employing the Volume Profile style, a brighter and more intense area on the heatmap indicates a higher trading volume within that specific price range. On the other hand, if you opt for the Z-Score method, the intensity of the heatmap reflects the Z-Score distribution. Here, a stronger intensity is synonymous with a more frequent occurrence of a specific Z-Score.
For those seeking an added layer of granularity, there's the "Weight Score Overlay" feature. When activated, each box in your heatmap will sport a letter score, ranging from `S` to `D`. This score categorizes the weight of each data point, offering a concise breakdown:
- `S`: Data points with a weight of 1.
- `A`: Weights below 1 but greater than or equal to the 75th percentile rank.
- `B`: Weights under the 75th percentile but at or above the median.
- `C`: Weights beneath the median but surpassing the 25th percentile rank.
- `D`: All that fall below the 25th percentile rank.
This scoring feature augments the heatmap's visual data, facilitating a quicker interpretation of the weight distribution across the dataset.
Further Explanations
Volume Profile
A volume profile is a tool used by traders to visualize the amount of trading volume occurring at specific price levels. This kind of profile provides a deep insight into the market's structure and helps traders identify key areas of support and resistance, based on where the most trading activity took place. The concept behind the volume profile is that the amount of volume at each price level can indicate the potential importance of that price.
In this indicator:
- The volume profile mode creates a visual representation by sampling trading volumes across price levels.
- The representation displays the balance between bullish and bearish volumes at each level, which is further differentiated using a color gradient from `low_color` to `high_color`.
- The volume profile becomes more refined with sinc smoothing, helping to produce a smoother distribution of volumes.
Z-Score and Distribution Resampling
Z-Score, in the context of trading, represents the number of standard deviations a data point (e.g., closing price) is from the mean (average). It’s a measure of how unusual or typical a particular data point is in relation to all the data. In simpler terms, a high Z-Score indicates that the data point is far away from the mean, while a low Z-Score suggests it's close to the mean.
The unique feature of this indicator is that it samples the real distribution of z-scores within a window and then resamples this distribution to fit the desired sample size. This process is termed as "resampling in the context of distribution sampling" . Resampling provides a way to reconstruct and potentially simplify the original distribution of z-scores, making it easier for traders to interpret.
In this indicator:
- Each Z-Score corresponds to a price value on the chart.
- The resampled distribution is then used to display the heatmap, with each Z-Score related price level getting a heatmap box. The weight (or importance) of each box is represented as a combination of color and transparency.
How to Interpret the Z-Score Distribution Visualization:
When interpreting the Z-Score distribution through color and alpha in the visualization, it's vital to understand that you're seeing a representation of how unusual or typical certain data points are without directly viewing the numerical Z-Score values. Here's how you can interpret it:
Intensity of Color: This often corresponds to the distance a particular data point is from the mean.
Lighter shades (closer to `low_color`) typically indicate data points that are more extreme, suggesting overbought or oversold conditions. These could signify potential reversals or significant deviations from the norm.
Darker shades (closer to `high_color`) represent data points closer to the mean, suggesting that the price is relatively typical compared to the historical data within the given window.
Alpha (Transparency): The degree of transparency can indicate the significance or confidence of the observed deviation. More opaque boxes might suggest a stronger or more reliable deviation from the mean, implying that the observed behavior is less likely to be a random occurrence.
More transparent boxes could denote less certainty or a weaker deviation, meaning that the observed price behavior might not be as noteworthy.
- Combining Color and Alpha: By observing both the intensity of color and the level of transparency, you get a richer understanding. For example:
- A light, opaque box could suggest a strong, significant deviation from the mean, potentially signaling an overbought or oversold scenario.
- A dark, transparent box might indicate a weak, insignificant deviation, suggesting the price is behaving typically and is close to its average.
Cari dalam skrip untuk "bollingerband"

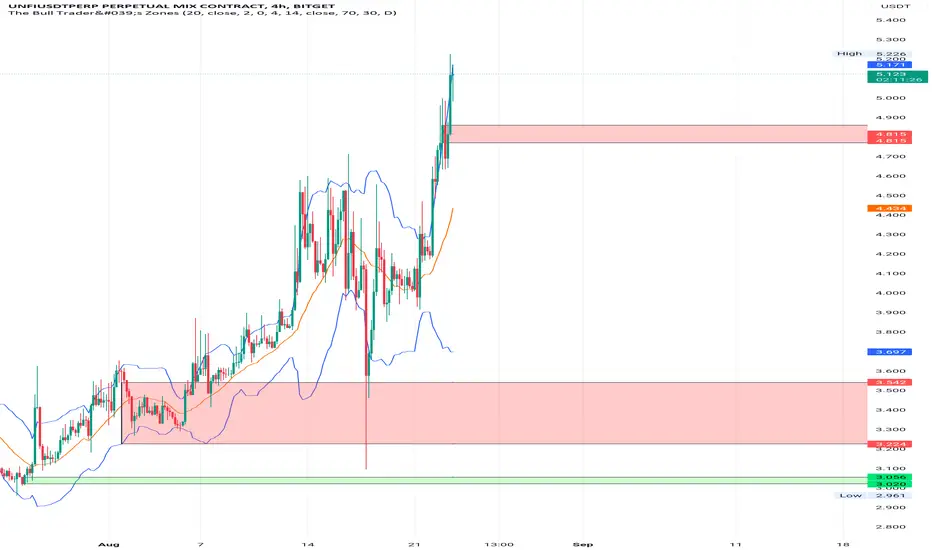
The Bull Trader's ZonesTBT Zones - Preferably used on the 4H chart. You should combine this script with other technical indicators as well.
In general the script helps find buy and sell opportunities early enough so as to make better decisions before taking a trade. Basically, it uses the rsi indicator, the long lower and long upper shadow candle sticks to create buy and sell zones.
The script is visibly engaging so one could easily know when the price is reverting into an Overbought or Sell zone after an uptrend, or reverting into an Oversold or Buy zone after an downtrend.
There is also the well known Bollinger Band Indicator, and it could be safer taking short trades when the price of the asset is above the Bollinger Basis, preferably close to the upper Bollinger Band. Vice-versa for long trades.
Adding the Camarilla L3 and H3 strategy could give an edge. Respecting the zones, if the open price is between H3 and L3;
BUY when the price moves back above L3 after going below L3. Target will be H1, H2, H3 levels. Stop loss can be placed at L4 level. Or trail an SL,
SELL when the price moves back below H3 after going above H3. Target will be L1,L2 L3 levels and stop loss above H4. Or trail an SL. Or simply take realistic profits.
By default the zones will extend left (back in history) which could give a view on how the zone previously performed. This option could be unchecked in the options. However, information on past performance is not necessarily a guide to future performance. Trade safe. Get out on time. Wait for another opportunity to set up.
When you add this indicator to your chart you can set up alerts to be informed when a new zone is formed.
Much thanks to @cyatophilum, the pinescript coder who made this a reality.
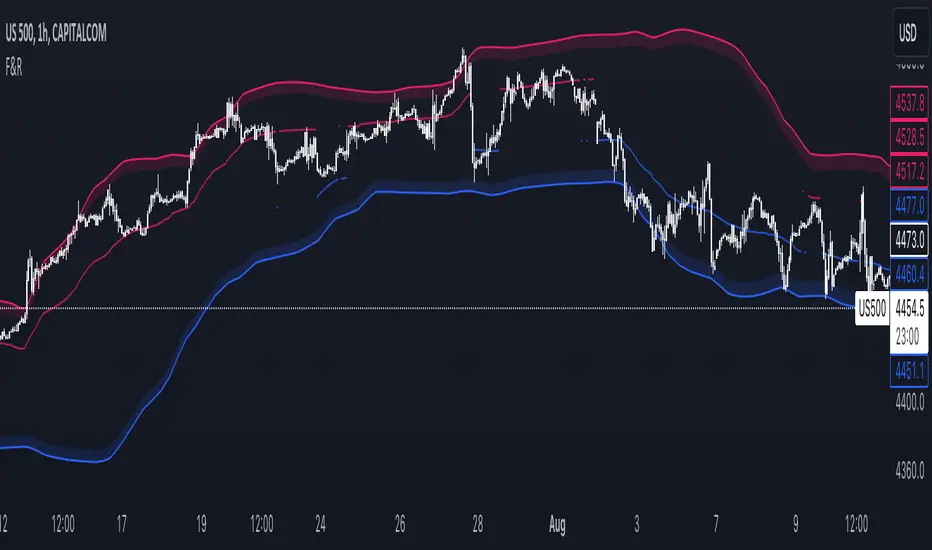
Floor and Roof IndicatorThe Floor and Roof indicator is a tool developed to help traders identify potential areas of support and resistance both for trend following and for mean reversal trading decisions.
The indicator plots the "Roof" which is the main level of resistance, and the "Floor" which is the main level of support. These lines are calculated on the "Lenght" parameter and smoothed by the "Smooth" parameter, and they use both the volatility and the main market structure as calculation methods.
Additionally, this indicator plots an area that can be modified by the "Zone width" parameter and two other lines, called "Second floor" and "Second roof" respectively, which are plotted only whenever they are significant to the price current level.
This indicator can be used in several ways:
- In a clear trend, you could wait for a break of the second floor or roof as an indication of a change in the market direction
- As the price goes out of the reversal zones, this can be an indication of a reversal
- In a clear trend, you can wait for the price to bounce on the second floor or roof lines to enter a trade
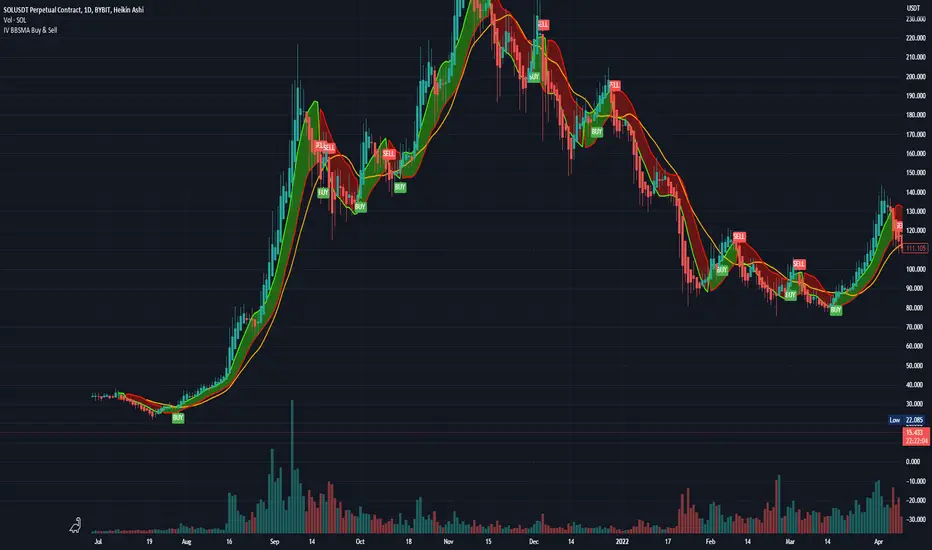
DBMA - Dual Bollinger Moving AverageThe Dual Bollinger moving average (DBMA) consists of a moving average (MA) & two Bollinger Bands (BB), with the color of the bands representing the level of price compression. In its default settings, it is a 20-day simple moving average with 2 upper Bollinger Bands, having the standard deviation (SD) settings of 0.5 & 1, respectively.
How close the price is to the moving average?
For a pullback trader, the entry point should be close to the moving average, preferably with price compression. How close should it be, is where the bands serve as a guide. The low of the pullback candle should be within the bands, that is, at least within the far band (1 SD of the MA), or even better if it's within the near band (0.5 SD). When the price is outside the bands, it should not be considered favourable for a pullback entry.
For how long has the price been closer to the moving average?
John Carter’s TTM Squeeze indicator looked at the relationship between Bollinger Bands and Keltner's Channels to help identify period of volatility contractions. Bollinger Bands being completely enclosed within the Keltner Channels is indicative of a very low volatility. This is a state of volatility contraction known as squeeze. Using different ATR lengths (1.0, 1.5 and 2.0) for Keltner Channels, we can differentiate between levels of squeeze (High, Mid & Low compression, respectively). Greater the compression, higher the potential for explosive moves.
The squeeze portion of the script is based on LazyBear's script ( Squeeze Momentum Indicator )
The High, Mid & Low compression squeezes are depicted via the color of the bands being red, orange, or yellow, respectively. With the low of the pullback candle within the bands, & the squeeze color changing to red, it should be considered favourable for a pullback entry.
Trailing the price with the lower bands
The lower bands can be used for trailing with the moving average. While trailing, once the price closes below the moving average, the trailing stoploss (TSL) is said to be triggered, & the trade is exited. Here we use the bands to give it some cushion. Let the price close below the 1SD band for labelling the TSL as being triggered to exit the trade. If the price closes below the MA but is still within the bands, the signal is to keep holding the trade.

Extreme Reversal SignalThe Extreme Reversal Signal is designed to signal potential pivot points when the price of an asset becomes extremely overbought or oversold. Extreme conditions typically signal a brief or extensive price reversal, offering valuable entry or exit points. It's important to note that this indicator may produce multiple signals, making it essential to corroborate these signals with other forms of analysis to determine their validity. While the default settings provide valuable insights, it might be beneficial to experiment with different configurations to ensure the indicator's efficacy.
Two primary conditions define extremely overbought and oversold states. The first condition is that the price must deviate by two standard deviations from the 20-day Simple Moving Average (SMA). The second condition is that the 3-day SMA of the 14-day Stochastic Oscillator (STO) derived from the 14-day Relative Strength Index (RSI) is above or below the upper or lower limit.
Oversold states arise when the first condition is met and the 3-day SMA of the 14-day Stochastic RSI falls below the lower limit, suggesting a buy signal. These are visually represented by green triangles below the price bars. Overbought states arise when the first condition is met and the 3-day SMA of the 14-day Stochastic RSI rises above the upper limit, suggesting a sell signal. These are visually represented by red triangles above the price bars. It's also possible to set up automated alerts to get notifications when either of these two conditions is met to avoid missing out.
While this indicator has traditionally identified overbought and oversold conditions in various different assets, past performance does not guarantee future results. Therefore, it is advisable to supplement this indicator with other technical tools. For instance, trend indicators can greatly improve the decision-making process when planning for entries and exit points.

Reversion Zone IndexThe Reversion Zone Index (RZI) is an indicator that combines the Commodity Channel Index (CCI), Choppiness Index (CI), and Bollinger Bands Percentage (BBPct) to identify mean reversion signals in the market. It is plotted as an Exponential Moving Average (EMA) smoothed oscillator with overbought and oversold zones, and mean reversion signals are represented by red and green arrows.
The three indicators are combined to benefit from their complementary aspects and create a more comprehensive view of mean reversion conditions. Here's a brief overview of each indicator's benefits:
1. Commodity Channel Index (CCI): CCI measures the current price level relative to its average over a specified period. It helps identify overbought and oversold conditions, as well as potential trend retracements. By incorporating CCI, the RZI gains insights into momentum and potential turning points.
2. Choppiness Index (CI): CI quantifies the market's choppiness or trendiness by analyzing the range between the highest high and lowest low over a specific period. It indicates whether the market is in a trending or ranging phase. CI provides valuable information about the market state, which can be useful in mean reversion analysis.
3. Bollinger Bands Percentage (BBPct): BBPct measures the current price's position relative to the Bollinger Bands. It calculates the percentage difference between the current price and the bands, identifying potential overbought or oversold conditions. BBPct helps gauge the market's deviation from its typical behavior and highlights potential reversal opportunities.
The RZI combines the three indicators by taking an average of their values and applying further calculations. It smooths the combined oscillator using an EMA to reduce noise and enhance the visibility of the trends. Smoothing with EMA provides a more responsive representation of the overall trend and helps filter out short-term fluctuations.
The overbought and oversold zones are marked on the chart as reference levels. When the combined oscillator is above the overbought zone or below the oversold zone, it suggests a potential mean reversion signal. Red and green arrows are displayed to visually indicate these mean retracement signals.
The RZI is a valuable tool for identifying mean reversion opportunities in the market. It incorporates multiple indicators, each providing unique insights into different aspects of mean reversion, such as momentum, volatility, and price positioning. Traders can use this indicator to spot potential turning points and time their trades accordingly.

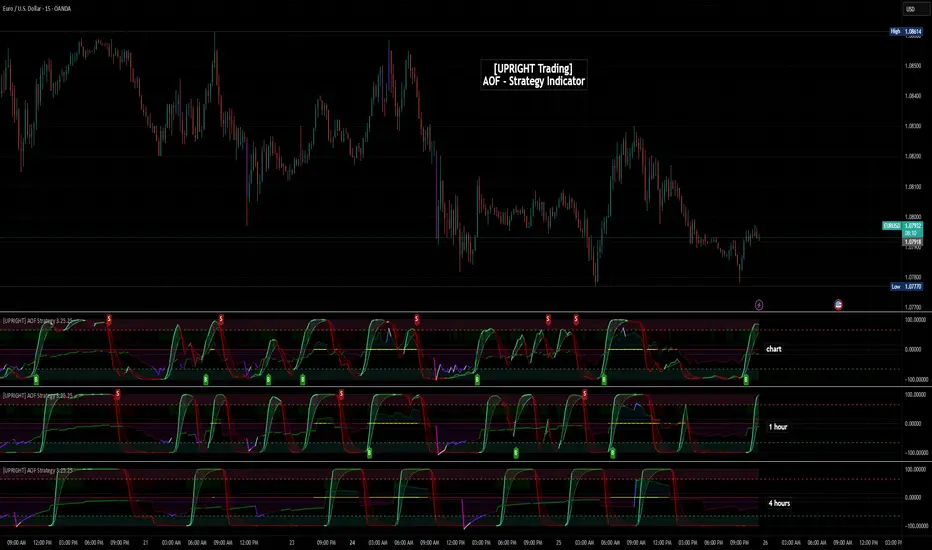
[UPRIGHT Trading] Academy of Forex - Scalp Strategy█ OVERVIEW
This is a collaboration of efforts of The Academy of Forex and UPRIGHT Trading .
The Academy of Forex - Scalp Strategy Indicator is a clean & reimagined lower indicator. To enable optimization & potential automation, we re-coded & optimized it at UPRIGHT Trading.
It is based on the one presented on its YT channel.
The idea is for it to be an easy to use - simple indicator - that works not just for confirmation, but also entering and exiting quickly (scalping).
█ CONCEPTS
The idea is that %B (derived from BBs) is able to pick up some pretty significant moves. With that as one of the bases the Inverse Fisher Transform (Ribbon) acts to show some of the movement of the asset highlighting when it at extremes. The RSI highlights are there as another confirmation to help normalize the sometimes too frequent movement of %B.
As expected the indicator often acts as a reversal indicator, but with the optimizations of logic it's able to pick up more than just the reversals and works as a pretty decent Buy/Sell Algorithm.
█ CALCULATIONS
Calculations used included, but not limited to:
- %B - Quantifies the price as a percentage to the Upper and Lower Band of the Popular Bollinger Bands, which were named after their inventor John Bollinger in 1980.
- Inverse Fisher Transform RSI - is a variation of the IFT, created by John Ehlers, the idea is for the IFT to convert Gaussian normal distribution and to take it a step further the RSI version is to just use overbought and oversold placements. This indicator is meant to highlight when price has moved to an extreme and in this process helps to spot turning points.
- Relative Strength Index (RSI) - As most of you know already the RSI is a technical analysis tool invented by J. Welles Wilder, that oscillates and is used to measure the momentum of price changes. It normalizes to index 0-100 with overbought and oversold defined by the user, but often around 70 as overbought and 30 as oversold.
- Pivot/Swing Points - Implemented to show recent Higher-Highs or Lower-Lows, Pivot points are included in the indicator for structure tracking.
- Moving Averages - Moving averages help to get an idea of when price is moving near the norm or outside to extremes.
█ FEATURES
Indicator Features:
-2 Buy/Sell Signals.
-U Signals (UPRIGHT optimized).
-Exit Reminders.
-Alerts allowing Automation of Scalp Strategy.
-H/L Swings.
-Color Customization.
-Clean Mode.
-Inverse Fisher Transform Ribbon.
-RSI Bullish/Bearish Highlights.
-Options for More Signals (including: Oversold/Overbought Circles, %B Bull/Bear Squares and Triangles, and IFT Highlights).
Showing some of the signals close up.
Should look like this:
Enjoy!
Sincerely,
Mike
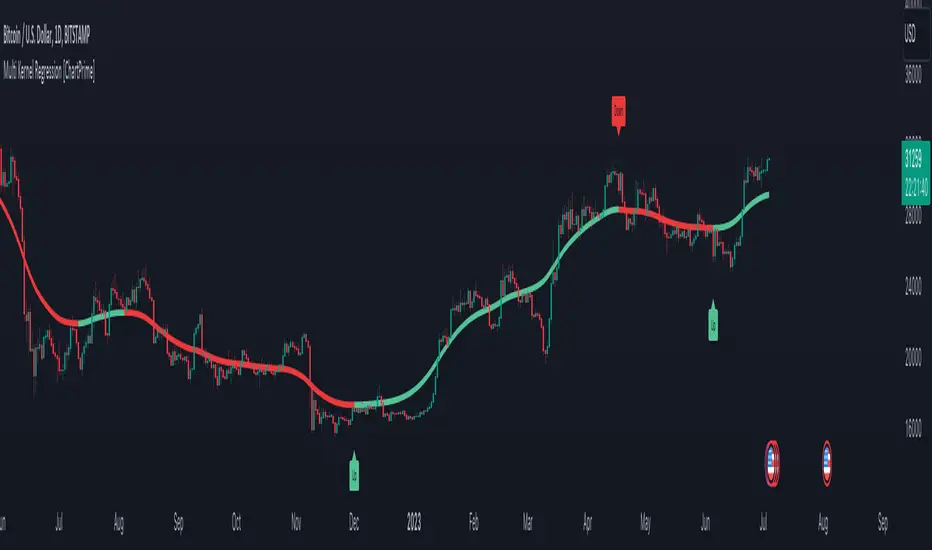
Multi Kernel Regression [ChartPrime]The "Multi Kernel Regression" is a versatile trading indicator that provides graphical interpretations of market trends by using different kernel regression methods. It's beneficial because it smoothes out price data, creating a clearer picture of price movements, and can be tailored according to the user's preference with various options.
What makes this indicator uniquely versatile is the 'Kernel Select' feature, which allows you to choose from a variety of regression kernel types, such as Gaussian, Logistic, Cosine, and many more. In fact, you have 17 options in total, making this an adaptable tool for diverse market contexts.
The bandwidth input parameter directly affects the smoothness of the regression line. While a lower value will make the line more sensitive to price changes by sticking closely to the actual prices, a higher value will smooth out the line even further by placing more emphasis on distant prices.
It's worth noting that the indicator's 'Repaint' function, which re-estimates work according to the most recent data, is not a deficiency or a flaw. Instead, it’s a crucial part of its functionality, updating the regression line with the most recent data, ensuring the indicator measurements remain as accurate as possible. We have however included a non-repaint feature that provides fixed calculations, creating a steady line that does not change once it has been plotted, for a different perspective on market trends.
This indicator also allows you to customize the line color, style, and width, allowing you to seamlessly integrate it into your existing chart setup. With labels indicating potential market turn points, you can stay on top of significant price movements.
Repaint : Enabling this allows the estimator to repaint to maintain accuracy as new data comes in.
Kernel Select : This option allows you to select from an array of kernel types such as Triangular, Gaussian, Logistic, etc. Each kernel has a unique weight function which influences how the regression line is calculated.
Bandwidth : This input, a scalar value, controls the regression line's sensitivity towards the price changes. A lower value makes the regression line more sensitive (closer to price) and higher value makes it smoother.
Source : Here you denote which price the indicator should consider for calculation. Traditionally, this is set as the close price.
Deviation : Adjust this to change the distance of the channel from the regression line. Higher values widen the channel, lower values make it smaller.
Line Style : This provides options to adjust the visual style of the regression lines. Options include Solid, Dotted, and Dashed.
Labels : Enabling this introduces markers at points where the market direction switches. Adjust the label size to suit your preference.
Colors : Customize color schemes for bullish and bearish trends along with the text color to match your chart setup.
Kernel regression, the technique behind the Multi Kernel Regression Indicator, has a rich history rooted in the world of statistical analysis and machine learning.
The origins of kernel regression are linked to the work of Emanuel Parzen in the 1960s. He was a pioneer in the development of nonparametric statistics, a domain where kernel regression plays a critical role. Although originally developed for the field of probability, these methods quickly found application in various other scientific disciplines, notably in econometrics and finance.
Kernel regression became really popular in the 1980s and 1990s along with the rise of other nonparametric techniques, like local regression and spline smoothing. It was during this time that kernel regression methods were extensively studied and widely applied in the fields of machine learning and data science.
What makes the kernel regression ideal for various statistical tasks, including financial market analysis, is its flexibility. Unlike linear regression, which assumes a specific functional form for the relationship between the independent and dependent variables, kernel regression makes no such assumptions. It creates a smooth curve fit to the data, which makes it extremely useful in capturing complex relationships in data.
In the context of stock market analysis, kernel regression techniques came into use in the late 20th century as computational power improved and these techniques could be more easily applied. Since then, they have played a fundamental role in financial market modeling, market prediction, and the development of trading indicators, like the Multi Kernel Regression Indicator.
Today, the use of kernel regression has solidified its place in the world of trading and market analysis, being widely recognized as one of the most effective methods for capturing and visualizing market trends.
The Multi Kernel Regression Indicator is built upon kernel regression, a versatile statistical method pioneered by Emanuel Parzen in the 1960s and subsequently refined for financial market analysis. It provides a robust and flexible approach to capturing complex market data relationships.
This indicator is more than just a charting tool; it reflects the power of computational trading methods, combining statistical robustness with visual versatility. It's an invaluable asset for traders, capturing and interpreting complex market trends while integrating seamlessly into diverse trading scenarios.
In summary, the Multi Kernel Regression Indicator stands as a testament to kernel regression's historic legacy, modern computational power, and contemporary trading insight.
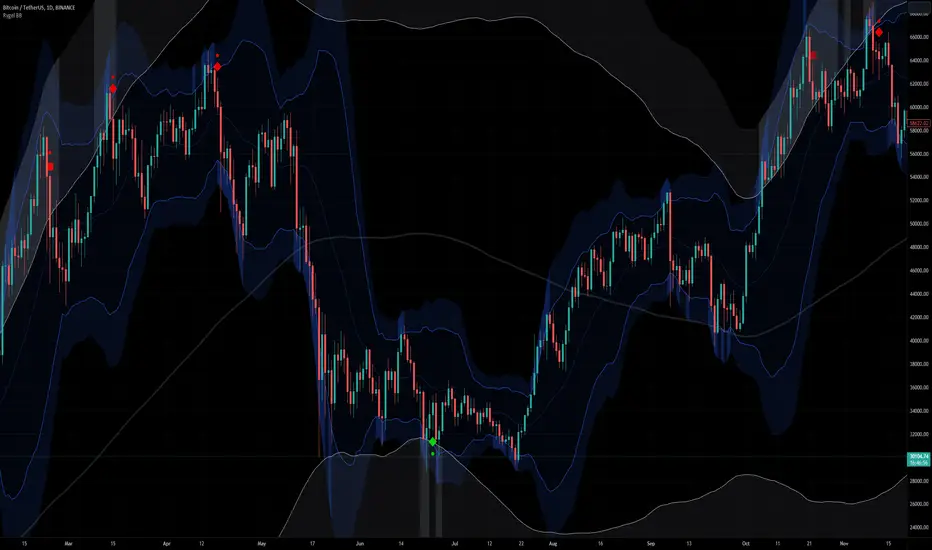
[Rygel] Dual time frame Bollinger Bands with signals and alertsThis indicator displays two Bollinger Bands coming from two different time frames, chart's current one and a higher one.
It analyzes these two Bollinger Bands data and combines them with RSI, MFI and MACD divergences and SuperTrend to identify areas of opportunity where price is the most likely to be at a local top or bottom.
It uses probabilistic data, the Bollinger Bands, to identify convergence areas where the price is statistically overbought or oversold simultaneously at two different time frames, it then looks for signs of a trend exhaustion, using RSI, MFI and MACD divergences, and finally it looks for an early confirmation of a trend reversal, using SuperTrend data with aggressive settings.
This indicator does not produce buy and sell signals. You won't get a buy for every sell or a sell for every buy. In a bearish trend, you may get multiple consecutive bullish signals and in a bullish trend multiple bearish signals.
It is meant to help you to identify and to alert you about areas of opportunity where you could, for instance, consider taking some profits or opening a trade.
It is meant to support your investment or trading decisions, not to induce them.
SIGNALS
This indicator generated multiple types of signals. Diamonds are better than squares. Colored ones are better than grey ones.
Green square: a bullish signal confirmed by a regular divergence
Red square: a bearish signal confirmed by a regular divergence
Blue square: a bullish signal confirmed by a hidden divergence (disabled by default as these signals are less reliable)
Orange square: a bearish signal confirmed by a hidden divergence (disabled by default as these signals are less reliable)
Diamonds: same as the square signals but the signal is forming a divergence with a previous one. Diamond signals are always stronger (i.e. more reliable) than square signals.
Grey signals: same as the previous ones but for weaker signals. These signals appear when price in the current time frame is overbought or oversold but only close to be at the higher timeframe. (disabled by default as these signals are less reliable)
When a weak signal follows a strong one and creates a MACD divergence with it, it will be considered as a strong signal and displayed as a colored signal, even when weak signals are disabled.
When a strong signal follows a weak one, forming a MACD divergence, it will be shown as a diamond signal, even when weak signals are disabled.
Most reliable signals are green and red diamonds.
SETTINGS
Bollinger Bands
Source: the source used to calculate the Bollinger Bands ("close" by default)
Length: the moving-average length of the Bollinger Bands (20 by default)
You will most likely have no need to change these settings. If you're wondering what they actually do, you should most likely not touch them.
Main channel standard deviation: the standard deviation used to calculate the classical Bollinger Bands channel. (2.0 by default)
Outer bands standard deviation: additional channels outside the main one, using a larger standard deviation. (3.0 by default)
Theoretically, with a 1.0 standard deviation, around 68% of the price action should be contained within the Bollinger Bands.
With a 2.0 standard deviation, around 95%.
With a 3.0 standard deviation, around 99.7%.
With a 4.0 standard deviation, around 99.99%.
But as security prices returns have no actual statistical distribution, these probabilities don't strictly apply to Bollinger Bands. According to Wikipedia, studies have found that with a 2.0 standard deviation, only about 88% (85–90%) of the price data remain with the Bollinger Bands, instead of the theoretical 95%.
The higher you set the values, the less signals you'll get.
You should most likely keep the main channel standard deviation between 2 and 3 and add between +0.5 and +1 for the outer bands.
Most commonly used value for Bollinger Bands is 2.0.
Current time frame
Show current time frame Bollinger Bands: these are the Bollinger Bands you're used to. (enabled by default)
Show current time frame outer bands: add two additional bands outside the main channel using a larger standard deviation. (enabled by default)
Higher time frame
Show higher time frame Bollinger Bands: display secondary Bollinger Bands from a higher time frame. Time frames are configured in the below "Time frames" section. (enabled by default)
Show higher time frame outer bands: add two additional bands outside the main channel using a larger standard deviation (enabled by default)
Overbought and oversold
Show oversold and overbought background: add a background to the higher time Bollinger Bands whose color depends on the dual time frame Bollinger Bands oversold / overbought status. (enabled by default)
Asset is considered overbought/oversold when its price is outside of the Bollinger Bands' main channel.
Asset is considered strongly overbought/oversold when its price is outside of the Bollinger Bands' outer bands.
Dark red: both time frame are overbought (outside the main channel)
Red: one time frame is strongly overbought (outside the outer bands) and the other one is overbought (outside the main channel)
Bright red: both time frame are strongly overbought (outside the outer bands)
Dark green: both time frame are oversold (outside the main channel)
Green: one time frame is strongly oversold (outside the outer bands) and the other one is oversold (outside the main channel)
Bright green: both time frame are strongly oversold (outside the outer bands)
Signals
Show signals: display signals when an area of opportunity is detected. Read the introduction and the Signals section for more information. (enabled by default)
Show weak signals: display signals although at the higher time frame price is not yet overbought or oversold but close to be (disabled by default)
Divergences
Use MACD for divergences (enabled by default)
Use MFI for divergences (enabled by default)
Use RSI for divergences (enabled by default)
At least one source of divergences must be enabled for signals to work.
Enable hidden divergences: signals don't use hidden divergences by default as they generate more false positives than regular divergences. You can enable them to get more signals, it can be especially useful at high time frames (like weekly, monthly, etc.) where signals are rarer. (disabled by default)
Show divergences: draw MACD, MFI and RSI divergences on the chart. (disabled by default)
Green: regular bullish divergence
Red: regular bearish divergence
Blue: hidden bullish divergence
Orange: hidden bearish divergence
Confirmation
Confirmation speed: a faster confirmation speed will generate more false positive signals, a slower one will produce delayed but more reliable signals.
Fastest: don't wait for a SuperTrend confirmation, only wait for a divergence confirmation. Lot of false positives.
Fast: wait for a fast SuperTrend confirmation (SuperTrend factor = 1).
Medium: wait for a slower but more reliable SuperTrend confirmation (SuperTrend factor = 2). Fewer false positives but more lagging signals.
Slow: wait for an even slower but very reliable SuperTrend confirmation (SuperTrend factor = 3). Very few false positives but very late signals.
Time frames
You can define the higher time frames you wish to use here.
Default values try to adhere to a x6 to x8 ratio, x4 to x12 at maximum.
Some pairs are more significant than others, like 4 hour + daily, daily + weekly and weekly + monthly.
1 second: 10 seconds
5 seconds: 30 seconds
10 seconds: 1 minute
15 seconds: 2 minutes
30 seconds: 3 minutes
1 minute: 10 minutes
2 minutes: 15 minutes
3-4 minutes: 30 minutes
5-9 minutes: 45 minutes
10-11 minutes: 1 hour
12-14 minutes: 1 hour
15-29 minutes: 2 hours
30-44 minutes: 4 hours
45-59 minutes: 6 hours
1 hour: 8 hours
2 hours: 12 hours
3 hours: 1 day
4-5 hours: 1 day
6-7 hours: 2 days
8-11 hours: 3 days
12-23 hours: 4 days
1 day: 1 week
2 days: 2 weeks
3 days: 3 weeks
4 days: 1 month
5 days: 1 month
6 days: 1 month
1 week: 1 month
2 weeks: 2 months
3 weeks: 3 months
1 month: 6 months
2 months: 9 months
3 months: 12 months
4 months: 15 months
5 months: 21 months
6 months: 24 months
Time frames use the TradingView units:
s = seconds
h = hours
D = days
W = weeks
M = months
no unit = minutes
Time frame strings follow these rules:
They are composed of the multiplier and the time frame unit, e.g., “1S”, “30” (30 minutes), “1D” (one day), “3M” (three months).
The unit is represented by a single letter, with no letter used for minutes: “S” for seconds, “D” for days, “W” for weeks and “M” for months.
When no multiplier is used, 1 is assumed: “S” is equivalent to “1S”, “D” to “1D, etc. If only “1” is used, it is interpreted as “1min”, since no unit letter identifier is used for minutes.
There is no “hour” unit; “1H” is not valid. The correct format for one hour is “60” (remember no unit letter is specified for minutes).
The valid multipliers vary for each time frame unit:
- For seconds, only the discrete 1, 5, 10, 15 and 30 multipliers are valid.
- For minutes, 1 to 1440.
- For days, 1 to 365.
- For weeks, 1 to 52.
- For months, 1 to 12.
Styles
You can configure the appearance of the Bollinger Bands, the overbought / oversold background, the divergences and the signals here.
Advanced - MACD
Settings used for the MACD divergences. You most likely won't need to change these values, especially if you need them to be explained.
Advanced - MFI
Settings used for the MACD divergences. You most likely won't need to change these values, especially if you need them to be explained.
Advanced - RSI
Settings used for the MACD divergences. You most likely won't need to change these values, especially if you need them to be explained.
Advanced - SuperTrend
Settings used for the MACD divergences. You most likely won't need to change these values, especially if you need them to be explained.
ALERTS
Any signal: a bullish or bearish signal has been detected.
Bullish signal: a bullish signal has been detected.
Bullish signal with divergence: a bullish signal forming a divergence with a previous bullish signal has been detected.
Bearish signal: a bearish signal has been detected.
Bearish signal with divergence: a bearish signal forming a divergence with a previous bearish signal has been detected.
Overbought/oversold = asset price is outside of the Bollinger Bands' main channel.
Strongly overbought/oversold = asset price is outside of the Bollinger Bands' outer bands.
Current time frame - Entering overbought: asset is now overbought at the current time frame.
Current time frame - Exiting overbought: asset is not overbought anymore at the current time frame.
Current time frame - Entering strongly overbought: asset is now strongly overbought at the current time frame.
Current time frame - Exiting strongly overbought: asset is not strongly overbought anymore at the current time frame.
Current time frame - Entering oversold: asset is now oversold at the current time frame.
Current time frame - Exiting oversold: asset is not oversold anymore at the current time frame.
Current time frame - Entering strongly oversold: asset is now strongly oversold at the current time frame.
Current time frame - Exiting strongly oversold: asset is not strongly oversold anymore at the current time frame.
Higher time frame - Entering overbought: asset is now overbought at the higher time frame.
Higher time frame - Exiting overbought: asset is not overbought anymore at the higher time frame.
Higher time frame - Entering strongly overbought: asset is now strongly overbought at the higher time frame.
Higher time frame - Exiting strongly overbought: asset is not strongly overbought anymore at the higher time frame.
Higher time frame - Entering oversold: asset is now oversold at the higher time frame.
Higher time frame - Exiting oversold: asset is not oversold anymore at the higher time frame.
Higher time frame - Entering strongly oversold: asset is now strongly oversold at the higher time frame.
Higher time frame - Exiting strongly oversold: asset is not strongly oversold anymore at the higher time frame.
Dual time frame - Entering overbought: asset is now overbought at current and higher time frames.
Dual time frame - Exiting overbought: asset is not overbought anymore at current and higher time frames.
Dual time frame - Entering oversold: asset is now oversold at current and higher time frames.
Dual time frame - Exiting oversold: asset is not oversold anymore at current and higher time frames.
Dual time frame - Entering strongly overbought: asset is now strongly overbought at current and higher time frames.
Dual time frame - Exiting strongly overbought: asset is not strongly overbought anymore at current and higher time frames.
Dual time frame - Entering strongly oversold: asset is now strongly oversold at current and higher time frames.
Dual time frame - Exiting strongly oversold: asset is not strongly oversold anymore at current and higher time frames.
ABOUT THE HIGHER TIME FRAME BOLLINGER BANDS
Using a classical higher time frame Bollinger Bands would produce lagging data. For instance, if we are using a weekly BB at the daily time frame, we'll have to wait up to 7 days for the weekly bar to close to get the actual final weekly BB values. Instead, this indicator generates real time higher time frame Bollinger Bands by multiplying the moving average length of the Bollinger Bands by the higher time frame / current time frame ratio. For instance, a weekly BB in the daily time frame will use a x7 ratio (i.e. a 20 * 7 = 140 days MA BB).
It produces slightly different but very similar bands that are as meaningful and can be used in real time at lower time frames.
Alternatives would have been to wait up to seven days for signals to be finalized, which would have render them meaningless. Or to use previous week data, which would have made the signal inaccurrate.
To sum up, weekly Bollinger Bands use a 20 weeks moving average updated one time a week. In the daily time frame, this indicator also use a 20 weeks (140 days) moving average but updated daily instead of weekly.
A comparison between a traditional higher time frame Bollinger Bands vs the ones used by this indicator:
Blue and orange lines are the actual weekly BBs, grey ones are the daily updated ones.
ABOUT THE DIVERGENCES
This indicator uses the same divergences algorithm as my other indicators:
- RSI with divergences
- MACD with divergences
- Trend Reversal Indicator
You'll find more information about this algorithm on my RSI page.
Bollinger Bands Lab - by InFinitoVariation of the Moving Average Lab that includes Bollinger Bands functionality for any manually created Moving Average. It includes:
- Standard Deviations for any MA
- Fixed Symmetrical Deviations for any MA that remain at a constant % away from the MA
- The same Moving Average creation settings from the Moving Average Lab
"The Moving Average Lab allows to create any possible combination of up to 3 given MAs. It is meant to help you find the perfect MA that fits your style, strategy and market type.
This script allows to average, weight, double and triple multiple types and lengths of Moving Averages
Currently supported MA types are:
SMA
EMA
VWMA
WMA
SMMA (RMA)
HMA
LSMA
DEMA
TEMA
Features:
- Double or Triple any type of Moving Average using the same logic used for calculating DEMAs and TEMAs
- Average 2 or 3 different types and lengths of Moving Average
- Weight each MA manually
- Average up to 3 personalized MAs
- Average different Moving Averages with different length each "
The preview screenshot shows:
- The combination of:
- 200 LSMA - Weight: 1
- 200 HMA - Weight: 2
- 200 VWMA - Weight: 1 - Double
- The regular Bollinger Band setting, 2 standard deviations
- Two fixed symmetrical deviations at 15% and 20% away from the XMA
Bollinger Bands and SMA Channel Buy and Sell
This Indicator is a combination of a standard BB indicator incorporated with a SSL Channel by ErwinBeckers which is Simple Moving average with a length of set at 10 (Default) and calculates the high and low set for the default 10 to form a Channel.
The Settings for the Bollinger Band is the standard settings on a normal Bollinger Band - Length 20, source close and Standard dev 2
The setting for the SMA is length 10 and the high and low calculated or that length to form a channel.
The SMA Channel gives a green line for the Up channel and the Red line for the down Channel.
The basis of the indicator is that the Candle close above the Basis line of the BB and the SMA green line will give a buy indicator
and the same for Sell indicator the candle close below the basis BB and the SMA line Red will give a Sell indicator.
Please note that this indicator is a mix of 2 basic indicators found in Trading view, giving Buy and Sell indicators to make things easier to not look for this visually.
This code will be open source for anyone to use or back test or use it for whatever they want.
This code is for my own personal trading and cannot be relied upon. This indicator cannot be used and cannot guarantee anything, and caution should always be taken when trading. Use this with other indicators to give certanty.
Again use this for Paper Trading only.
I want to thank TradingView for its platform that facilitates development and learning.
TTP VIX SpyTTP VIX Spy is an indicator that uses data from TVC:VIX to better time entries in the market.
The assumption used is that when the VIX is coming down from the top of its range then the risk on assets can move to the upside and when the VIX is is pushing higher there's a high likelihood or risk on assets going down.
This indicator observes the momentum of VIX using MACD. It offers two different signals both for longs and shorts: signal 1 and 2.
Signal 1 is activate when the begging of a new trend for the VIX is confirmed.
Signal 2 is activated when the VIX pulls back from an extreme value.
You can configure the parameters of the internal super trend and the look back for the slope applied to price and RSIs.
The indicator offers the following filter parameters:
- Price RSI slope: it filters signals that have RSI slope pointing in the opposite direction of the signal.
- Counter trend: it filters signals that are not counter trending super trend.
- Wide BBW: it filters signals that happen when there hasn't been high price volatility
- Price slope: it filters signals when the price is not pointing in the direction of the signal (buy: up, sell: down)
- VIX RSI filter: it filters VIX RSI values overextended. MACD can be in the right range, but sometimes RSI contradicts it. By default is OFF since it can cause false negatives.
- Working days only: it filters signals that occur in the weekend.
The colours below the price action show how the VIX momentum is changing. Transitions from red into pink and then green show how the fear is fading which tends to lead to lead to bullish moves, and the opposite when the transitions are from green to red.
Performance and initial thoughts.
I have tried VIX Spy on both BINANCE:BTCUSDT.P and BINANCE:ETHUSDT.P and it seems to offer a decent win ratio. As you can see I had to add many filter to remove bad entries and left toggles available to decide which ones you want to use.
I tried the signal in the 4H, 1H and 15min with mixed results. I tend to incline for the results in the 1H.
VIX signal offers a backtestable stream and alerts both for signals 1 and 2.

Damage Indicator by Scipio ProScipio Pro's Damage Indicator detects strong momentum on tops and bottoms. It is intended for swing trading.
The script analyzes both recent and less-recent price action and performs candle stick analysis. It also uses SDs and multiple Bollinger Bands to find dynamic levels for entries.
A Bears Damaged signal emerges whenever there is convincing proof of strength at a bottom. Often, when the market reverses quickly, traders are caught offside and are forced to buy higher. The reverse goes for Bulls Damaged signals, which mean there is convincing proof of bearish strength at a (local?) top.
Whether the move gets legs depends in large part on the structure in which the show of momentum takes place. It is sensible to wonder after each signal whether the market structure (and other relevant context such as the majority of cash having been sidelined) dictates that risk-reward is skewed to the upside or to the downside. If, for example, a Bears Damaged signal emerges on the daily and risk-reward on the weekly is skewed to the upside, go 4x larger (again, just an example). If, on the other hand, the same signal emerges on the daily while the risk-reward is skewed to the downside on the weekly, bet much smaller and tighten your stop-loss. For best results, I suggest you always check one timeframe higher for your long-term risk-reward bias. (No financial advice, of course.)
Under Settings you'll find the so-called Noise Protection , which is switched "on" by default. We recommend you keep this switched on. Noise Protection ensures you do not see Damage signals on timeframes lower than the 4 hour. After all, chasing momentum on low timeframes is a losing game. The amount of noise increases exponentially as you move lower down the timeframes. Again, this indicator is for swing trades. Don't use it for scalping.
It should be useful for all assets, but is of course more useful on some than on others. As with all indicators, signals tend to be more meaningful if the asset in question is at least somewhat liquid, for instance.
As always, use at your own risk. Using indicators is no substitute for using one's brain.

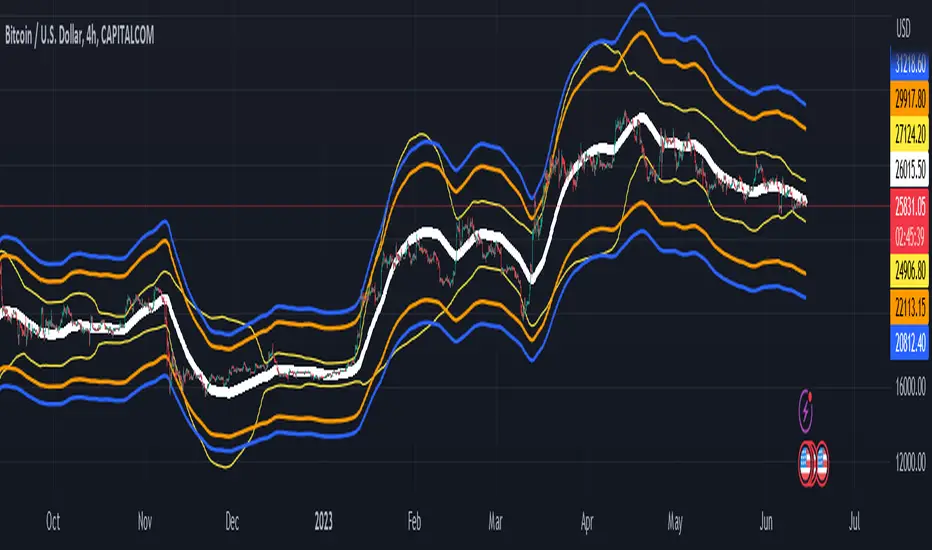
Probability Envelopes (PBE)Introduction
In the world of trading, technical analysis is vital for making informed decisions about the future direction of an asset's price. One such tool is the use of indicators, mathematical calculations that can help traders predict market trends. This article delves into an innovative indicator called the Probability Envelopes Indicator, which offers valuable insights into the potential price levels an asset may reach based on historical data. This in-depth look explores the statistical foundations of the indicator, highlighting its key components and benefits.
Section 1: Calculating Price Movements with Log Returns and Percentages
The Probability Envelopes Indicator provides the option to use either log returns or percentage changes when calculating price movements. Each method has its advantages:
Log Returns: These are calculated as the natural logarithm of the ratio of the current price to the previous price. Log returns are considered more stable and less sensitive to extreme price fluctuations.
Percentage Changes: These are calculated as the percentage difference between the current price and the previous price. They are simpler to interpret and easier to understand for most traders.
Section 2: Understanding Mean, Variance, and Standard Deviation
The Probability Envelopes Indicator utilizes various statistical measures to analyze historical price movements:
Mean: This is the average of a set of numbers. In the context of this indicator, it represents the average price movement for bullish (green) and bearish (red) scenarios.
Variance: This measure represents the dispersion of data points in a dataset. A higher variance indicates a greater spread of data points from the mean. Variance is calculated as the average of the squared differences from the mean.
Standard Deviation: This is the square root of the variance. It is a measure of the amount of variation or dispersion in a dataset. In the context of this indicator, standard deviations are used to calculate the width of the bands around the expected mean.
Section 3: Analyzing Historical Price Movements and Probabilities
The Probability Envelopes Indicator examines historical price movements and calculates probabilities based on their frequency:
The indicator first identifies and categorizes price movements into bullish (green) and bearish (red) scenarios.
It then calculates the probability of each price movement occurring by dividing the frequency of the movement by the total number of occurrences in each category (bullish or bearish).
The expected green and red movements are calculated by multiplying the probabilities by their respective price movements and summing the results.
The total expected movement, or weighted average, is calculated by combining the expected green and red movements and dividing by the total number of occurrences.
Section 4: Constructing the Probability Envelopes
The Probability Envelopes Indicator utilizes the calculated statistics to construct its bands:
The expected mean is calculated using the total expected movement and applied to the current open price.
An exponential moving average (EMA) is used to smooth the expected mean, with the smoothing length determining the degree of responsiveness.
The upper and lower bands are calculated by adding and subtracting the mean green and red movements, respectively, along with their standard deviations multiplied by a user-defined multiplier.
Section 5: Benefits of the Probability Envelopes Indicator
The Probability Envelopes Indicator offers numerous advantages to traders:
Enhanced Decision-Making: By providing probability-based estimations of future price levels, the indicator can help traders make more informed decisions and potentially improve their trading strategies.
Versatility: The indicator is applicable to various financial instruments, such as stocks, forex, commodities, and cryptocurrencies, making it a valuable tool for traders in different markets.
Customization: The indicator's parameters, including the use of log returns, multiplier values, and smoothing length, can be adjusted according to the user's preferences and trading style. This flexibility allows traders to fine-tune the Probability Envelopes Indicator to better suit their needs and goals.
Risk Management: The Probability Envelopes Indicator can be used as a component of a risk management strategy by providing insight into potential price movements. By identifying potential areas of support and resistance, traders can set stop-loss and take-profit levels more effectively.
Visualization: The graphical representation of the indicator, with its clear upper and lower bands, makes it easy for traders to quickly assess the market and potential price levels.
Section 6: Integrating the Probability Envelopes Indicator into Your Trading Strategy
When incorporating the Probability Envelopes Indicator into your trading strategy, consider the following tips:
Confirmation Signals: Use the indicator in conjunction with other technical analysis tools, such as trend lines, moving averages, or oscillators, to confirm the strength and direction of the market trend.
Timeframes: Experiment with different timeframes to find the optimal settings for your trading strategy. Keep in mind that shorter timeframes may generate more frequent signals but may also increase the likelihood of false signals.
Risk Management: Always establish a proper risk management strategy that includes setting stop-loss and take-profit levels, as well as managing your position sizes.
Backtesting: Test the Probability Envelopes Indicator on historical data to evaluate its effectiveness and fine-tune its parameters to optimize your trading strategy.
Section 7: Cons and Limitations of the Probability Envelopes Indicator
While the Probability Envelopes Indicator offers several advantages to traders, it is essential to be aware of its potential cons and limitations. Understanding these can help you make better-informed decisions when incorporating the indicator into your trading strategy.
Lagging Nature: The Probability Envelopes Indicator is primarily based on historical data and price movements. As a result, it may be less responsive to real-time changes in market conditions, and the predicted price levels may not always accurately reflect the market's current state. This lagging nature can lead to late entry and exit signals.
False Signals: As with any technical analysis tool, the Probability Envelopes Indicator can generate false signals. These occur when the indicator suggests a potential price movement, but the market does not follow through. It is crucial to use other technical analysis tools to confirm the signals and minimize the impact of false signals on your trading decisions.
Complex Statistical Concepts: The Probability Envelopes Indicator relies on complex statistical concepts and calculations, which may be challenging to grasp for some traders, particularly beginners. This complexity can lead to misunderstandings and misuse of the indicator if not adequately understood.
Overemphasis on Past Data: While historical data can be informative, relying too heavily on past performance to predict future movements can be limiting. Market conditions can change rapidly, and relying solely on past data may not provide an accurate representation of the current market environment.
No Guarantees: The Probability Envelopes Indicator, like all technical analysis tools, cannot guarantee success. It is essential to approach trading with realistic expectations and understand that no indicator or strategy can provide foolproof results.
To overcome these limitations, it is crucial to combine the Probability Envelopes Indicator with other technical analysis tools and utilize a comprehensive risk management strategy. By doing so, you can better understand the market and increase your chances of success in the ever-changing financial markets.
Section 8: Probability Envelopes Indicator vs. Bollinger Bands
Bollinger Bands and the Probability Envelopes Indicator are both technical analysis tools designed to identify potential support and resistance levels, as well as potential trend reversals. However, they differ in their underlying concepts, calculations, and applications. This section will provide a deep dive into the differences between these two indicators and how they can complement each other in a trading strategy.
Underlying Concepts and Calculations:
Bollinger Bands:
Bollinger Bands are based on a simple moving average (SMA) of the price data, with upper and lower bands plotted at a specified number of standard deviations away from the SMA.
The distance between the bands widens during periods of increased price volatility and narrows during periods of low volatility, indicating potential trend reversals or breakouts.
The standard settings for Bollinger Bands typically involve a 20-period SMA and a 2 standard deviation distance for the upper and lower bands.
Probability Envelopes Indicator:
The Probability Envelopes Indicator calculates the expected price movements based on historical data and probabilities, utilizing mean and standard deviation calculations for both upward and downward price movements.
It generates upper and lower bands based on the calculated expected mean movement and the standard deviation of historical price changes, multiplied by a user-defined multiplier.
The Probability Envelopes Indicator also allows users to choose between using log returns or percentage changes for the calculations, adding flexibility to the indicator.
Key Differences:
Calculation Method: Bollinger Bands are based on a simple moving average and standard deviations, while the Probability Envelopes Indicator uses statistical probability calculations derived from historical price changes.
Flexibility: The Probability Envelopes Indicator allows users to choose between log returns or percentage changes and adjust the multiplier, offering more customization options compared to Bollinger Bands.
Risk Management: Bollinger Bands primarily focus on volatility, while the Probability Envelopes Indicator incorporates probability calculations to provide additional insights into potential price movements, which can be helpful for risk management purposes.
Complementary Use:
Using both Bollinger Bands and the Probability Envelopes Indicator in your trading strategy can offer valuable insights into market conditions and potential price levels.
Bollinger Bands can provide insights into market volatility and potential breakouts or trend reversals based on the widening or narrowing of the bands.
The Probability Envelopes Indicator can offer additional information on the expected price movements based on historical data and probabilities, which can be helpful in anticipating potential support and resistance levels.
Combining these two indicators can help traders to better understand market dynamics and increase their chances of identifying profitable trading opportunities.
In conclusion, while both Bollinger Bands and the Probability Envelopes Indicator aim to identify potential support and resistance levels, they differ significantly in their underlying concepts, calculations, and applications. By understanding these differences and incorporating both tools into your trading strategy, you can gain a more comprehensive understanding of the market and make more informed trading decisions.
In conclusion, the Probability Envelopes Indicator is a powerful and versatile technical analysis tool that offers unique insights into expected price movements based on historical data and probability calculations. It provides traders with the ability to identify potential support and resistance levels, as well as potential trend reversals. When compared to Bollinger Bands, the Probability Envelopes Indicator offers more customization options and incorporates probability-based calculations for a different perspective on market dynamics.
Although the Probability Envelopes Indicator has its limitations and potential cons, such as the reliance on historical data and the assumption that past performance is indicative of future results, it remains a valuable addition to any trader's toolkit. By using the Probability Envelopes Indicator in conjunction with other technical analysis tools, such as Bollinger Bands, traders can gain a more comprehensive understanding of the market and make more informed trading decisions.
Ultimately, the success of any trading strategy relies on the ability to interpret and apply multiple indicators effectively. The Probability Envelopes Indicator serves as a unique and valuable tool in this regard, providing traders with a deeper understanding of the market and its potential price movements. By utilizing this indicator in combination with other tools and techniques, traders can increase their chances of success and optimize their trading strategies.
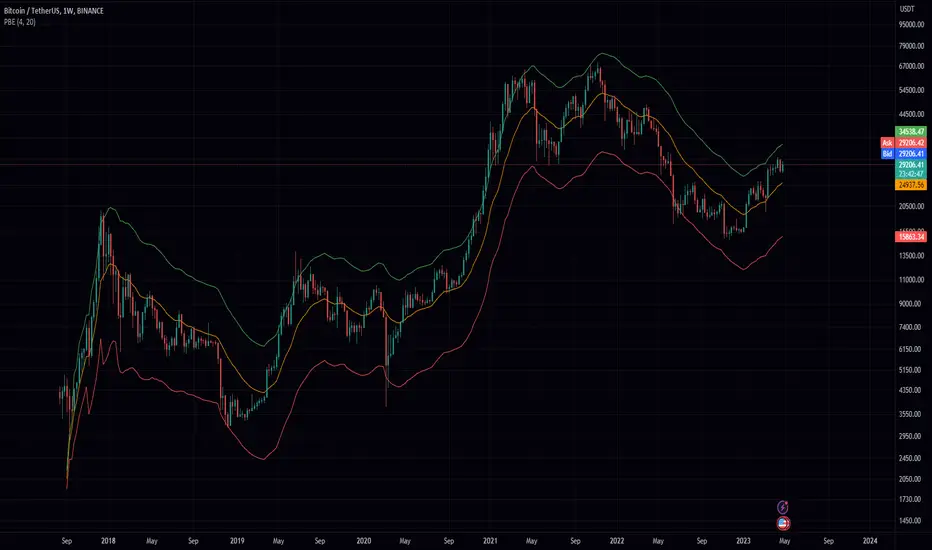
Bollinger Band ribbonThis indicator plots 9 upper and lower lines with increasing length. Lines are 0.618 upper and lower level of Bollinger band.
Galactic Bollinger Bands Envelope (GBBE)The Galactic Bollinger Bands Envelope (GBBE) is a technical indicator that is used to identify potential areas of support and resistance in a trading instrument's price. The GBBE indicator is similar to the traditional Bollinger Bands (BB) indicator but offers certain advantages and improvements over the standard BB indicator.
The GBBE indicator is based on a similar concept to the BB indicator, where the bands are plotted around a moving average of the price. However, the GBBE indicator uses a more sophisticated calculation that accounts for the volatility of the instrument being analyzed. The GBBE indicator is designed to adjust to changing market conditions and provide more accurate signals.
One of the key strengths of the GBBE indicator is that it offers a clearer signal for traders to identify potential buy and sell opportunities. This is because the GBBE indicator has a tighter range compared to the standard BB indicator, which can sometimes generate false signals due to the wider range.
The GBBE indicator also has the advantage of being more responsive to sudden price movements, which makes it particularly useful for short-term traders who need to make quick decisions. The GBBE indicator is able to adjust to sudden market changes, which means that traders are less likely to miss out on trading opportunities.
Another advantage of the GBBE indicator is that it can be customized to suit individual trading styles and preferences. Traders can adjust the input parameters of the GBBE indicator, such as the length of the moving average and the multiplier, to optimize the indicator for different market conditions.
In conclusion, the Galactic Bollinger Bands Envelope (GBBE) is a powerful technical indicator that offers several advantages over the standard Bollinger Bands (BB) indicator. The GBBE indicator is designed to be more responsive and accurate, which makes it particularly useful for short-term traders. The GBBE indicator also offers traders more flexibility to customize the indicator to suit individual trading styles and preferences. Overall, the GBBE indicator is a valuable tool for traders looking to identify potential buy and sell opportunities in the markets.

Trend IndicatorThis indicator has different features:
1. Ichimoku = this indicator can plot Ichimoku calculated both in the common formula and with the volume average, you can choose the calculator method for each line.
2. Channel and Bands = this mode allows the user to choose from channel and band, "channel" shows the Keltner channel, and "band" shows the Bollinger bands. Both the indicators are calculated including the volume in the formula of the average midpoint.
3. Color candle = this function allows the user to see two different colors of candles on the chart, the positive color occurs when both the long-term average and the short team average of price calculated using the volume is above the two averages calculated without the volume. This function is great to analyze the volume pressure, useful to identify trend continuation and exhaustion.
4. Extreme reversal zones = this is a version of the Keltner channels calculated over a high number of candles and with high deviation, to identify the potential zones of reversal.
Note that in the "Ichimoku" indicator, the backline is the T.R.A.M.A. indicator, created and published open source by Lux Algo, which I thank for the script.

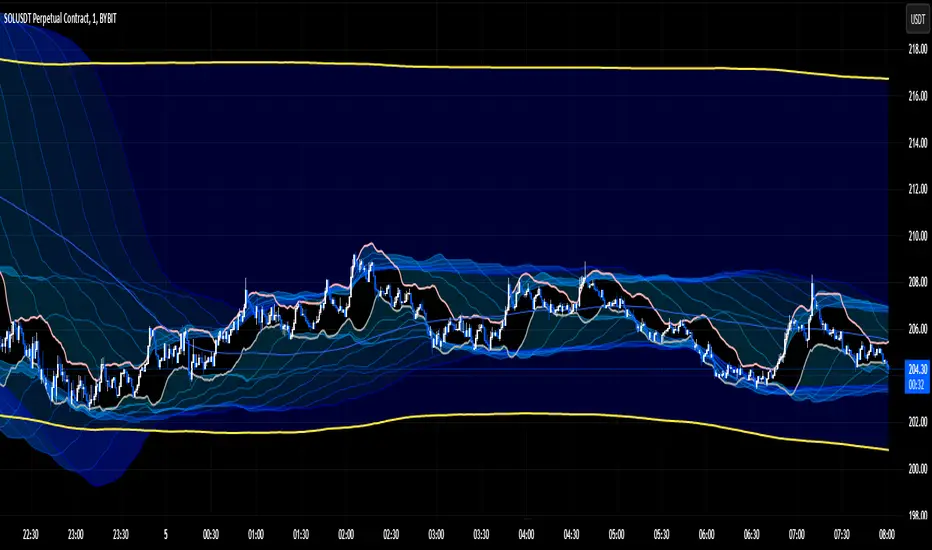
Weighted Deviation Bands [Loxx]What are Weighted Deviation Bands?
Variation of the Bollinger bands but it uses linear weighted average and weighted deviation via Mladen Rakic.
What is Weighted Deviation?
This weighted deviation is a sort of all linear weighted deviation. It uses linear weighting in all the steps calculated (which makes it different from the built in deviation in a case when linear weighted ma is used in the ma method). It is more responsive than the standard deviation
Included
Bar coloring

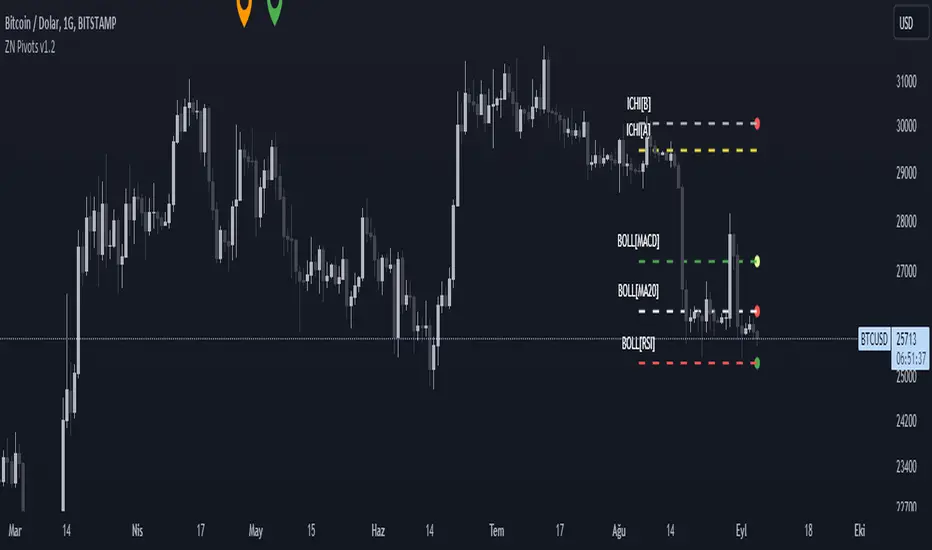
ZN PivotsDescription
This indicator is aimed at showing the pivot points of the trend by using Ichimoku cloud and Bollinger bands.
BOLL : Upper Bollinger Band. The red circle formed on it refers to the downward intersection of the MACD indicator. In the downward intersection, a red circle appears.
BOLL : Middle Bollinger Band.
BOLL : Lower Bollinger Band. The red circle formed on it refers to the downward intersection of the RSI indicator. In the downward intersection, a red circle appears.
ICHI : Ichimoku Leading A Line. The green circle formed on it refers to the upward intersection of the ICHIMOKU indicator.
ICHI : Ichimoku Leading B Line. The red circle formed on it refers to the downward intersection of the ICHIMOKU indicator.
Warning
As a result, this indicator should be expected to give an idea of the trend direction, not a trading signal.
Version
v1.0
CryptoGraph Entry BuilderA complete system to generate buy & sell signals, based on multiple indicators, timeframes and assets
═════════════════════════════════════════════════════════════════════════
🟣 How it works
This indicator allows you to create buy & sell signals, based on multiple trigger conditions, placed in one easy to use TradingView indicator to produce alerts, backtest, reduce risk and increase profitability. This script is especially designed to be used with the CryptoGraph Strategizer indicator. Signals produced by this indicator, can be used as external input with the CryptoGraph Strategizer, by adding both indicators to your chart and selecting "External Input" as entry source in the inputs of the Strategizer indicator. From that point on, buy & sell signals generated by the Entry Builder, will be used for backtesting.
Each trigger or filtering condition is selectable and able to be combined using the selection boxes.
Trigger or filter conditions can be used on a different timeframes, and with different assets or coin pairs. Make sure to set higher timeframe filters, to a higher timeframe than your chart timeframe.
🟣 How to use
• Add the indicator to your chart
• Select an indicator you woud like to use for entry analysis. Combine more indicators for more entry filtering
• Configure entry conditions per indicator. It is recommended to add and configure one indicator at a time
• Analyse your buy/sell entries
• Connect to CryptoGraph Strategizer as external input source for backtesting purposes
🟣 Indicator Filters
• ATR :
Average True Range (ATR) is a tool used in technical analysis to measure volatility .
Possible options for ATR entry filtering are an ATR value greater/smaller than your input variable for trade entries, or the ATR crossing your input variable for trade entries.
This enables the possibility to only enter positions when the market has a certain degree of volatility .
• ADX :
The Average Directional Index ( ADX ) helps traders determine the strength of a trend, not its actual direction. It can be used to find out whether the
market is ranging or starting a new trend.
Possible options for ADX entry filtering are an ADX value greater/smaller than your input variable for trade entries, or the ADX crossing your input variable for trade entries.
• OBV :
The On Balance Volume indicator (OBV) is used in technical analysis to measure buying and selling pressure. It is a cumulative indicator meaning that on days where price went up, that day's volume is added to the cumulative OBV total.
Possible options for OBV entry filtering are Regular, Hidden or Regular&Hidden divergences. Divergence is when the price of an asset is moving in the opposite direction of a technical indicator, such as an oscillator, or is moving contrary to other data. Divergence warns that the current price trend may be weakening, and in some cases may lead to the price changing direction.
• Moving Average :
Moving Average (MA) is a price based, lagging (or reactive) indicator that displays the average price of a security over a set period of time. A Moving Average is a good way to gauge momentum as well as to confirm trends, and define areas of support and resistance .
Possible options for MA entry filtering are price being above/below Moving Average 1, price crossing up/down Moving Average 1, Moving Average 1 being above/below Moving Average 2 and Moving Average 1 crossing up/down Moving Average 2.
• Supertrend :
Supertrend (ST) is a trend-following indicator based on Average True Range (ATR). The calculation of its single line combines trend detection and volatility . It can be used to detect changes in trend direction and to position stops.
Possible options for ST entry filtering are Supertrend being in upward/downward direction, or Supertrend changing direction.
• RSI :
The Relative Strength Index ( RSI ) is a well versed momentum based oscillator which is used to measure the speed (velocity) as well as the change (magnitude) of directional price movements.
Possible options for RSI entry filtering are RSI being smaller/greater than your input value, or RSI crossing up/down your input value.
• Stochastic RSI :
The Stochastic RSI indicator ( Stoch RSI ) is essentially an indicator of an indicator. It is used in technical analysis to provide a stochastic calculation to the RSI indicator. This means that it is a measure of RSI relative to its own high/low range over a user defined period of time.
Possible options for Stoch RSI entry filtering are Stoch RSI crossing below or above your input value.
• VWAP Bands :
Volume Weighted Average Price ( VWAP ) is a technical analysis tool used to measure the average price weighted by volume . VWAP is typically used with intraday charts as a way to determine the general direction of intraday prices.
We use standard deviations, determined by user input, to create VWAP bands.
Possible options for VWAP long entry filtering are: price being below the lower VWAP band, price crossing back up the lower VWAP band or price crossing down the lower VWAP band.
Possible options for VWAP short entry filtering are: price being above the upper VWAP band, price crossing back down the upper VWAP band, or price crossing up the upper VWAP band.
• Bollinger Bands :
Bollinger Bands (BB) are a widely popular technical analysis instrument created by John Bollinger in the early 1980’s. Bollinger Bands consist of a band of three lines which are plotted in relation to security prices. The line in the middle is usually a Simple Moving Average ( SMA ) set to a period of 20 days (the type of trend line and period can be changed by the trader; however a 20 day moving average is by far the most popular).
Possible options for BB long entry filtering are: price being below the lower Bollinger band , price crossing back up the lower Bollinger band or price crossing down the lower Bollinger band .
Possible options for BB short entry filtering are: price being above the upper Bollinger band , price crossing back down the upper Bollinger band , or price crossing up the upper Bollinger band .
• WaveTrend :
WaveTrend (WT) is a smoothed momentum oscillator which enables it to detect true reversals in an accurate manner.
Possible options for WT entry filtering are: Green/red dots below or above a certain WaveTrend value, Regular Divergence, Hidden Divergence and Regular&Hidden Divergence.

GKD-V Waddah Attar Explosion (WAE) [Loxx]Giga Kaleidoscope Waddah Attar Explosion (WAE) is a Volatility / Volume module included in Loxx's "Giga Kaleidoscope Modularized Trading System".
█ Giga Kaleidoscope Modularized Trading System
What is Loxx's "Giga Kaleidoscope Modularized Trading System"?
The Giga Kaleidoscope Modularized Trading System is a trading system built on the philosophy of the NNFX (No Nonsense Forex) algorithmic trading.
What is an NNFX algorithmic trading strategy?
The NNFX algorithm is built on the principles of trend, momentum, and volatility . There are six core components in the NNFX trading algorithm:
1. Volatility - price volatility ; e.g., Average True Range , True Range Double, Close-to-Close, etc.
2. Baseline - a moving average to identify price trend
3. Confirmation 1 - a technical indicator used to identify trends.
4. Confirmation 2 - a technical indicator used to identify trends.
5. Continuation - a technical indicator used to identify trends.
6. Volatility / Volume - a technical indicator used to identify volatility / volume breakouts/breakdown.
7. Exit - a technical indicator used to determine when a trend is exhausted.
How does Loxx's GKD (Giga Kaleidoscope Modularized Trading System) implement the NNFX algorithm outlined above?
Loxx's GKD v1.0 system has five types of modules (indicators/strategies). These modules are:
1. GKD-BT - Backtesting module (Volatility , Number 1 in the NNFX algorithm)
2. GKD-B - Baseline module (Baseline and Volatility / Volume , Numbers 1 and 2 in the NNFX algorithm)
3. GKD-C - Confirmation 1/2 and Continuation module (Confirmation 1/2 and Continuation, Numbers 3, 4, and 5 in the NNFX algorithm)
4. GKD-V - Volatility / Volume module (Confirmation 1/2, Number 6 in the NNFX algorithm)
5. GKD-E - Exit module (Exit, Number 7 in the NNFX algorithm)
(additional module types will added in future releases)
Each module interacts with every module by passing data between modules. Data is passed between each module as described below:
GKD-B => GKD-V => GKD-C(1) => GKD-C(2) => GKD-C(Continuation) => GKD-E => GKD-BT
That is, the Baseline indicator passes its data to Volatility / Volume . The Volatility / Volume indicator passes its values to the Confirmation 1 indicator. The Confirmation 1 indicator passes its values to the Confirmation 2 indicator. The Confirmation 2 indicator passes its values to the Continuation indicator. The Continuation indicator passes its values to the Exit indicator, and finally, the Exit indicator passes its values to the Backtest strategy.
This chaining of indicators requires that each module conform to Loxx's GKD protocol, therefore allowing for the testing of every possible combination of technical indicators that make up the six components of the NNFX algorithm.
What does the application of the GKD trading system look like?
Example trading system:
Backtest: Strategy with 1-3 take profits, trailing stop loss, multiple types of PnL volatility, and 2 backtesting styles
Baseline: Hull Moving Average
Volatility/Volume: Waddah Attar Explosion (WAE) as shown on the chart above
Confirmation 1: Halftrend Averages
Confirmation 2: Williams Percent Range
Continuation: Fisher Transform
Exit: Rex Oscillator
Each GKD indicator is denoted with a module identifier of either: GKD-BT, GKD-B, GKD-C, GKD-V, or GKD-E. This allows traders to understand to which module each indicator belongs and where each indicator fits into the GKD protocol chain.
Giga Kaleidoscope Modularized Trading System Signals (based on the NNFX algorithm)
Standard Entry
1. GKD-C Confirmation 1 Signal
2. GKD-B Baseline agrees
3. Price is within a range of 0.2x Volatility and 1.0x Volatility of the Goldie Locks Mean
4. GKD-C Confirmation 2 agrees
5. GKD-V Volatility / Volume agrees
Baseline Entry
1. GKD-B Baseline signal
2. GKD-C Confirmation 1 agrees
3. Price is within a range of 0.2x Volatility and 1.0x Volatility of the Goldie Locks Mean
4. GKD-C Confirmation 2 agrees
5. GKD-V Volatility / Volume agrees
6. GKD-C Confirmation 1 signal was less than 7 candles prior
Continuation Entry
1. Standard Entry, Baseline Entry, or Pullback; entry triggered previously
2. GKD-B Baseline hasn't crossed since entry signal trigger
3. GKD-C Confirmation Continuation Indicator signals
4. GKD-C Confirmation 1 agrees
5. GKD-B Baseline agrees
6. GKD-C Confirmation 2 agrees
1-Candle Rule Standard Entry
1. GKD-C Confirmation 1 signal
2. GKD-B Baseline agrees
3. Price is within a range of 0.2x Volatility and 1.0x Volatility of the Goldie Locks Mean
Next Candle:
1. Price retraced (Long: close < close or Short: close > close)
2. GKD-B Baseline agrees
3. GKD-C Confirmation 1 agrees
4. GKD-C Confirmation 2 agrees
5. GKD-V Volatility / Volume agrees
1-Candle Rule Baseline Entry
1. GKD-B Baseline signal
2. GKD-C Confirmation 1 agrees
3. Price is within a range of 0.2x Volatility and 1.0x Volatility of the Goldie Locks Mean
4. GKD-C Confirmation 1 signal was less than 7 candles prior
Next Candle:
1. Price retraced (Long: close < close or Short: close > close)
2. GKD-B Baseline agrees
3. GKD-C Confirmation 1 agrees
4. GKD-C Confirmation 2 agrees
5. GKD-V Volatility / Volume Agrees
PullBack Entry
1. GKD-B Baseline signal
2. GKD-C Confirmation 1 agrees
3. Price is beyond 1.0x Volatility of Baseline
Next Candle:
1. Price is within a range of 0.2x Volatility and 1.0x Volatility of the Goldie Locks Mean
3. GKD-C Confirmation 1 agrees
4. GKD-C Confirmation 2 agrees
5. GKD-V Volatility / Volume Agrees
█ Waddah Attar Explosion (WAE)
What is Waddah Attar Explosion (WAE)
Waddah Attar Explosion (WAE) Backtest is a momentum strategy that accounts for volatility in the market. It is the combination of MACD and Bollinger Bands with volatility cutoffs to determine entry and exit points. This version of WAE also includes a non-lag MACD option.
Other things to note
The GKD trading system requires that a GKD-V indicator be present in the indicator chain, but the GKD-V indicator doesn't need to be active. You can turn on/off the Volatility Ratio as you wish so you can backtest your trading strategy with the filter on or off.
Additional features will be added in future releases.

Faytterro Bandswhat is Faytterro Bands?
it is a channel indicator like "Bollinger Bands".
what it does?
creates a channel using standard deviations and means. thus giving users an idea about the expensive and cheap zones. It uses a special weighted moving average different from standard bollinger bands, it also averages not only price but also deviations.
how it does it?
it uses this formulas:
how to use it?
its usage is the same as "bollinger band".
length represents the number of candles to be taken into account, source represents the source of those candles and stdev represents the coefficient of the standard deviation.
you can use it with other indicators:

Z Pack BollingerOur new "Z Pack" indicator is a modified version of the traditional Bollinger Bands indicator, with a bunch of additional features what makes it a powerful tool that allows traders to make informed decisions based on the market's volatility and short-term trend.
The z-score of the Bollinger Bands indicator is a measure of how many standard deviations the current price is away from the moving average. This provides a more normalized view of the price action, which can be especially useful in identifying potential trend changes. In this form of indicator it is much easier to notice the most extreme deviations from the mean.
One of the main advantages of using this indicator is that it can help traders identify market conditions that are unusually far away from the mean, which can be indicative of a potential trend reversal or that, with sustained momentum a new trend may be about to begin.
Another advantage of the Z-Score Bollinger Bands indicator is that it can help traders identify when a market is trending. This is because when the Z-score is consistently high or low, it can indicate that a trend is in progress or that a trend may be reversing, respectively.
As for the additional features with which we have charged this indicator, there are many of them and they will be explained now.
Capital line
"Capital line" is based on a kernel regression of z score value over time.
The kernel regression is a non-parametric method that allows to estimate the underlying probability density function of a random variable and this way provides a smooth representation of the data. By using this method, the "Сapital line" is able to react to market changes much faster than traditional methods and gives traders a more accurate representation of the short-term trend.
Also we have developed a filter that reduces the number of false signals (you can toggle it in the settings). It is also possible to enable the display of only the capital line to focus only on it.
Divergence search
One of the unique features of the indicator is its ability to search for divergence between the z score and the price. A divergence occurs when the indicator and the price are moving in opposite directions, indicating a potential trend reversal. This allows traders to identify potential market turning points and make informed decisions.
It is possible to search for divergence on a Z-score, although it is not a common practice. In technical analysis, divergence is a method of comparing the movement of an asset's price with an indicator, such as an oscillator, in order to identify potential trend reversals. The same concept of divergence can be applied to a Z-score by comparing the movement of a value's Z-score to the underlying data, for example, by comparing the change in Z-score to the change in the underlying price of a stock. However, this is not a widely used approach and requires thoughtful analysis, but according to our observations, it provides quite important information about the potential exhaustion of the current trend.
By combining the z-score with the price, traders can look for divergences that might not be as obvious when looking at the indicator or the price alone. For example, if the z-score is trending higher while the price is trending lower, this could indicate a potential bullish reversal. Similarly, if the z-score is trending lower while the price is trending higher, this could indicate a potential bearish reversal.
Price Labels
The labels indicating the price of an asset that corresponds to a specific level of the standard deviation are a useful feature for traders because it allows them to quickly identify key levels of support and resistance. By placing limit orders at these levels, traders can potentially enter or exit trades at more favorable prices. This can help to improve the risk-reward ratio of their trades, as well as potentially increase the chances of a profitable outcome. Additionally, having these labels readily available can save traders time in identifying key levels of support and resistance, allowing them to focus on other aspects of their trading strategy.
Additionally, there is an option to analyze the previous volatility of the instrument for a specified time period. If the instrument has crossed the maximum standard deviation level at least once during the specified time period, a separate dashed line will be drawn on the z score chart, demonstrating how volatile the instrument is in the context of the specified time period. This is known as Extreme Mode.
The feature of analyzing the previous volatility of an instrument using the z score indicator can be beneficial for traders in a number of ways. One major advantage is that it allows traders to quickly assess the historical volatility of an instrument and compare it to current volatility levels. This can be useful for determining if an instrument is currently experiencing unusually high or low volatility, which can in turn inform trading decisions.
Another advantage of this feature is that it allows traders to quickly identify key levels of volatility that have been historically significant for the instrument. For example, if an instrument has frequently crossed the maximum deviation level during a specified time period, a trader may choose to place limit orders at that level in anticipation of the instrument reaching it again in the future.
The ability to see the price at a particular moment in time when the price breaks through the 4th(selectable) level of the z score can be an advantage for traders as it allows them to quickly identify key price levels and potentially place limit orders at those levels. This feature can be useful for traders who want to take advantage of market volatility or for those who want to set stop-loss or take-profit levels.
Additionally, the feature can be useful for identifying key levels of support and resistance, as well as for identifying potential entry and exit points for trades. By having the ability to quickly identify these key levels, traders can make more informed decisions about their trades and potentially increase their chances of success in the market.
Alerts
The "Z pack" indicator also includes an advanced, customisable alerting system, with alerts for z level touches, zero crossings, changes in the direction of the capital line, and confirmed or potential divergence. It allows them to stay informed of key developments in the market in real-time and take action accordingly.
For example, if the indicator generates an alert for a z level touch, a trader can place a market order at that level knowing that the price has reached a significant level of volatility. Similarly, an alert for a zero crossing (up/down) can indicate a change in trend, and a trader can use this information to adjust their strategy accordingly.
The alerts of confirmed or potential divergence can be especially useful for identifying potential turning points in the market and make decisions based on that.
NB! Remember, it is important to have a solid trading plan in place and to properly manage risk when trading. Our custom indicator can be a useful tool, but it should not be the only factor considered when making trade decisions.
