R100 Volatility Combo Bands v1 (*v*)The Volatility Combo Bands are made from 4 separate volatility bands- two Bollinger Bands (10 and 20 period) and two Price Headley Acceleration Bands (10 and 20 period). The Volatility Combo Bands plot the innermost upper and lower points from these bands and then plots a mid-line. By default, only the standard 20 period Bollinger Bands and Combo Bands with mid-line are displayed, but can be configured however you want.
Try it out- see squeezes earlier, ride the bands earlier in trending markets, trade pullbacks to the Combo Bands and mid-line, trade the range of the band or use them to help identify potential support and resistance levels. Hopefully they can add another dimension to identifying volatility contraction patterns or whatever you currently use these things for!
I hope you get some value out of it. Only conditions of use are that if you improve it, let me know and if you publish something that uses it, don't hide the code! Enjoy!
Code for the Price Headley Acceleration Bands pinched and modified from LazyBear - thankyou.
Cari dalam skrip untuk "bollingerband"

Dependent Variable Odd Generator Risk Detector
In fact, I wrote this script for detect Bollinger and Linear Regression Bands squeeze.
It's a side script.
Logic works like this:
Only the stagnant market probability is drawn from the Bollinger bandwidth by Dependent Variable Odd Generator and MFI index is calculated taking into account the volume.
This value ranges from 0 to 100.
To be sure, this value is averaged over a small period.
If you break the average and exceed 50, the bollinger band is too narrow and the risk is too high.
This means more commissions, more transactions, and vain work.
Or, when in position, the warning is not ignored due to unnecessary signals.
This code is open source under the MIT license. If you have any improvements or corrections to suggest, please send me a pull request via the github repository github.com
Stay tuned , best regards.

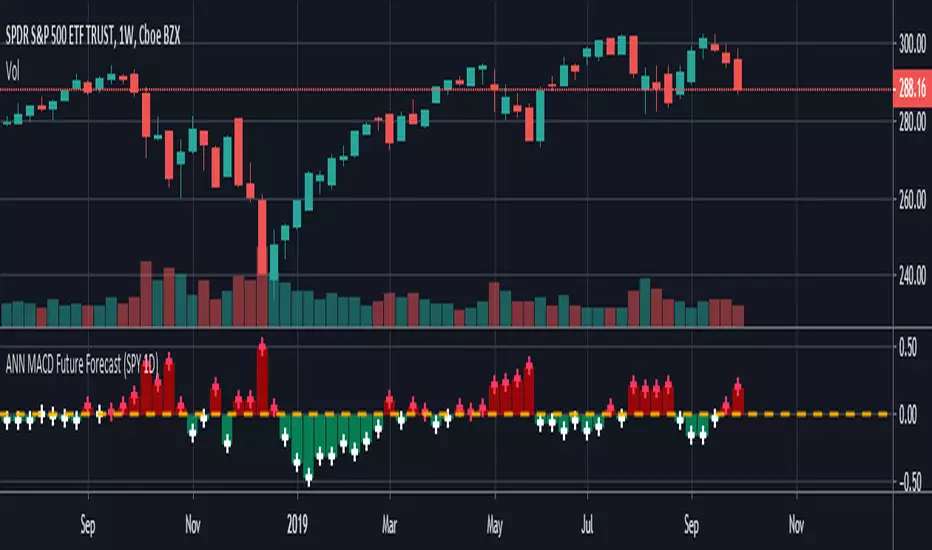
ANN MACD Future Forecast (SPY 1D) NOTE : Deep learning was conducted in a narrow sample set for testing purposes. So this script is Experimental .
This system is based on the following article and is inspired by an external program:
hackernoon.com
None of the artificial neural networks in Tradingview work and are not based on completely correct logic. Unlike others in this system:
IMPORTANT NOTE: If the tangent activation function is used, the input data must also have tangent values (compared to the previous values of 1 bar).
Inputs were prepared according to this judgment.
1. The tangent function which is the activation function is written correctly. (The tangent function in the article: ActivationFunctionTanh (v) => (1 - exp (-2 * v)) / (1 + exp (-2 * v)))
2. Missing bias parts in the formulas were added.
3. The output function is taken from the next day (historical), so that the next bar can be predicted, which is the truth.
4.The forecast value of the next bar is subtracted from the current bar change and the market direction is determined.
5.When the future forecast and the current close are added together, the resulting data is called seed.
The seed carries data both from the present and from yesterday and from the future.
6.And this seed was subjected to the MACD method.
Thus, due to exponential averages, more importance will be given to recent developments and
The acceleration situations will show us the direction.
However, a short position should be taken for crossover and a long position for crossunder .
Because the predicted values work in reverse.Even though we use the same period (9,12,26) it is much faster!
7. There is no future code that can cause Repaint.
However, the color after closing should be checked.
The system is completely correct.
However, a very narrow sample was selected.
100 data: Tangent diffs ; volume change, bollinger bands values changes (Upband , Midband , Lowband) and LazyBear's Squeeze Momentum Indicator (SQZMOM_LB) change and the next bar data (historical) price change were put into the deep learning test.
IMPORTANT NOTE : The larger the sample set and the more effective dependent variables, the higher the hit rate of the deep learning test!
EDIT : This code is open source under the MIT License. If you have any improvements or corrections to suggest, please send me a pull request via the github repository github.com
Stay tuned. Best regards!
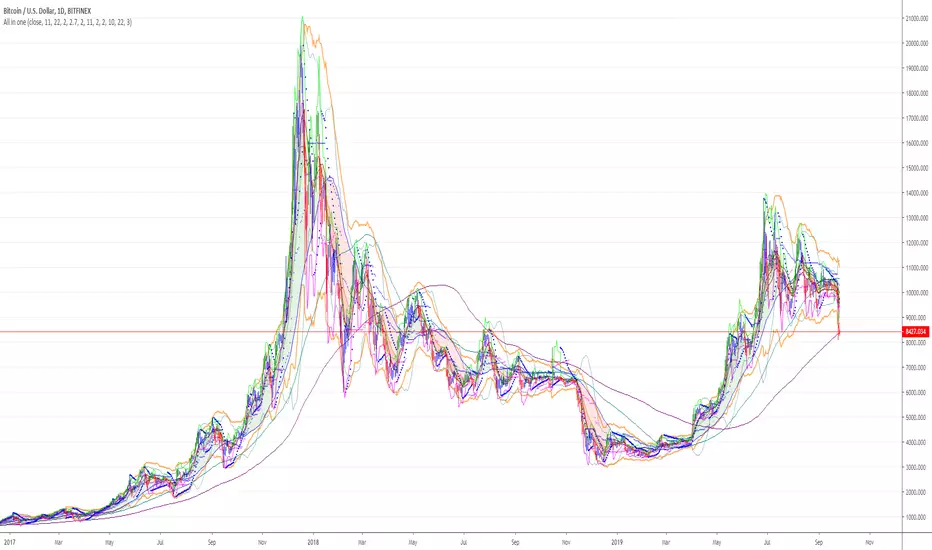
ENVELOPE BOLLINGER KELTN IMPULSE EMA SMA SAFEZONE SAR CHANDELIERALL THIS ALL IN ONE!
there are many options to check or uncheck to show only the tool that you need at that particular moment.
ENJOY!
ENVELOPE BOLLINGER KELTNER IMPULSE EMA SMA SAFEZONE SAR CHANDELIER
Bollinger Bands Width 10標準偏差Standard Deviation(bolliger bands width)を10本重ねたものになります。お好みのスパン、色、σでお使いください。

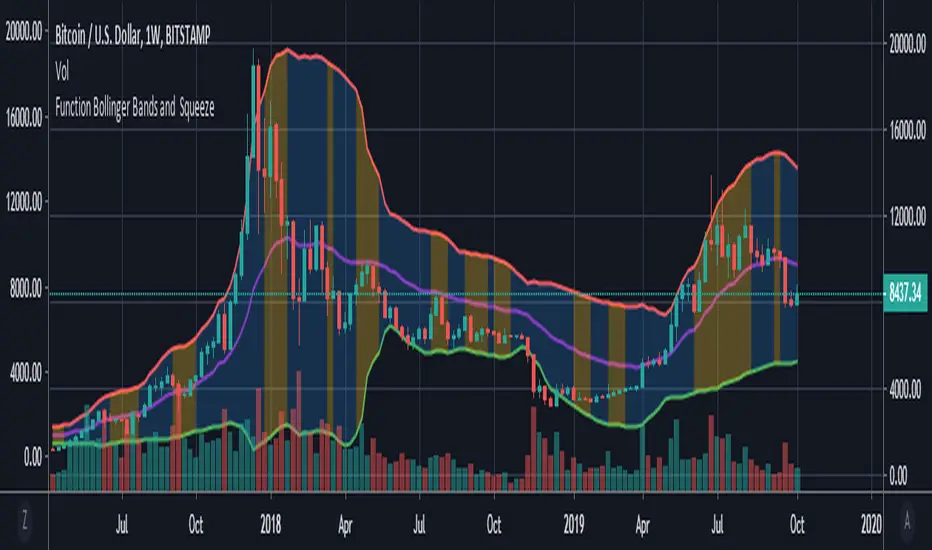
Function : Bollinger Bands and BBW Squeeze DetectorThis script shows Bollinger Bands function and want to detect Bollinger Band Width Squeeze with a successful, different perspective .
Bollinger Bands : You can specify the Bollinger Bands periods as mutable variables .
Bollinger Band Width Squeeze : First the Bollinger bands width was calculated.The width was then divided into levels using the money flow index.
Thus, the bollinger takes into account the available volume averages when calculating the band width mfi (Money Flow Index).
After this modelling, we can limit and color the lower limit and upper limits just as Relative Strength Index.
We can even put warnings on oversold areas if desired. Let's not forget that we are working with width rather than price.
By design, squeeze areas are defined directly above the Bollinger Bands with coloration. I think it is very practical and looks stylish.
I tried and found it quite successful and wanted to share it with users.
I came up with many ideas when I wrote this system, and I will share them very soon . I hope it will be useful to users and give new ideas.
Best regards.
DAX Shooter 5M StrategyThis is a simple strategy that applies very well for scaling indices to 5 minutes especially for the DAX. The algorithm provides for buying or selling when the market is very "pulled". The rules are as follows:
you buy when:
1- The ADX indicator with the standard settings is greater than 32.
2- the RSI indicator set to 7 periods is crossing upwards the oversold line at 30
3- the candle minimum is lower than the lower band of bollinger bands set to 50 periods.
is sold when:
1- ADX indicator with standard settings is greater than 32.
2 - the RSI indicator set to 7 periods is crossing downwards the overbought line at 70
3- the maximum of the candle is higher than the upper band of the bollinger bands set to 50 periods.
Money management is at the discretion of the trader but usually it is better to set a fixed stop loss and a take profit on reaching the opposite bollinger band.
Enjoy trading at all!

Bollinger Bands with Multiple Moving AveragesBolling bands with a triple MA overlay in one indicator

Multi EMA/SMA with Bollinger Bands Combo 1.0This script provides:
5 regular EMAs
5 regular SMAs
3 multiple time frame EMAs
3 multiple time frame SMAs
Bollinger Bands
All features can be turned on/off and customized regarding color, lines, etc.
Excellent for TradingView users with limited or free accounts.

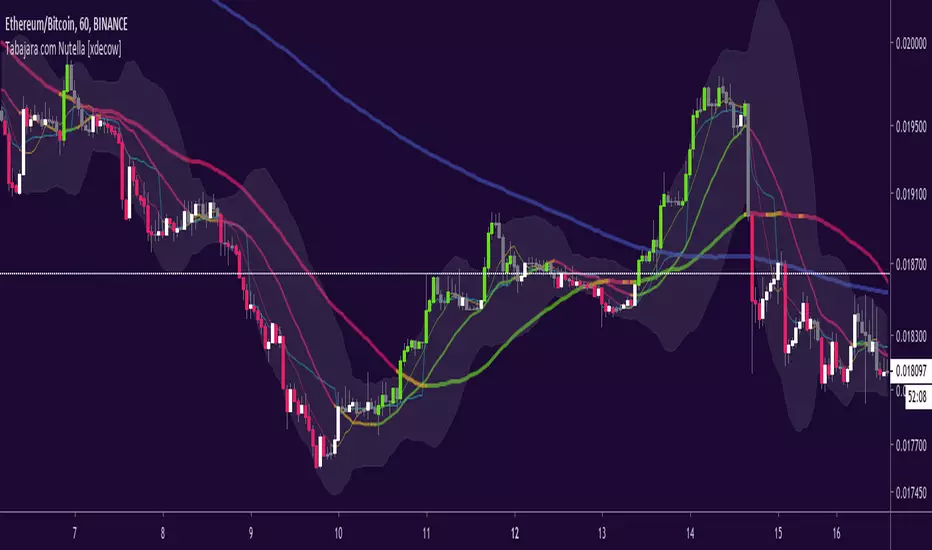
Tabajara com Nutella [xdecow]Tabajara setup from André Machado
-ma 8
-ma 20
-ma 50
-ma 200 (blue)
-vwap (aqua)
-bollinger bands
-barcolor based on tabajara rules

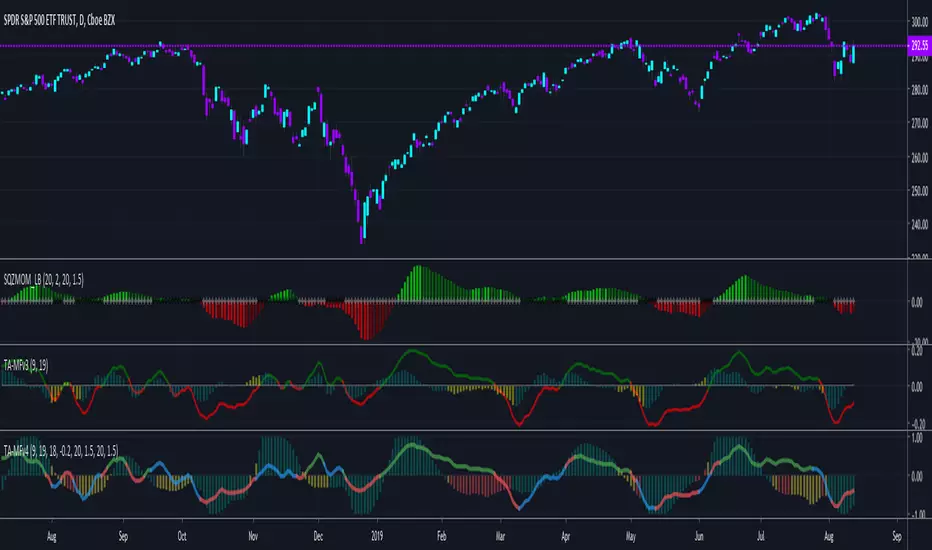
TA-Money Flow-Version4Updated for TV-Pine V4
This is the MACD of a stochastic OBV movement indicator and now the MACD of the Squeeze Momentum Indicator. It is good (right) to work with both price and volume...it is also good to utilize the most popular indicator ever in TV (Lazybear).
I've included highlighting based on price divergence, yellow is divergence of either OBV or SQZ, red is both divergence, and then I've also built in the "squeeze on - blue" highlighting to show follow through of divergence. It works great on any time frame, but you need to have volume data. Not sure where I originally got this (stoch-OBV, somewhere off Tradingview several years ago, thanks to the person who shared), Squeeze is Lazybear, links below.
Enjoy.
Version 4:
Updated OBV equation because TV-Pine V3 broke in V4
Included MACD of Squeeze for histogram
Included "squeeze on" highlighting
TA-Money-Flow-Version3
TA-Money-Flow-Version2
Squeeze-Momentum-Indicator-LazyBear
Multiple Moving AveragesThis is an indicator with 4 moving average slots and 6 exponential moving average slots
It also has bollinger bands and a volume weighted moving average slot
Feel free to edit this and add/remove some and publish your own
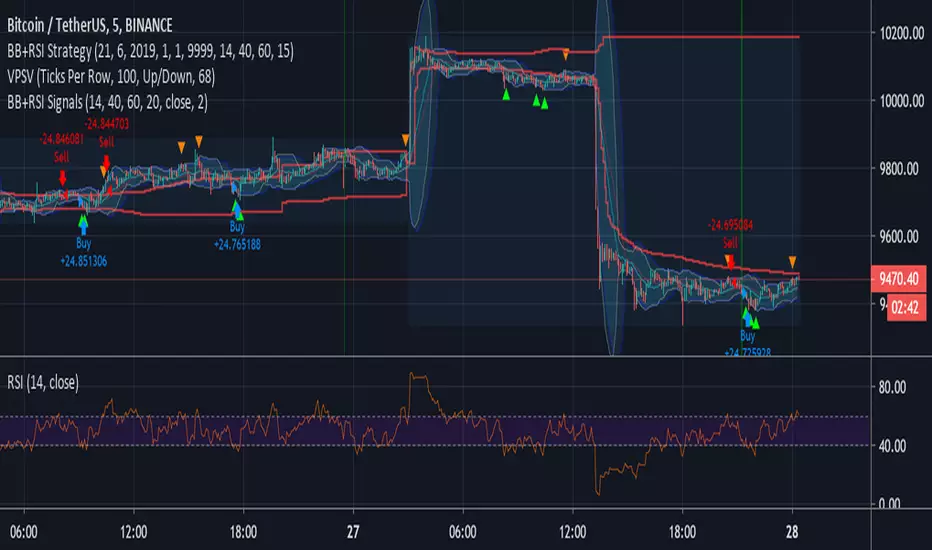
Bollinger + RSI Signals (by Bader Kamal)This idea originally by ChartArt on January 14, 2015 as Strategy, and I modify it to become as Signals on 26 July 2019.
This signals uses a modified RSI to sell when the RSI increases over the value of 60 (or to buy when the value falls below 40), with the classic Bollinger Bands strategy to sell when the price is above the upper Bollinger Band (and to buy when this value is below the lower band).
This signals only triggers when both the RSI and the Bollinger Bands indicators are at the same time in a overbought or oversold condition.
Czarlieron's Multiple MA's w/ BBThis script contains:
Multiple EMA's (8, 13, 21, 34, 55, 100, 200)
Multiple SMA's (8, 13, 21, 34, 55, 100, 200)
Bollinger Bands


linear and Bollingers Bands and Fibonacci ratios This model give us the following
1 .linear regression channel
2.dynamic upper and lower fibs
3. upper and lower bollinger bands
each specific to the time frame that you use
So by using all 3 in one indicator it easy to see ressistance and support level

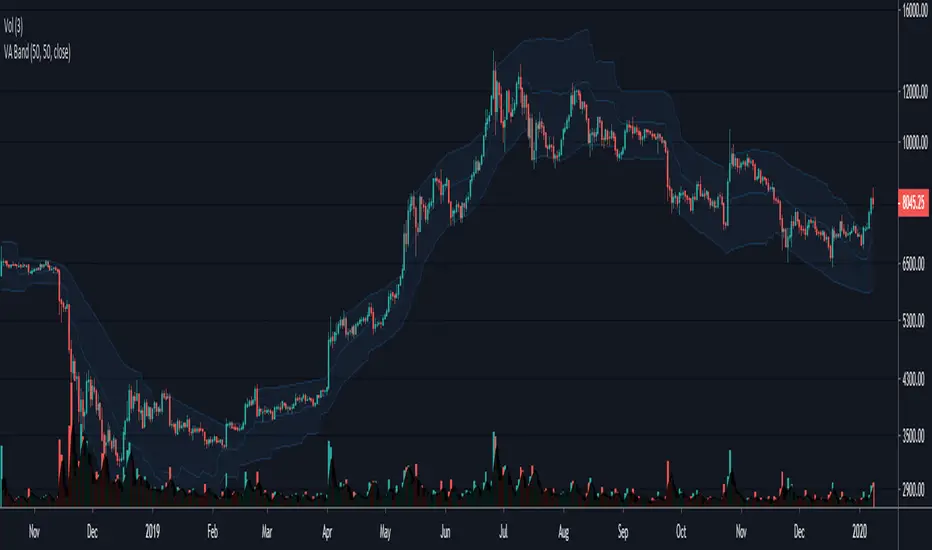
Volatility Adjusted Bands - JD This indicator gives a likely trading range based on the volatility of the past x amount of bars, measured against a certain moving average.
The indicator can be used as an alternative for BBands.
It gives approx. the same "trend-side" lines (upper line in uptrend, lower line in down trend) as the Bollinger Bands, but the opposite line follows closer on price,
Instead of "flying out" to the other direction like in BBands.
As a comparison, the BBands for the same length (50 period) are added on the chart.
JD.
#NotTradingAdvice #DYOR
I build these indicators for myself and provide them open source, to use for free to use and improve upon,
as I believe the best way to learn is toghether.
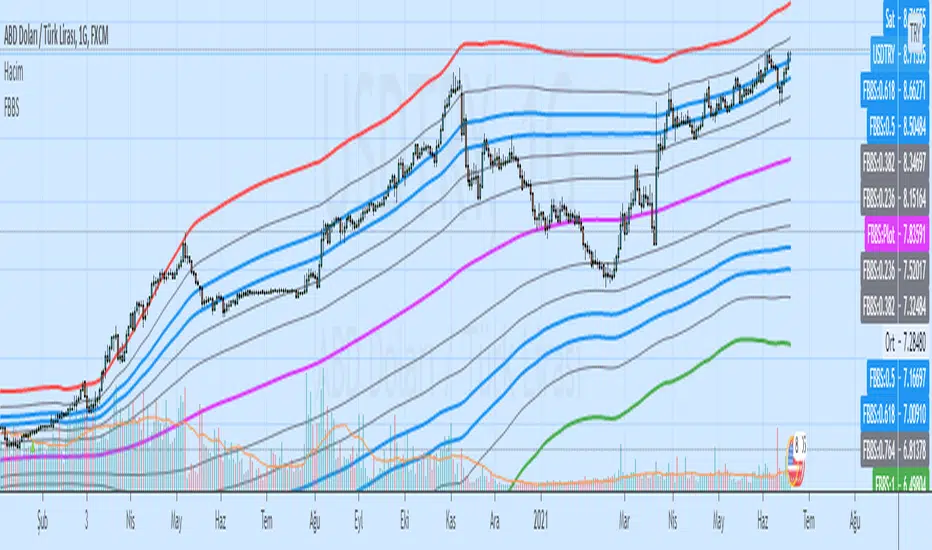
[feeble] TrenderEver wondered which way the price is trending??!
feeble Trender BETA™ shows the trend based on middle crossings in different timeframes, volume weighting and volatility(std Deviations)
--The indicator displays the same on any timeframe
--Select a FROM and TO period
--Use DuPLiCaToR to make 12 copies - use values between 0.8-1.2
--Coloured bands go purple when price is below the volume-weighted mIdBaNd!

[feeble] TrenderEver wondered which way the price is trending?!
feeble Trender™ **BETA** shows the trend based on middle crossings in different timeframes, volume weighting and volatility (std Deviations)
--The indicator displays the same on any timeframe.
--Select a FROM and TO period
--Use DuPLiCaToR to make 12 copies - use values between 0.8-1.2
--Coloured bands go purple when price is below the volume-weighted mIdBaNd!
--Shows the trend on a few different scales!!