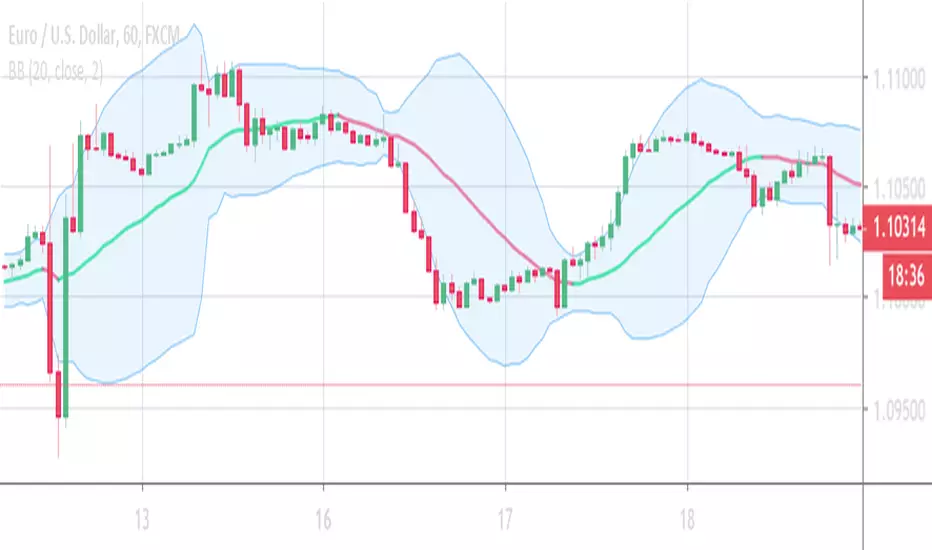
HLC Bollinger BandsThis is just a Bollinger band indicator that uses the highs & lows in addition to the close in the calculation of volatility / deviations from average. These bands will be slightly wider than regular Bollingers as a result.
I've found it useful with very short lookback lengths (3 to 5) for identifying periods when the bands are contracted... usually leads to an expansion of volatilty, so good for scalps.
Enjoy.
Cari dalam skrip untuk "bollingerband"


Double Bollinger BandsOn fundamentally strong stocks for entry points. The area in the Gray lines is the best one to enter and reasonable valuation. The area in the Red lines indicates higher Valuation. The area in the Green lines indicates lower Valuation and better to be careful and avoid.

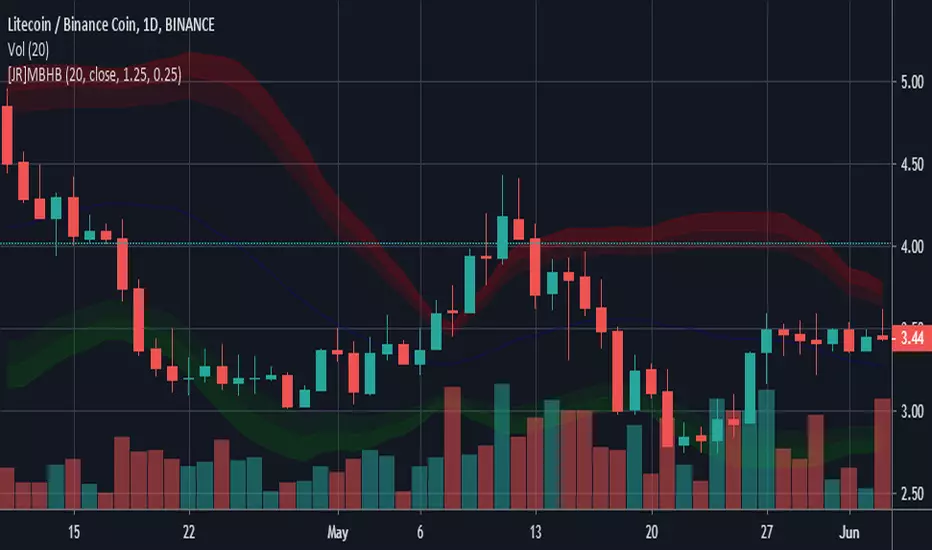
Bollinger Bands Changing ColorOriginal Bollinger Bands but the basis line changes color when the slope is positive or negative
If slope is positive the color is green (or lime)
If slope is negative the color is red
If slope is flat the color is black
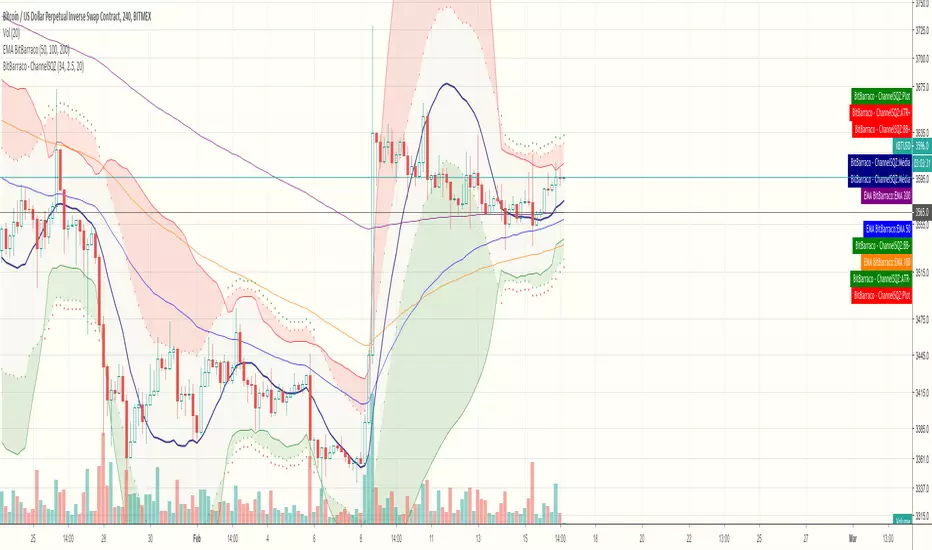
EMA Bollinger BandsThis is a simple Bollinger Bands indicator that uses the exponential moving average instead of the simple moving average.


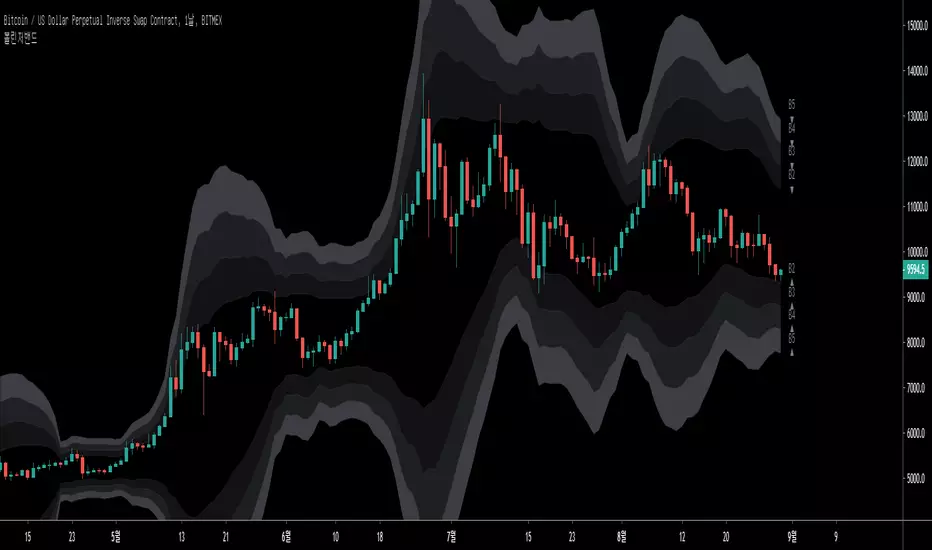

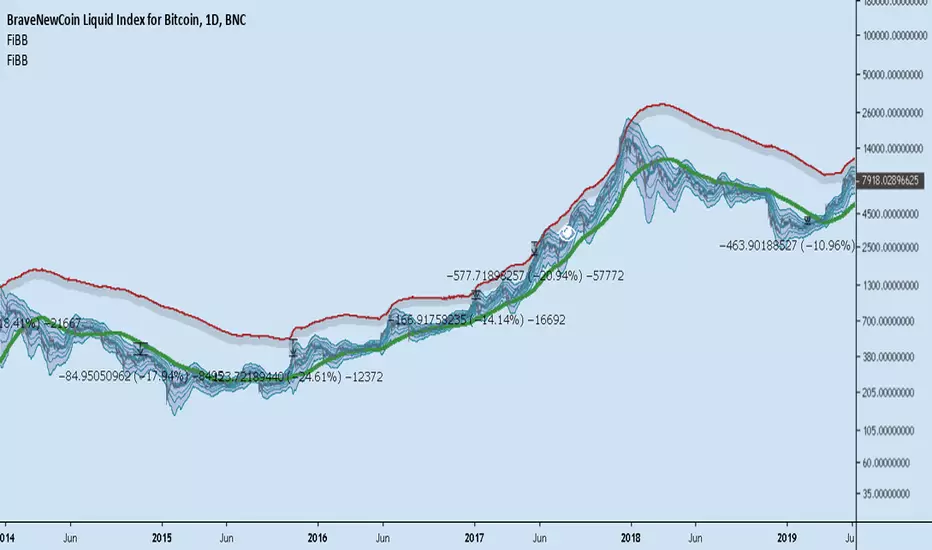
BolingerBands_Contraction_Bitcoin_dailyThe script visualises the contraction or tightness of the Bollinger Bands (example Bitcoin on the daily timeframe). The contraction values have to be adjusted for each asset/coin/stock and timeframe. See what works for you.

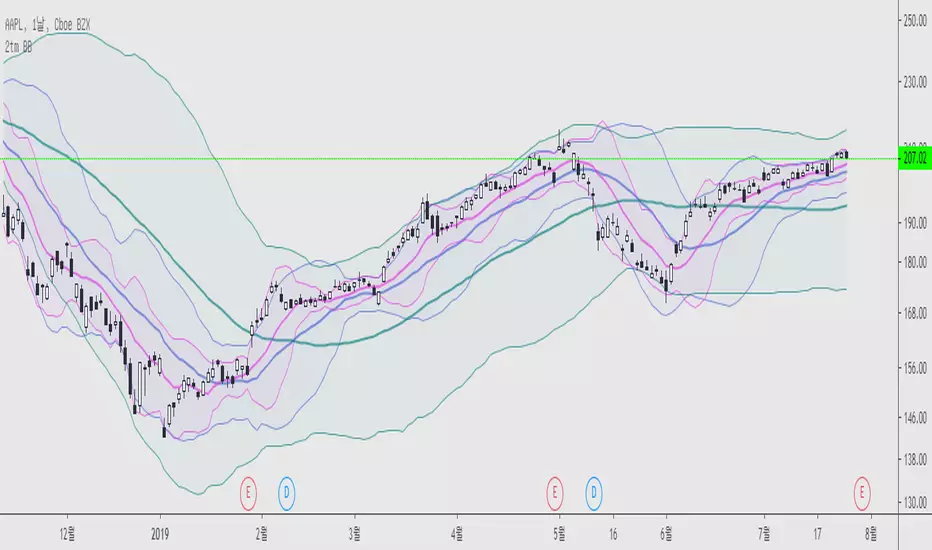
Triple Bollinger Bands by 2tmThis script is a bundle of three Bollinger bands.
These are the basic settings, the short-time settings, and the long-time settings.
You can customize the length of the moving averages, the standard deviation and the color of each line.
Thank you and wish your successful investment.
Bollinger Bands, multi toolBollinger bands multi tool.
The user is allowed to turn on/off four sets of bollinger bands.
The calculation uses simple moving average as default.
However have other options:
Basis options:
options : "SMA", "EMA", "WMA", "VWMA", "SMMA", "DEMA", "TEMA", "HullMA", "LSMA", "VWAP"
Basis can be turned on/off.
The tool allows the user to adjust standard deviation and period.
Two bands with same timeframe as used on chart.
Two bands with option to choose different timeframe.
Very powerfull tool to identify important pivots in volatility analysis.
But can also be used to identify

4x Bollinger Bands EMA SMA VWAPUltimate Bollinger Bands that you can configure manually in many ways.
-Turn on and off all bands.
-Auto settings for different time frame
-Squeezed
-EMA SMA VWAP
-2 Color themes
...
The Best Bollinger Band

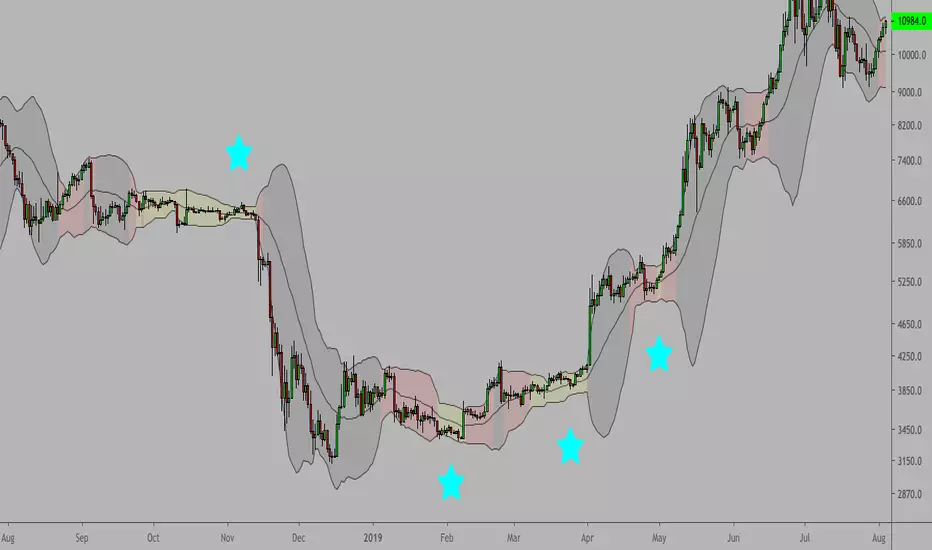
SuperSpecial_Buy_And_Sell Indicator (Crypto,Forex,Stocks)This indicator can be used on Crypto coins, Forex and Stocks. Don't work as expected in volatile market where there are sudden dips or lifts.
Please trade with care and after reading other indicators in conjunction with this.
Disclaimer: Please use the indicator at your own risk, the publisher don't take any responsibility for your loss.


BB Over Bought / Sold MTF// Enter a long position or exit a short position when all bands concentrate below 0.15 in lime color.
// Exit a long position or enter a short position when all bands concentrate above 0.9 in fuchsia color.

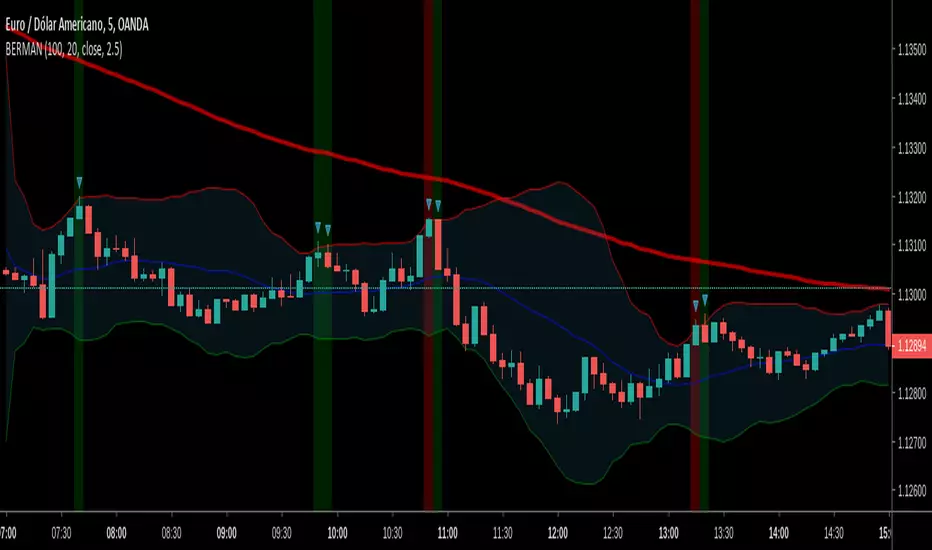
berman idicatorScript do indicaor Berman
Entradas Sempre para a expiraçao da vela de M5 quando O indicador mostra Um X No candle
Multi-TimeFrame Bollinger BandsMulti-timeframe bollinger band
This script generates higher timeframe bollinger band in a lower timeframe chart, which can be used to find better reference of entry and exit.

Bollinger ratioSo this indicator is hybrid of MACD and Bollinger
The aim here is to see where the direction of the Bollinger is going to the zero up or down . if it above the zero line or bellow it
I add bullish area and bearish area by the ratio of donchian channel
