Cari dalam skrip untuk "bollingerband"

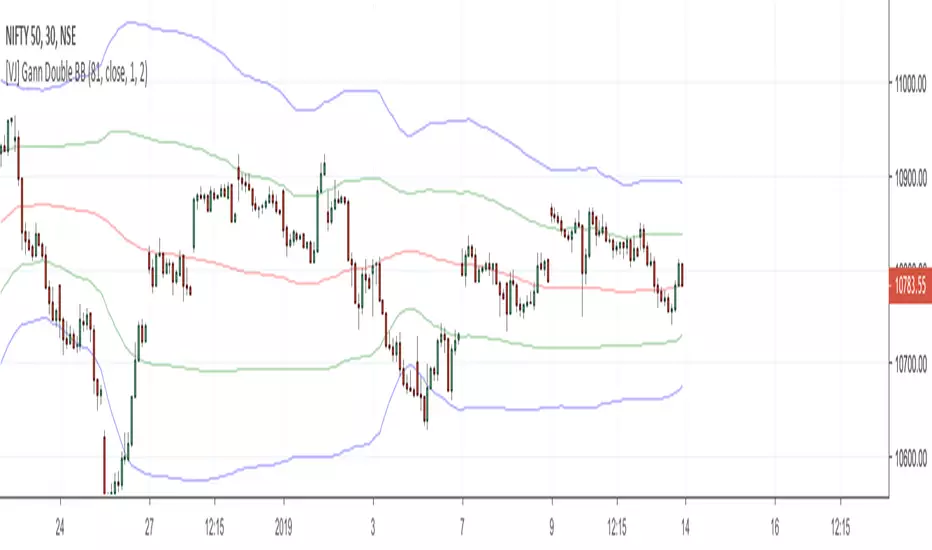
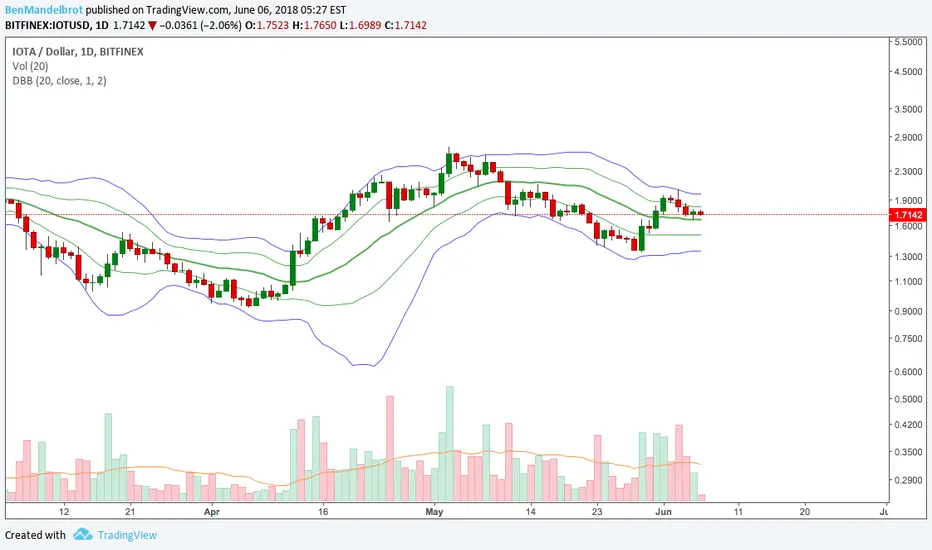
[VJ] Gann Double BBTry to form rules around this. Very profitable - start from - 2SD to +1SD for buy with intermediate bands as SL. vice versa for sell
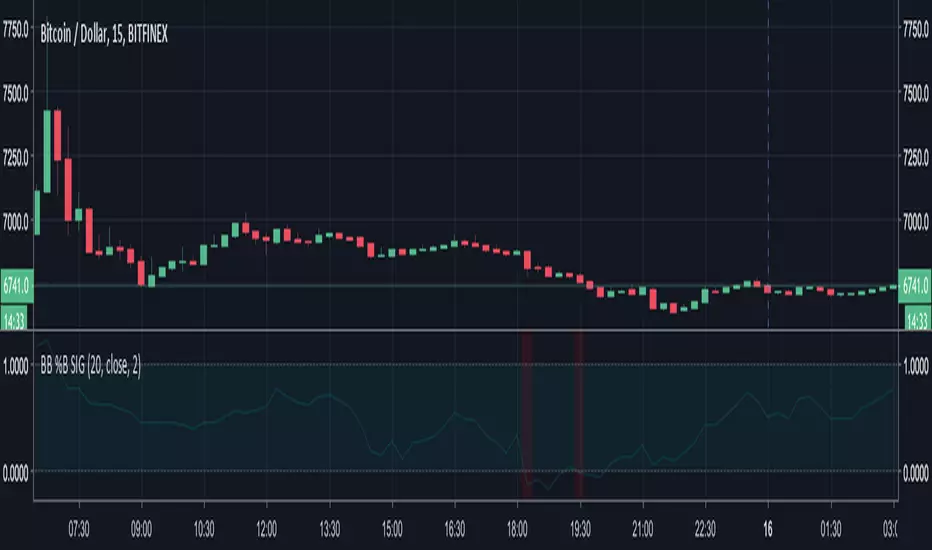
Bollinger Bands %BA better Bollinger Bands %B indicator with coloring and alerts.
Note: I'm using dark theme and white colored lines are good to me, if you are using white background, you can adjust the colors on Style section.


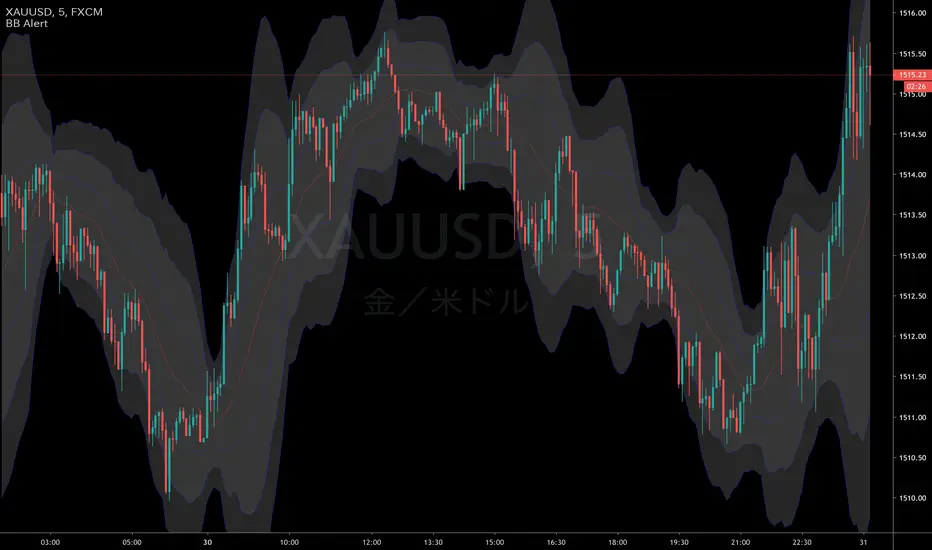
Bollinger Bands with AlertTriple Bollinger Bands with Alert
select BB 1-3
select source outside/inside
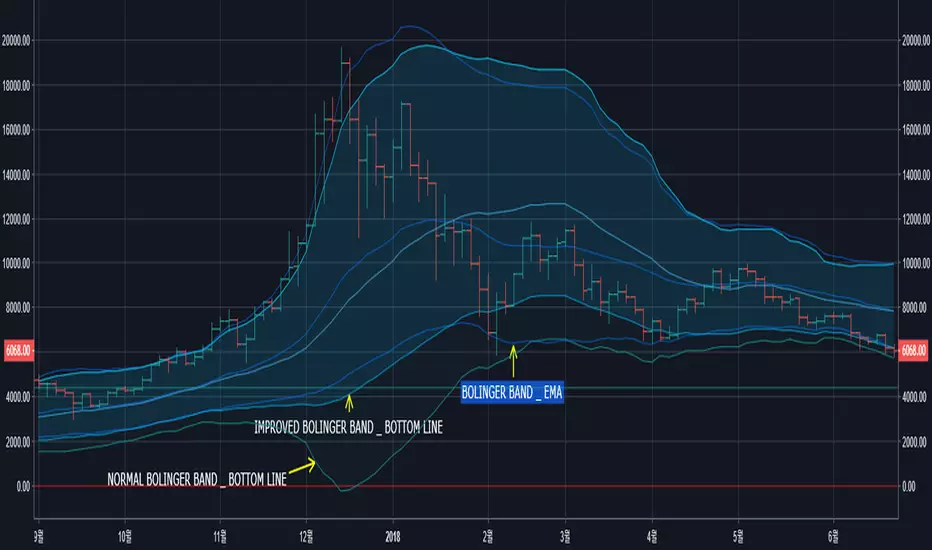
[SC] Bolinger Band - improved bottom line & emaThe bottom line of this Bollinger Band does not go below 0.
This indicator also provides a Bollinger band based on EMA.
RubberbandJust highlights a candle if the high is above the upper Bollinger Band or the low is below the lower Bollinger Band . BB defaults to 3SD. Anything less will happen to frequently.

RubberbandJust highlights a candle if the high is above the upper Bollinger Band or the low is below the lower Bollinger Band . BB defaults to 3SD. Anything less will happen to frequently.

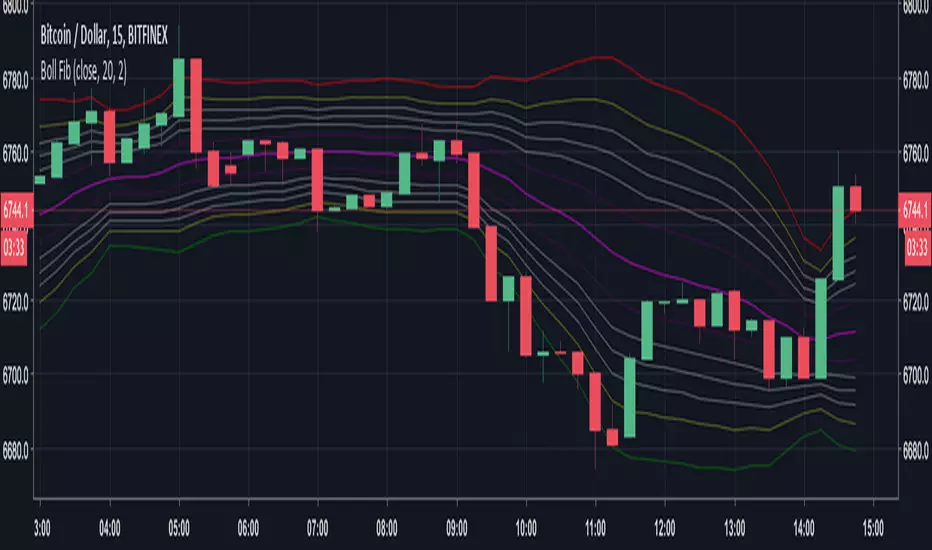
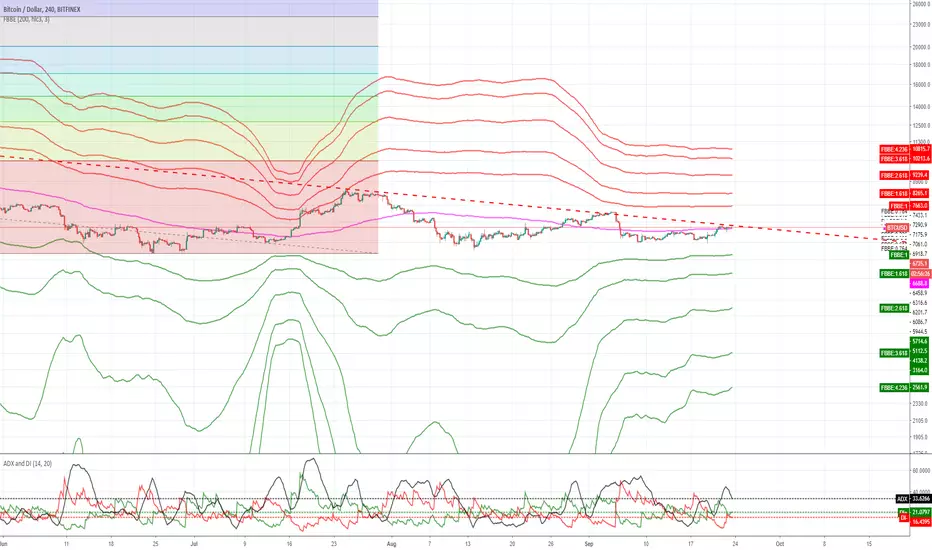
Fibonacci Bollinger Bands ExtendedAdded fibonacci extentions to -rashads script'
shows fibonacci retentions and extentions..
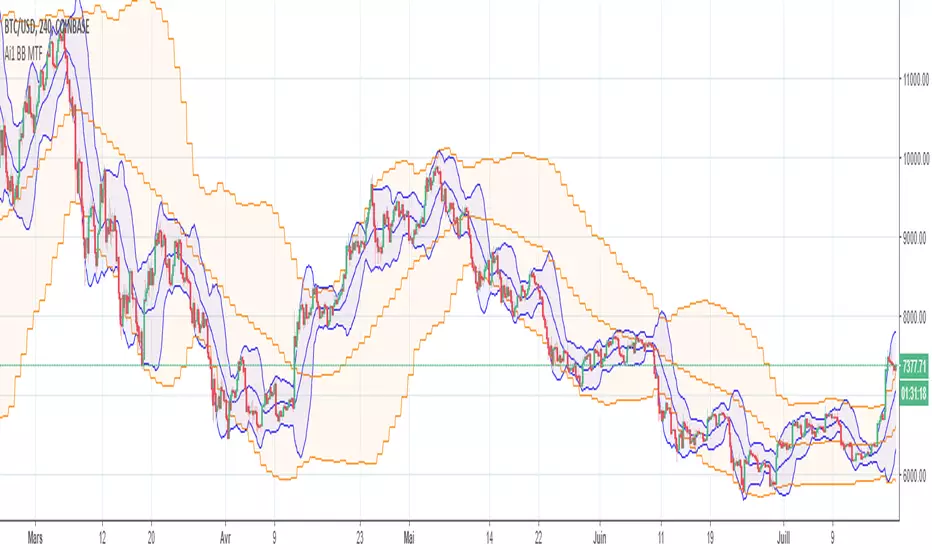
All-in-One Solutions - Bollinger Bands MTF (BB incl Log Scale)Hello,
This indicator is able to plot up to 2 Bollinger Bands in different time frames.
This indicator also solves the issue encountered with TradingView BB in Log scale :
Here is a screenshot of the menu you will have access to:
imgur.com
The alerts are also fully functional if you want to be alerted when value crosses a upper or lower band :
imgur.com
Please contact me in order to get access to this indicator. Please note that by subscribing to my offer, you will have access to all indicators I made and and the futur indicators I will develop according to the demand of the community.
After subscribing, all indicators will be added into your "under invitation indicators list" or you can have a look on my Tradingview page: fr.tradingview.com
I hope my indicators will help you !
MG - Bollinger band alerts- Displays the Bollinger Bands for standard deviation coefficients 2 & 3 (can toggle both independently)
- Has four preset alerts
- Price reached upper band (SD = 3)
- Price reached upper band (SD = 2)
- Price reached lower band (SD = 2)
- Price reached lower band (SD = 3)


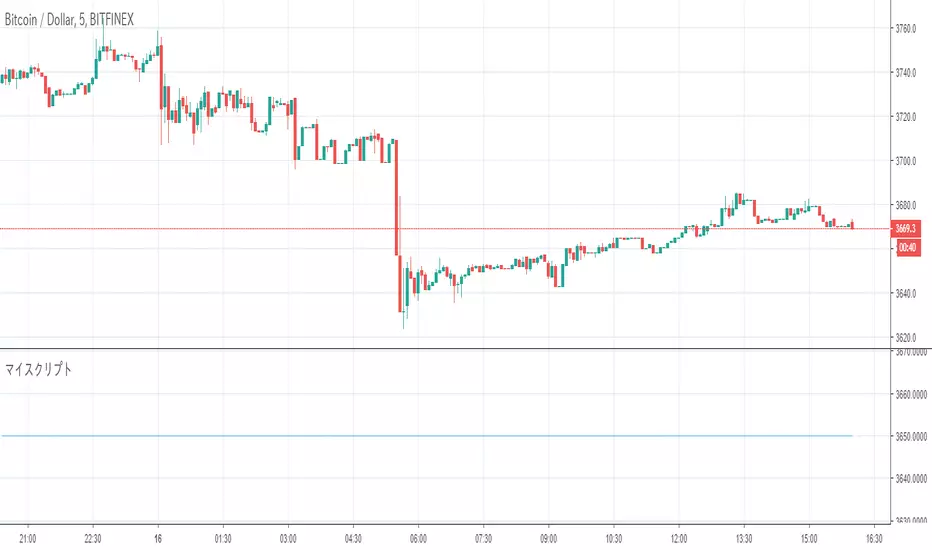
(Alerts+Strategy)Noro's Bands Scalper Strategy v1.6Alerts for @noro strategy
Using with autoview.with.pink


K3 Bollinger BandsBollinger Bands made more appealing.
Includes an editable indicator for when the price closes above or below the bands.

Trendstone Volatility Adjusted Bands v1.0The idea of the indicator is to show overbought and oversold situations. Whenever something moves outside of the middle channel to any of the R bands, the prices tend to stage violent counter-moves. Can be used for long term flags using 2h to 4h values or short-term swings with 5m to 45m.
