RSI & Backed-Weighted MA StrategyRSI & MA Strategy :
INTRODUCTION :
This strategy is based on two well-known indicators that work best together: the Relative Strength Index (RSI) and the Moving Average (MA). We're going to use the RSI as a trend-follower indicator, rather than a reversal indicator as most are used to. To the signals sent by the RSI, we'll add a condition on the chart's MA, filtering out irrelevant signals and considerably increasing our winning rate. This is a medium/long-term strategy. There's also a money management method enabling us to reinvest part of the profits or reduce the size of orders in the event of substantial losses.
RSI :
The RSI is one of the best-known and most widely used indicators in trading. Its purpose is to warn traders when an asset is overbought or oversold. It was designed to send reversal signals, but we're going to use it as a trend indicator by increasing its length to 20. The RSI formula is as follows :
RSI (n) = 100 - (100 / (1 + (H (n)/L (n))))
With n the length of the RSI, H(n) the average of days closing above the open and L(n) the average of days closing below the open.
MA :
The Moving Average is also widely used in technical analysis, to smooth out variations in an asset. The SMA formula is as follows :
SMA (n) = (P1 + P2 + ... + Pn) / n
where n is the length of the MA.
However, an SMA does not weight any of its terms, which means that the price 10 days ago has the same importance as the price 2 days ago or today's price... That's why in this strategy we use a RWMA, i.e. a back-weighted moving average. It weights old prices more heavily than new ones. This will enable us to limit the impact of short-term variations and focus on the trend that was dominating. The RWMA used weights :
The 4 most recent terms by : 100 / (4+(n-4)*1.30)
The other oldest terms by : weight_4_first_term*1.30
So the older terms are weighted 1.30 more than the more recent ones. The moving average thus traces a trend that accentuates past values and limits the noise of short-term variations.
PARAMETERS :
RSI Length : Lenght of RSI. Default is 20.
MA Type : Choice between a SMA or a RWMA which permits to minimize the impact of short term reversal. Default is RWMA.
MA Length : Length of the selected MA. Default is 19.
RSI Long Signal : Minimum value of RSI to send a LONG signal. Default is 60.
RSI Short signal : Maximum value of RSI to send a SHORT signal. Default is 40.
ROC MA Long Signal : Maximum value of Rate of Change MA to send a LONG signal. Default is 0.
ROC MA Short signal : Minimum value of Rate of Change MA to send a SHORT signal. Default is 0.
TP activation in multiple of ATR : Threshold value to trigger trailing stop Take Profit. This threshold is calculated as multiple of the ATR (Average True Range). Default value is 5 meaning that to trigger the trailing TP the price need to move 5*ATR in the right direction.
Trailing TP in percentage : Percentage value of trailing Take Profit. This Trailing TP follows the profit if it increases, remaining selected percentage below it, but stops if the profit decreases. Default is 3%.
Fixed Ratio : This is the amount of gain or loss at which the order quantity is changed. Default is 400, which means that for each $400 gain or loss, the order size is increased or decreased by a user-selected amount.
Increasing Order Amount : This is the amount to be added to or subtracted from orders when the fixed ratio is reached. The default is $200, which means that for every $400 gain, $200 is reinvested in the strategy. On the other hand, for every $400 loss, the order size is reduced by $200.
Initial capital : $1000
Fees : Interactive Broker fees apply to this strategy. They are set at 0.18% of the trade value.
Slippage : 3 ticks or $0.03 per trade. Corresponds to the latency time between the moment the signal is received and the moment the order is executed by the broker.
Important : A bot has been used to test the different parameters and determine which ones maximize return while limiting drawdown. This strategy is the most optimal on BITSTAMP:ETHUSD with a timeframe set to 6h. Parameters are set as follows :
MA type: RWMA
MA Length: 19
RSI Long Signal: >60
RSI Short Signal : <40
ROC MA Long Signal : <0
ROC MA Short Signal : >0
TP Activation in multiple ATR : 5
Trailing TP in percentage : 3
ENTER RULES :
The principle is very simple:
If the asset is overbought after a bear market, we are LONG.
If the asset is oversold after a bull market, we are SHORT.
We have defined a bear market as follows : Rate of Change (20) RWMA < 0
We have defined a bull market as follows : Rate of Change (20) RWMA > 0
The Rate of Change is calculated using this formula : (RWMA/RWMA(20) - 1)*100
Overbought is defined as follows : RSI > 60
Oversold is defined as follows : RSI < 40
LONG CONDITION :
RSI > 60 and (RWMA/RWMA(20) - 1)*100 < -1
SHORT CONDITION :
RSI < 40 and (RWMA/RWMA(20) - 1)*100 > 1
EXIT RULES FOR WINNING TRADE :
We have a trailing TP allowing us to exit once the price has reached the "TP Activation in multiple ATR" parameter, i.e. 5*ATR by default in the profit direction. TP trailing is triggered at this point, not limiting our gains, and securing our profits at 3% below this trigger threshold.
Remember that the True Range is : maximum(H-L, H-C(1), C-L(1))
with C : Close, H : High, L : Low
The Average True Range is therefore the average of these TRs over a length defined by default in the strategy, i.e. 20.
RISK MANAGEMENT :
This strategy may incur losses. The method for limiting losses is to set a Stop Loss equal to 3*ATR. This means that if the price moves against our position and reaches three times the ATR, we exit with a loss.
Sometimes the ATR can result in a SL set below 10% of the trade value, which is not acceptable. In this case, we set the SL at 10%, limiting losses to a maximum of 10%.
MONEY MANAGEMENT :
The fixed ratio method was used to manage our gains and losses. For each gain of an amount equal to the value of the fixed ratio, we increase the order size by a value defined by the user in the "Increasing order amount" parameter. Similarly, each time we lose an amount equal to the value of the fixed ratio, we decrease the order size by the same user-defined value. This strategy increases both performance and drawdown.
Enjoy the strategy and don't forget to take the trade :)
Cari dalam skrip untuk "bot"

Narrow Range StrategyNarrow Range Strategy :
INTRODUCTION :
This strategy is based on the Narrow Range Day concept, implying that low volatility will generate higher volatility in the days ahead. The strategy sends us buy and sell signals with well-defined profit targets. It's a medium/long-term strategy. There's also a money management method that allows us to reinvest part of the profits or reduce the size of orders in the event of substantial losses.
NARROW RANGE (NR) DAY :
A Narrow Range Day is a day in which price variations are included in those of a specific day some time before. The high and low of this specific day form the "reference range". In general, we compare these variations with those of 4 or 7 days ago. The mathematical formula for finding an NR4 is :
If low > low(4) and high < high(4) :
nr = true
This implies that the current low is greater than the low of 4 days ago, and the current high is smaller than the high of 4 days ago. So today's volatility is lower than that of 4 days ago, and may be a sign of high volatility to come.
PARAMETERS :
Narrow Range Length : Corresponds to the number of candles back to compare current volatility. The default is 4, allowing comparison of current volatility with that of 4 candles ago.
Stop Loss : Percentage of the reference range on which to set an exit order to limit losses. The minimum value is 0.001, while the maximum is 1. The default value is 0.35.
Fixed Ratio : This is the amount of gain or loss at which the order quantity is changed. The default is 400, which means that for each $400 gain or loss, the order size is increased or decreased by an amount chosen by the user.
Increasing Order Amount : This is the amount to be added to or subtracted from orders when the fixed ratio is reached. The default is $200, which means that for every $400 gain, $200 is reinvested in the strategy. On the other hand, for every $400 loss, the order size is reduced by $200.
Initial capital : $1000
Fees : Interactive Broker fees apply to this strategy. They are set at 0.18% of the trade value.
Slippage : 3 ticks or $0.03 per trade. Corresponds to the latency time between the moment the signal is received and the moment the order is executed by the broker.
Important : A bot was used to test NR4 and NR7 with all possible Stop Losses in order to find out which combination generates the highest return on BITSTAMP:ETHUSD while limiting the drawdown. This strategy is the most optimal with an NR4 and a SL of 35% of the reference range size in 5D timeframe.
BUY AND SHORT SIGNALS :
When an NR is spotted, we create two stop orders on the high and low of the reference range. As soon as there's a breakout from this reference range (shown in blue on the chart), we open a position. We're LONG if there's a breakout on the high and SHORT if there's a breakout on the low. Executing a stop order cancels the second stop order.
RISK MANAGEMENT :
This strategy is subject to losses. We manage our risk with Stop Losses. The user is free to enter a SL as a percentage of the reference range. The maximum amount risked per trade therefore depends on the size of the range. The larger the range, the greater the risk. That's why we have set a maximum Stop Loss to 10% to limiting risks per trade.
The special feature of this strategy is that it targets a precise profit objective. This corresponds to the size of the reference range at the top of the high if you're LONG, or at the bottom of the low if you're short. In the same way, the larger the reference range, the greater the potential profits.
The risk reward remains the same for all trades and amounts to : 100/35 = 2.86. If the reference range is too high, we have set a SL to 10% of the trade value to limit losses. In that case, the risk reward is less than 2.86.
MONEY MANAGEMENT :
The fixed ratio method was used to manage our gains and losses. For each gain of an amount equal to the value of the fixed ratio, we increase the order size by a value defined by the user in the "Increasing order amount" parameter. Similarly, each time we lose an amount equal to the value of the fixed ratio, we decrease the order size by the same user-defined value. This strategy increases both performance and drawdown.
NOTE :
Please note that the strategy is backtested from 2017-01-01. As the timeframe is 5D, this strategy is a medium/long-term strategy. That's why only 37 trades were closed. Be careful, as the test sample is small and performance may not necessarily reflect what may happen in the future.
Enjoy the strategy and don't forget to take the trade :)

Indian NIFTY Correlation Daytrade/Swing StrategyINTRODUCTION :
This is a daytrading/swing strategy designed mainly for indian market where internally has been adapted to NIFTY market and as well using for internal calculations the values of the candles from NIFTY asset.
With it we search to use with the most correlated asset from the indian market.
For this example I choosed BANKNIFTY
STRATEGY:
The strategy initially uses as candle values the data from the NIFTY asset.
With them I am dividing the work into two calculation parts such as :
-For first part logic, I am doing calculations regarding the volatility of NIFTY, where I initially take into consideration INDIAVIX to have an idea of the expected implied volatility of NIFTY asset and then I compare it with different tools such as ATR, BB and Percentile location of the volatility.
Based on all these factors I take into account the location of the volatility which is atm and if there is a possibility of a strong movement(trend) or sidemarket situation.
-Once I am done with the values of the volatility, the next process in the script logic is to start looking into the trend.
For it I am using different tools such as volume checker, support and resistence key points, pivot points, price actions patterns and different moving averages.
-Risk management part : once we are done with calculation for the entry, the next part is to have an idea where to exit. In this case I am making use of a dynamic risk management which is compressed from multiple ideas such as : we can exit if there were a big gap on the next day in our initial direction, we can also exit based of an internal daily ATR calculation value(we use initially 15min timeframe chart) and lastly if we are around some key points like support/resistence or other different chart patterns like double top, double bot and so on.
CASE EXAMPLE:
As I said before we are initially using for calculation the NIFTY chart with 15min timeframe. With it we can apply to any indian etf,stocks,future. All the assets are going to have the same time of entry and the same time of exit(we get this from NIFTY) and we plot it on the chart we are using, so its key point to look for assets which have a min 75-80% correlation with NIFTY. For this example I used BANKNIFTY chart.
So a type of entry would be this way
Lets assume NIFTY50 is on 19.000 level
INDIAVIX level is currently at 11 which can be translated : 11 / sqrt(250)
So 11 means that on a yearly base we expect the asset to move 11% upwards or downwards
and in a year we have aprox 250 days. So we divide the 11 by sqrt of 250 to get an idea of a daily expected move from the implied volatility of india VIX
11/15.87 = +-0.69%
So INDIAVIX tells us that the values for today nifty is 19000+0,69% and 19000-0.69%
After that I am looking into the daily ATR, and I see that the expected is around 0.8% and is ascending over the last 2 weeks.
Lastly I am looking at the percentile which is currently the volatility on both ATR and INDIAVIX, and I get a value of 90th percentile.
With this my biased is that we are going to expect a short trend, but i cant confirm on the volatility alone so next step is start looking into technical analysis.
I look at volume and is increasing, I look at different price actions paterns and pivots and I see a lower low and a lower high (a descending pattern).
I also see the price is below the key MA like SMA50/100/200, VWAP and so on.
With all of this I get more confirmation that the asset is in a short trend.
Internally once a certain specific % of confirmation from all the logics is achieved, it will trigger a long/short entry, so in this case lets assume we have 80% of our indicators pointing to the short, is going to enter a short.
Now for a long scenario the scene would be , indiavix is around 9,5, ATR is descending. We are around 40th percentile of the volatility.
Our asset is above multiple moving averages, vwap , etc
We have an increasing volume towards bullish side.
And so on( overall 75% of our indicators are pointing towards the long side)
Now for the exit, since we are dealing with a daytrade/swing mentality, short on average we keep the trade open for a less period of time than long ( 19 bars of 15min candles, compared to 57 bars of 15min for long) , so most of the times for short we are going to exit next day and if the trend is still in our favour we re enter the trade.
For long we can stay much more time, sometimes even weeks and we exit mainly when the % of confirmation of indicators point out a reversal/short confirmation fo a big pice action pattern.
STRATEGY RESULTS
For strategy analysis I have used BANKNIFTY NSE with deep history to get access to data from 2011 until present( giving more than 2500 trades) .
For inputs I am using 0.02% comission total ( the comission applied from ZERODHA indian exchange is close to 0.0175% total) so I used it a bit higher in order to take into account some slippages.
For capital THE REASON I USED 100% of the capital allocation is to make a proper comparison with the buy an hold from the same period
Lets assume we had an account of 1M ruppes initially in 2011, we start using 100% of it and then the new values automatically compounded with the new profits and losses so directly compare with 1M of rupees in shares on BANKNIFTY ETFs bought in 2011(buy n hold) until present day.
STRATEGY ACCESS
Strategy is free to be tested for everyone, just let me know in private that you wish to get access to it.

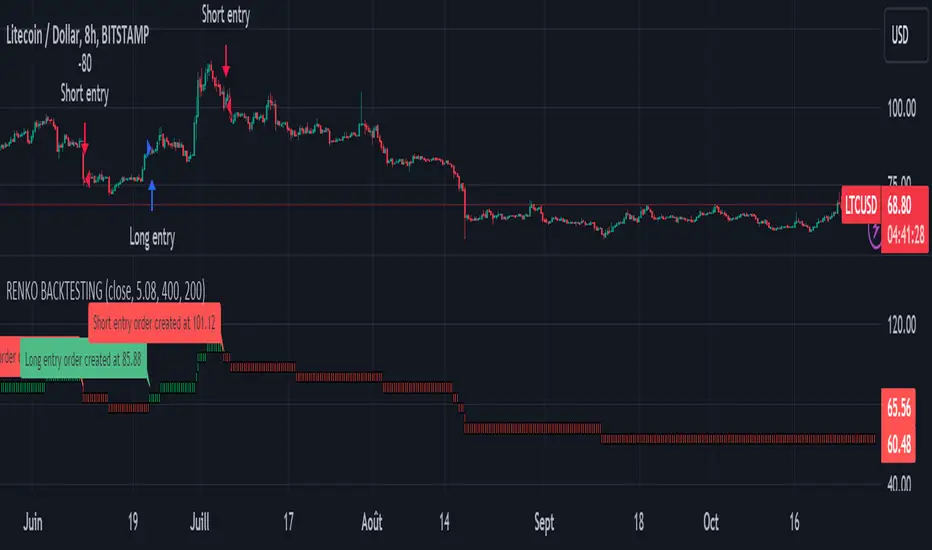
Renko StrategyRENKO STRATEGY
CAUTION : This strategy must be applied to a candlestick chart (not a Renko chart).
INTRODUCTION :
The Traditional Renko chart has been reproduced and is plotted according to the evolution of the price. It will enable us to receive buy or sell signals and follow major trends. This is a medium/long term strategy and depends a lot on the box size chosen in the parameters. There's also a money management method allowing us to reinvest part of the profits or reduce the size of orders in the event of substantial losses.
RENKO CHART :
Renko chart construction methodology :
The user must first choose the box size. The minimum is 0.00001 and there is no maximum. The default is 10. The user must then choose the source that will define the data on which the calculations will be based (high, low, open, close). By default, close is selected. The first candle on the chart is used to draw the first box with its high and low.
Each time the price changes by the amount of the box size relative to the high or low of the last box, a new box is added above or below the previous one. If price variations are less than the box size, the same box is added next to the previous one. If price variations are N (integer number) times greater than box size, N boxes are added above or below the previous one. Each box added above the previous one is a green box, while each box added below the previous one is a red box.
Conditions for drawing a green box above the previous one :
(source - high_of_the_last_box) / box_size > 1
Condition for drawing a red box below the previous one :
(low_of_the_last_box - source) / box_size > 1
If neither condition is triggered, the same box is drawn next to the previous one.
Example :
The last candle has drawn a box with low 12 and high 14. The box size is therefore 2. The strategy will look at the value of the close each time a candle ends. The current candle closes with a close equal to 15.5. As the variation from the previous high is only 1.5 (which is less than the box size), the same box is added next to the previous one. The next candle closes at 16.2. The price variation is therefore 2.2 compared with the previous high. We can now add a new green box just above the previous one, with a low of 14 and a high of 16. The same process applies if the candle's close is at least one box size below the low of the last box. In this case, a new red box is placed below the previous one.
PARAMETERS :
Source : Allows you to specify which data will be taken into account by the strategy when performing calculations. The default is close.
Box size : Size of Renko graph boxes. This is a very important parameter to choose carefully, as it has a strong impact on the strategy's performance. Defaults to 10.
Fixed Ratio : This is the amount of gain or loss at which the order quantity is changed. The default is 400, meaning that for each $400 gain or loss, the order size is increased or decreased by a user-selected amount.
Increasing Order Amount : This is the amount to be added to or subtracted from orders when the fixed ratio is reached. The default is $200, which means that for every $400 gain, $200 is reinvested in the strategy. On the other hand, for every $400 loss, the order size is reduced by $200.
Initial capital : $1000
Fees : Interactive Broker fees apply to this strategy. They are set at 0.18% of the trade value.
Slippage : 3 ticks or $0.03 per trade. Corresponds to the latency time between the moment the signal is received and the moment the order is executed by the broker.
Important : A bot has been used to test all possible box sizes to find out which one generates the highest return on BITSTAMP:LTCUSD while limiting the drawdown. This strategy is the most optimal with a box size equal to 5.08 in 8h timeframe.
BUY AND SHORT SIGNALS :
As the aim of this strategy is to follow major trends based on price movements, we need to be on the right side of price fluctuation. We trade every box reversal, i.e. we are LONG when the boxes are green indicating an uptrend and SHORT when they are red indicating a downtrend.
RISK MANAGEMENT :
This strategy can incur losses. The size of the box is decisive, as it is used to plot the RENKO chart and thus trigger buy or sell signals. It's also what allows us to manage risk. For every trade, we risk a maximum amount equal to 2 times the size of the box, i.e. :(5.08*2*nb_contract)/trade_value.
MONEY MANAGEMENT :
The fixed ratio method has been used to manage our gains and losses. For each gain of an amount equal to the value of the fixed ratio, we increase the order size by a value defined by the user in the "Increasing order amount" parameter. Similarly, each time we lose an amount equal to the value of the fixed ratio, we decrease the order size by the same user-defined value. This strategy not only increases our performance, but also our drawdown.
Enjoy the strategy and don't forget to take the trade :)
Bonsai BX (Backtester)In today's trading landscape, traders need precision and deep analytical tools to navigate the sea of strategies. The Bonsai Backtester is one such tool, meticulously designed to evaluate multiple trading strategies in an integrated manner.
═════════════════════════════════════════════════════════════════════════
🌳 Bonsai BX 🌳 Universal Strategy Testing
📘 Overview
A product of collaboration with the Bonsai community, this backtester is both a reflection of collective insights and a means to provide traders with data-driven insights on TradingView.
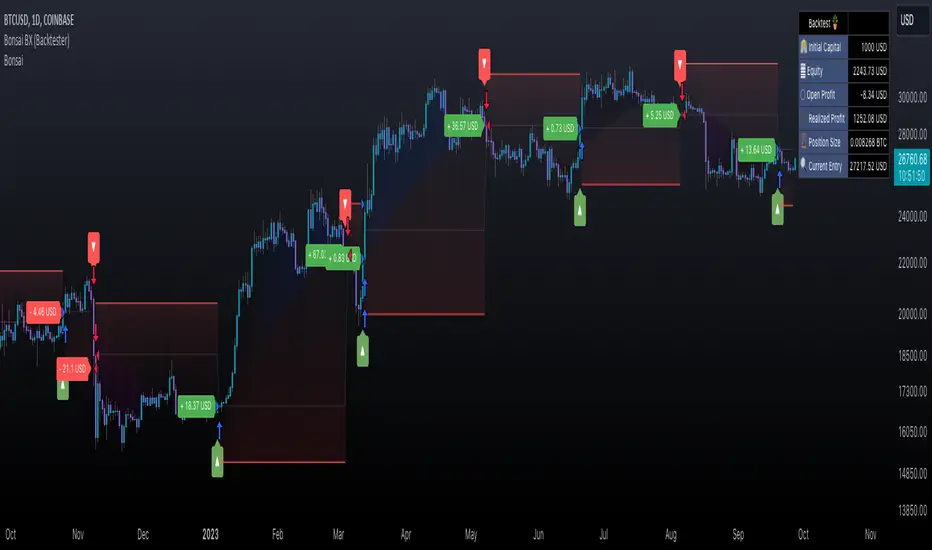
📌 Current Backtest
• Dataset: BTCUSD daily candles from Coinbase, starting from March 2015.
• Source Signals: The Bonsai indicator signals are employed for both long and short entries. These are directly visible on the publication chart.
• Trading Assumptions:
• Initial Capital: $1,000
• Maximum Position Size: 10% of equity per trade
• Stop Loss: 10% per position
• Commission: 0.1%
• Slippage: 100 ticks (1.00)
🛠 Key Features
The Bonsai BX is equipped with a range of features aimed at providing traders with a more comprehensive analysis environment:
Features on Chart
• External Indicator Adaptability: Easily incorporate signals from both built-in and custom TradingView indicators.
• Snapshot Table: Delivers on-the-spot insights into crucial strategy performance metrics, including equity, open profit, position size, and entry price. While these details are available in TradingView's 'Performance Summary' panel, we've integrated them directly onto the chart for a more streamlined and accessible viewing experience.
• Trade Labels: Visualize profit metrics for individual trades directly on the chart, allowing for a more immediate grasp of trade outcomes.
• Long & Short Behaviors: Modify long behaviors to either open new long positions while closing short ones, or simply to close short positions. Conversely, for short behaviors, opt to either initiate new short positions while closing any active long ones or simply close long positions.
• Multiple Signals Integration: The tool can currently handle up to three different external signals for long and short trades.
• Condition-based Initiation: Define whether longs and shorts are triggered when 'All Conditions Met' or just 'Any Single Condition Met'. This flexibility allows for a more nuanced trading approach. For example, if you're using a trade signal alongside the RSI, you can specify that a long position should only open when the trade signal is active and the RSI is below 30 at the same time. This lets you combine multiple signals or conditions for more precise trade initiation.
• TP & SL Customization:
• Single TP: Set a specific Take Profit percentage.
• SL: Define a Stop Loss percentage and choose between a standard or trailing stop.
• Trail From: Specify the starting point of the trailing stop, be it the breakeven point or a certain percentage.
• Interface Theme: Users can select between light and dark themes for their interface.
Performance and Trailing
🎛 Using Bonsai BX
1. Add it to your TradingView chart.
2. Adjust script parameters and settings. Integrate external indicator signals as needed.
3. Activate the backtester to refine trading strategies.
Backtester Settings Menu
🪝 Webhook (Beta)
The Webhook functionality, now in beta, augments the Bonsai BX utility. This feature offers a more intuitive method for users to direct webhooks to trading bots, exchanges, and brokers. It simplifies the process by eliminating the need to adjust JSON structures or other payload formats, making alert automation more accessible.
📜 Feedback & Community
The feedback from the Bonsai community has been instrumental in the tool's development and will continue to shape its evolution. As part of our commitment to adaptive, smart trading, this script will continually be updated to meet the ever-changing requirements of traders.
❗️ Disclaimer
Backtesting tools, including the Bonsai BX , simulate trading strategies based on historical data. The following key points should be kept in mind:
1. Past Performance is Not Predictive: While backtesting can offer insights, it's essential to understand that past performance does not guarantee or predict future results. Historical data might not account for future market changes or unforeseen events.
2. External Influences: Market outcomes can be significantly influenced by various external factors like geopolitical events, economic announcements, and sudden shifts in market sentiment. Such factors are often not considered in backtesting simulations.
3. Market Dynamics: Elements like market volatility, liquidity constraints, and slippage can drastically alter expected outcomes. These dynamics might not always be accurately represented in backtest simulations.
4. Limitations of Simulated Trades: Backtesting operates under the assumption that historical trends and patterns will replicate. However, market conditions evolve, and what worked in the past might not necessarily be viable in the future.
5. Informed Decisions: Always base your trading decisions on a mix of comprehensive research, current market analysis, and risk assessment. Relying solely on backtested results can lead to misconstrued perceptions and potential pitfalls.
Trading involves risks, and it's crucial to be fully informed and cautious before making any investment decisions. Always consider seeking advice from financial experts or professionals when in doubt.
Broadview Algorithmic StudioWelcome! This is the writeup for the Broadview Algorithmic Studio.
There are many unique features in this script.
- Broadview Underpriced & Overpriced
- Broadview Blackout Bollinger Bands
- Trailing Take Profit Suite
- Algorithmic Weights
- VSA Score
- Pip Change Log
- Activation Panel
- Weight Scanner
There are 116 primary inputs that allow users to algorithmically output unique DCA signal-sets. There are 85 inputs that allow users to control individual lengths, levels, thresholds, and multiplicative weights of the script. You will not find any other script with this many inputs, properly strung together for you to produce unlimited strategies for any market. The entire premise for the Broadview Algorithmic Studio is for users to be able to have extensive-cutting-edge features that allow them to produce more strategies, having control over every element that outputs a signal set. The number of unique strategies you can output with this script is VAST, and each continues to follow a safe DCA methodology.
This script is ready for use with 3Commas, interactive brokers, and other means of automation. It provides detailed information on Base Orders and Safety Orders, giving the number, cumulative spending, position average, and remaining balance for each SO in the series. Using this script we will explore the depths of strategic volume scaling, and the algorithms we use to determine spending.
Let me first start by saying the number of safe DCA-friendly signal-sets this script can output is absolutely staggering.
Let's limit the scope just to the Broadview Underpriced & Overpriced and Broadview Dominance indicators.
Each band of the Dominance Suite can be controlled individually with unique lengths, levels, and weights. This means the Dominance Suite can establish Bearish or Bullish dominance, in any market condition, and give it a unique overloading weight. The Broadview Underpriced & Overpriced indicator finally gives us the ability to establish these "market conditions" first with cycles. Of all the cycles this indicator establishes, the two primary are Underpriced & Overpriced. We determine this using a composite Overbought & Oversold with an Exponential Moving Average. So the script can now know, what cycle it is in, who is dominant during that cycle, and exactly how much weight in volume scaling the order should have.
Brand new is the ability for indicators of this level to be able to talk together in a single script. The Broadview Underpriced & Overpriced indicator and the Broadview Dominance indicator can inform one another across multiple vectors, create a unique market snapshot, and give that snapshot a unique weight every bar. The unique weight is compiled in the volume scaling math, thus giving us an automated-strategic-safe and quite efficient volume scaling for every order. In our coming updates we will explore this synergy to its very deepest layers. These indicators can be laced together in many ways, called vectors.
Only in the Algorithmic Studio do we explore these depths and yield those findings, features, and inputs to the user.
Let me take a quick break to explain another area-of-opportunity for our research and development.
The VSA Score is something we've tried before, but until the creation of the Broadview Blackout Bollinger Bands Auto Indicator it was not possible. The concept we want to explore is "Positional Honing". Over time we want users and the script itself to be able to understand the difference between a script-config that produces a high number of Hits, from a configuration that produces a high number of "Misses". The Volume Scaling Accuracy Score uses the BBB Auto Indicator as a heavily reliable, non-repainting, method of determining what the very-best signals for increased volume-scaling are.
Increased volume scaling is denoted by the near-white highlighter line running vertically. This line will either fall inside the BBB Auto Indicator bands (which are hidden), or, they will fall below and outside the BBB Auto bands. If increased spending happens inside the bands it's a "Miss". If increased spending happens below and outside the bands, it's a Hit. Oftentimes misses are actually pretty good spots for extra spending, which helps lower your position average, but Hits are always better. The Hits that the BBB Auto Indicator provides are extremely good.
Let's talk about the Trailing Take Profit Suite. This suite allows us to set a trailing take profit which is a feature that lets one maximize their profits. If the trailing take profit is engaged, then when the regular take profit is hit, it will trigger, denoted in red vertical lines, and the trailing take profit will look for a specified rate of change before it actually takes profit. This usually helps traders in those times when their regular take profit was set too low, allowing them to maximize their profits with a Trailing Take Profit.
For the moment, let's think about our scores. In the dashboard you'll notice a score beginning the Pip Change Log, the VSA Score, and the Activation Panel.
These scores use a new kind of logistic correlation formula where 4 digits are given to activation, rather than 1. This is to allow room for a future concept in AI we call "Deadzones" or you can think of it as impedance. This is not a bias in logistic regression. It's an entirely different concept. A neuron, which a perceptron attempts to mimic, has a bias.. but it also has a sort of electrical resistance. This is because a neuron is individually-alive entity. So a perceptron, as it were, would need to have both a bias and a natural resistance, or deadzone.
It is a lot of fun to watch the scores and how they react during playback. They tend to smooth trends but are also quite quick to correct to accuracy. In the future we will add the deadzones and biases to the scores. This should help both users and the script produce better signal sets. The Pip Change Log is an indicator that measures Rate of Change in Pips. This is one that I am particularly excited to study, as I am a huge fan of ROC. The Activation Panel shows these scores for 4 primary indicators: On Balance Volume, Relative Strength Index, Average Directional Index, and Average True Range.
Having the Pip Change Log, VSA Score, and Activation Panel up on the dashboard with their logistic correlation scores allows traders to study markets and setups quite intimately. The weight scanner at the bottom allows users to track the cumulative applied multiplicative weights during playback. The massive number of inputs, connected vectors of indicators, input-weights, lengths, levels, and thresholds sets up all the algorithmic infrastructure for powerusers to explore every idea and strategy output they could imagine. Also with the connected vector infrastructure we can deepen our indicators in a way where, "How they talk to each other.", comes first in every development conversation.
The Algorithmic Studio is for the Power-user.
These are not basic equations coming together to determine spending. This is a massive multi-layered-perceptron with everything from Trailing-Take-Profits to strategic-automatic algorithmic downscaling. The Broadview Algorithmic Studio gives a home to the poweruser who wants access to everything in a trading and investing AI, right up until the backpropagation. The Broadview Algorithmic Studio, gives users the ability to sit in the chair of the would-be AI.
Thank you.

Pineconnector Strategy TemplateHello traders
After getting five requests in a raw to convert an indicator into a backtest strategy with statistics + Metatrader MT4/MT5 bot using Pineconnector, I decided to publish this TradingView strategy plug-and-play template automatically generating the Pineconnector alerts for you.
Trial
A 4-day FREE TRIAL is available upon request.
I'll help you with the Expert Advisor configuration on Metatrader if needed.
Features
✅ Easily convert your TradingView Indicators into a Strategy with automatically generated alerts using the Pineconnector syntax.
Non-coders don't know how to send the entry price/SL/TP/etc information from TradingView to Pineconnector.
I made that automatic - the alert messages are automatically generated with the correct syntax based on the selected broker connected to your Metatrader.
For example, the OANDA tickers aren't the same as the EightCap tickers.
The template pre-selects the correct tickers for you, and I'll keep updating that tickers list whenever there is a ticker name update on the broker side.
✅ Select whether you want to create "at-market" or "limit" orders.
The alert messages are updated accordingly.
✅ Custom close condition
Some indicators may have a custom close trade condition
For example, A trader could decide to cut a trade if another indicator gives a signal in the opposite direction
In that case, the template alerts the Expert Advisor to close the opened trade(s).
✅ Includes a Stop-Loss, Take-Profit, Trailing Stop-Loss, Stop-Loss to breakeven features
The Stop-Loss/Take-Profit can be set in percentage or pips value.
The template sends those price values to the MetaTrader Expert Advisor.
✅ For a complicated TradingView script to connect or for more filters, we suggest selecting the "Custom Integration" option
A complex TradingView is any script involving a Zig Zag, divergences, Harmonic patterns, or similar logic.
If you don't know if the indicator(s) you want to connect is/are complex or not, please ask me in DM to have a look first.
Alerts
Important: When creating the alerts, select the option "Order fills and alert() function calls"
Leave the alert message field as is - It has already been pre-filled for you.
Need more information?
For more information, please send me a direct message or email.
Strategy Results from this post
Please note they're not relevant.
I connected a simple SMA cross indicator not to showcase the backtest statistics but the connection feature between a TradingView indicator script with this Pineconnector strategy template.
Dave

ATR GOD Strategy by TradeSmart (PineConnector-compatible)This is a highly-customizable trading strategy made by TradeSmart, focusing mainly on ATR-based indicators and filters. The strategy is mainly intended for trading forex , and has been optimized using the Deep Backtest feature on the 2018.01.01 - 2023.06.01 interval on the EUR/USD (FXCM) 15M chart, with a Slippage value of 3, and a Commission set to 0.00004 USD per contract. The strategy is also made compatible with PineConnector , to provide an easy option to automate the strategy using a connection to MetaTrader. See tooltips for details on how to set up the bot, and check out our website for a detailed guide with images on how to automate the strategy.
The strategy was implemented using the following logic:
Entry strategy:
A total of 4 Supertrend values can be used to determine the entry logic. There is option to set up all 4 Supertrend parameters individually, as well as their potential to be used as an entry signal/or a trend filter. Long/Short entry signals will be determined based on the selected potential Supertrend entry signals, and filtered based on them being in an uptrend/downtrend (also available for setup). Please use the provided tooltips for each setup to see every detail.
Exit strategy:
4 different types of Stop Losses are available: ATR-based/Candle Low/High Based/Percentage Based/Pip Based. Additionally, Force exiting can also be applied, where there is option to set up 4 custom sessions, and exits will happen after the session has closed.
Parameters of every indicator used in the strategy can be tuned in the strategy settings as follows:
Plot settings:
Plot Signals: true by default, Show all Long and Short signals on the signal candle
Plot SL/TP lines: false by default, Checking this option will result in the TP and SL lines to be plotted on the chart.
Supertrend 1-4:
All the parameters of the Supertrends can be set up here, as well as their individual role in the entry logic.
Exit Strategy:
ATR Based Stop Loss: true by default
ATR Length (of the SL): 100 by default
ATR Smoothing (of the SL): RMA/SMMA by default
Candle Low/High Based Stop Loss: false by default, recent lowest or highest point (depending on long/short position) will be used to calculate stop loss value. Set 'Base Risk Multiplier' to 1 if you would like to use the calculated value as is. Setting it to a different value will count as an additional multiplier.
Candle Lookback (of the SL): 50 by default
Percentage Based Stop Loss: false by default, Set the stop loss to current price - % of current price (long) or price + % of current price (short).
Percentage (of the SL): 0.3 by default
Pip Based Stop Loss: Set the stop loss to current price - x pips (long) or price + x pips (short). Set 'Base Risk Multiplier' to 1 if you would like to use the calculated value as is. Setting it to a different value will count as an additional multiplier.
Pip (of the SL): 10 by default
Base Risk Multiplier: 4.5 by default, the stop loss will be placed at this risk level (meaning in case of ATR SL that the ATR value will be multiplied by this factor and the SL will be placed that value away from the entry level)
Risk to Reward Ratio: 1.5 by default, the take profit level will be placed such as this Risk/Reward ratio is met
Force Exiting:
4 total Force exit on custom session close options: none applied by default. If enabled, trades will close automatically after the set session is closed (on next candle's open).
Base Setups:
Allow Long Entries: true by default
Allow Short Entries: true by default
Order Size: 10 by default
Order Type: Capital Percentage by default, allows adjustment on how the position size is calculated: Cash: only the set cash amount will be used for each trade Contract(s): the adjusted number of contracts will be used for each trade Capital Percentage: a % of the current available capital will be used for each trade
ATR Limiter:
Use ATR Limiter: true by default, Only enter into any position (long/short) if ATR value is higher than the Low Boundary and lower than the High Boundary.
ATR Limiter Length: 50 by default
ATR Limiter Smoothing: RMA/SMMA by default
High Boundary: 1000 by default
Low Boundary: 0.0003 by default
MA based calculation: ATR value under MA by default, If not Unspecified, an MA is calculated with the ATR value as source. Only enter into position (long/short) if ATR value is higher/lower than the MA.
MA Type: RMA/SMMA by default
MA Length: 400 by default
Waddah Attar Filter:
Explosion/Deadzone relation: Not specified by default, Explosion over Deadzone: trades will only happen if the explosion line is over the deadzone line; Explosion under Deadzone: trades will only happen if the explosion line is under the deadzone line; Not specified: the opening of trades will not be based on the relation between the explosion and deadzone lines.
Limit trades based on trends: Not specified by default, Strong Trends: only enter long if the WA bar is colored green (there is an uptrend and the current bar is higher then the previous); only enter short if the WA bar is colored red (there is a downtrend and the current bar is higher then the previous); Soft Trends: only enter long if the WA bar is colored lime (there is an uptrend and the current bar is lower then the previous); only enter short if the WA bar is colored orange (there is a downtrend and the current bar is lower then the previous); All Trends: only enter long if the WA bar is colored green or lime (there is an uptrend); only enter short if the WA bar is colored red or orange (there is a downtrend); Not specified: the color of the WA bar (trend) is not relevant when considering entries.
WA bar value: Not specified by default, Over Explosion and Deadzone: only enter trades when the WA bar value is over the Explosion and Deadzone lines; Not specified: the relation between the explosion/deadzone lines to the value of the WA bar will not be used to filter opening trades.
Sensitivity: 150 by default
Fast MA Type: SMA by default
Fast MA Length: 10 by default
Slow MA Type: SMA
Slow MA Length: 20 by default
Channel MA Type: EMA by default
BB Channel Length: 20 by default
BB Stdev Multiplier: 2 by default
Trend Filter:
Use long trend filter 1: false by default, Only enter long if price is above Long MA.
Show long trend filter 1: false by default, Plot the selected MA on the chart.
TF1 - MA Type: EMA by default
TF1 - MA Length: 120 by default
TF1 - MA Source: close by default
Use short trend filter 1: false by default, Only enter long if price is above Long MA.
Show short trend filter 1: false by default, Plot the selected MA on the chart.
TF2 - MA Type: EMA by default
TF2 - MA Length: 120 by default
TF2 - MA Source: close by default
Volume Filter:
Only enter trades where volume is higher then the volume-based MA: true by default, a set type of MA will be calculated with the volume as source, and set length
MA Type: RMA/SMMA by default
MA Length: 200 by default
Date Range Limiter:
Limit Between Dates: false by default
Start Date: Jan 01 2023 00:00:00 by default
End Date: Jun 24 2023 00:00:00 by default
Session Limiter:
Show session plots: false by default, show market sessions on chart: Sidney (red), Tokyo (orange), London (yellow), New York (green)
Use session limiter: false by default, if enabled, trades will only happen in the ticked sessions below.
Sidney session: false by default, session between: 15:00 - 00:00 (EST)
Tokyo session: false by default, session between: 19:00 - 04:00 (EST)
London session: false by default, session between: 03:00 - 11:00 (EST)
New York session: false by default, session between: 08:00 - 17:00 (EST)
Trading Time:
Limit Trading Time: true by default, tick this together with the options below to enable limiting based on day and time
Valid Trading Days Global: 123567 by default, if the Limit Trading Time is on, trades will only happen on days that are present in this field. If any of the not global Valid Trading Days is used, this field will be neglected. Values represent days: Sunday (1), Monday (2), ..., Friday (6), Saturday(7) To trade on all days use: 123457
(1) Valid Trading Days: false, 123456 by default, values represent days: Sunday (1), Monday (2), ..., Friday (6), Saturday(7) The script will trade on days that are present in this field. Please make sure that this field and also (1) Valid Trading Hours Between is checked
(1) Valid Trading Hours Between: false, 1800-2000 by default, hours between which the trades can happen. The time is always in the exchange's timezone
All other options are also disabled by default
PineConnector Automation:
Use PineConnector Automation: false by default, In order for the connection to MetaTrader to work, you will need do perform prerequisite steps, you can follow our full guide at our website, or refer to the official PineConnector Documentation. To set up PineConnector Automation on the TradingView side, you will need to do the following:
1. Fill out the License ID field with your PineConnector License ID;
2. Fill out the Risk (trading volume) with the desired volume to be traded in each trade (the meaning of this value depends on the EA settings in Metatrader. Follow the detailed guide for additional information);
3. After filling out the fields, you need to enable the 'Use PineConnector Automation' option (check the box in the strategy settings);
4. Check if the chart has updated and you can see the appropriate order comments on your chart;
5. Create an alert with the strategy selected as Condition, and the Message as {{strategy.order.comment}} (should be there by default);
6. Enable the Webhook URL in the Notifications section, set it as the official PineConnector webhook address and enjoy your connection with MetaTrader.
License ID: 60123456789 by default
Risk (trading volume): 1 by default
NOTE! Fine-tuning/re-optimization is highly recommended when using other asset/timeframe combinations.

D-BoT Alpha 'Short' SMA and RSI StrategyDostlar selamlar,
İşte son derece basit ama etkili ve hızlı, HTF de çok iyi sonuçlar veren bir strateji daha, hepinize bol kazançlar dilerim ...
Nedir, Nasıl Çalışır:
Strateji, iki ana girdiye dayanır: SMA ve RSI. SMA hesaplama aralığı 200 olarak, RSI ise 14 olarak ayarlanmıştır. Bu değerler, kullanıcı tercihlerine veya geriye dönük test sonuçlarına göre ayarlanabilir.
Strateji, iki koşul karşılandığında bir short sinyali oluşturur: RSI değeri, belirlenen bir giriş seviyesini (burada 51 olarak belirlenmiş) aşar ve kapanış fiyatı SMA değerinin altındadır.
Strateji, kısa pozisyonu üç durumda kapatır: Kapanış fiyatı, takip eden durdurma seviyesinden (pozisyon açıldığından beri en düşük kapanış olarak belirlenmiştir) büyükse, RSI değeri belirlenen bir durdurma seviyesini (bu durumda 54) aşarsa veya RSI değeri belirli bir kar al seviyesinin (bu durumda 32) altına düşerse.
Güçlü Yönleri:
İki farklı gösterge (SMA ve RSI) kullanımı, yalnızca birini kullanmaktan daha sağlam bir sinyal sağlayabilir.
Strateji, karları korumaya ve fiyat dalgalanmalarında kayıpları sınırlamaya yardımcı olabilecek bir iz süren durdurma seviyesi içerir.
Script oldukça anlaşılır ve değiştirmesi nispeten kolaydır.
Zayıf Yönleri:
Strateji, hacim, oynaklık veya daha geniş piyasa eğilimleri gibi diğer potansiyel önemli faktörleri göz önünde bulundurmaz.
RSI seviyeleri ve SMA süresi için belirli parametreler sabittir ve tüm piyasa koşulları veya zaman aralıkları için optimal olmayabilir.
Strateji oldukça basittir. Trade maliyetini (kayma veya komisyonlar gibi) hesaba katmaz, bu da trade performansını önemli ölçüde etkileyebilir.
Bu Stratejiyle Nasıl İşlem Yapılır:
Strateji, short işlemler için tasarlanmıştır. RSI, 51'in üzerine çıktığında ve kapanış fiyatı 200 periyotluk SMA'nın altında olduğunda işleme girer. RSI, 54'ün üzerine çıktığında veya 32'nin altına düştüğünde veya fiyat, pozisyon açıldığından beri en düşük kapanış fiyatının üzerine çıktığında işlemi kapatır.
Lütfen Dikkat, bu strateji veya herhangi bir strateji izole bir şekilde kullanılmamalıdır. Tüm bu çalışmalar eğitsel amaçlıdır. Yatırım tavsiyesi içermez.
This script defines a trading strategy based on Simple Moving Average (SMA) and the Relative Strength Index (RSI) indicators. Here's an overview of how it works, along with its strengths and weaknesses, and how to trade using this strategy:
How it works:
The strategy involves two key inputs: SMA and RSI. The SMA length is set to 200, and the RSI length is set to 14. These values can be adjusted based on user preferences or back-testing results.
The strategy generates a short signal when two conditions are met: The RSI value crosses over a defined entry level (set at 51 here), and the closing price is below the SMA value.
When a short signal is generated, the strategy opens a short position.
The strategy closes the short position under three conditions: If the close price is greater than the trailing stop (which is set as the lowest close since the position opened), if the RSI value exceeds a defined stop level (54 in this case), or if the RSI value drops below a certain take-profit level (32 in this case).
Strengths:
The use of two different indicators (SMA and RSI) can provide a more robust signal than using just one.
The strategy includes a trailing stop, which can help to protect profits and limit losses as the price fluctuates.
The script is straightforward and relatively easy to understand and modify.
Weaknesses:
The strategy doesn't consider other potentially important factors, such as volume, volatility, or broader market trends.
The specific parameters for the RSI levels and SMA length are hard-coded, and may not be optimal for all market conditions or timeframes.
The strategy is very simplistic. It doesn't take into account the cost of trading (like slippage or commissions), which can significantly impact trading performance.
How to trade with this strategy:
The strategy is designed for short trades. It enters a trade when the RSI crosses above 51 and the closing price is below the 200-period SMA. It will exit the trade when the RSI goes above 54 or falls below 32, or when the price rises above the lowest closing price since the position was opened.
Please note, this strategy or any strategy should not be used in isolation. It's important to consider other aspects of trading such as risk management, capital allocation, and combining different strategies to diversify. Back-testing the strategy on historical data and demo trading before going live is also a recommended practice.

D-Bot Alpha RSI Breakout StrategyHello dear Traders,
Here is a simple yet effective strategy to use, for best profit higher time frame, such as daily.
Structure of the code
The code defines inputs for SMA (simple moving average) length, RSI (relative strength index) length, RSI entry level, RSI stop loss level, and RSI take profit level. The default values of these variables can be customized as per the user's preferences.
The script calculates SMA and RSI based on the input parameters and the closing price of the asset.
Trading logic
This strategy allows the placement of a long position when:
The RSI crosses above the RSI entry level and
The close price is above the SMA value.
After entering a long position, it applies a trailing stop mechanism. The stop price is updated to the close price if the close price is lower than the last close price.
The script closes the long position when:
RSI falls below the stop loss level.
RSI reaches or exceeds the take profit level.
If the trailing stop is activated (once RSI reaches or exceeds the take profit level), the closing price falls below the trailing stop level.
Strengths
The strategy includes mechanisms for entering a position, taking profit, and stopping losses, which are fundamental aspects of a trading strategy.
It applies a trailing stop mechanism that allows to capture further gains if the price keeps increasing while protecting from losses if the price starts to decrease.
Weaknesses
This strategy only contemplates long positions. Depending on the market situation, the strategy may miss opportunities for short selling when the market is on a downward trend.
The choice of the fixed RSI entry, stop loss, and take profit levels may not be ideal for all market conditions or assets. It might benefit from a more adaptive mechanism that adjusts these levels according to market volatility or trend.
The strategy doesn't factor in trading costs (such as spread or commission), which could have a significant impact on the net profit, especially if the user is trading with a high frequency or in a low liquidity market.
How to trade with this strategy
Given these parameters and the strategy outlined by the code, the trader would enter a long position when the RSI crosses above the RSI entry level (default 34) and the closing price is above the SMA value (SMA calculated with default period of 200). The trader would exit the position when either the RSI falls below the RSI stop loss level (default 30), or RSI rises above the RSI take profit level (default 50), or when the trailing stop is hit.
Remember "The strategies I have prepared are entirely for educational purposes and should not be considered as investment advice. Support your trades using other tools. Wishing everyone profitable trades..."

Premium MTF Layered RSI - Bitcoin Bot [wbburgin]This the premium version of my MTF Layered RSI strategy, which improves significantly on the original strategy (publicly available on my profile). Improvements are below. This strategy will also appear as an overlay on your chart. It is completely non-repainting.
The MTF Layered RSI strategy uses the current timeframe and two configurable higher timeframes to enter a long position when Bitcoin is oversold on all three timeframes, and exit the long position when Bitcoin is overbought on the current timeframe. This hedges against situations where the RSI on higher timeframes never reaches the overbought level and we are left "holding the bag" so to speak with the classic "enter long at oversold and enter short at overbought" strategy.
IMPORTANT: This strategy does not work on ranges. It will work on all timeframes and assets, but does not work on ranges (Renko blocks and some other advanced types of charts).
********** My Background
I am an investor, trader, and entrepreneur with 10 years of cryptocurrency and equity trading experience and founder of two fintech startups. I am a graduate of a prestigious university in the United States and carry broad and inclusive interests in mathematical finance, computer science, machine learning / artificial intelligence, as well as other fields.
**********
Improvements over the original MTF RSI strategy include:
Filters for Uptrends and Downtrends → The Premium RSI strategy will adjust its buy and sell thresholds depending on whether the instrument is trending. This means that, in uptrends, the Premium strategy will buy more frequently, bringing in potentially greater profit, and in downtrends, the strategy will stop buying altogether. These filters and dynamic buy/sell thresholds have made this strategy more profitable in my backtesting across random timeframes, but I cannot guarantee that the strategy will be profitable for you on the default settings. To that end, I have enabled a number of different configurations that you can change in the settings of the strategy.
Stop Loss / Take Profit Calculation Per Tick → Stop loss and take profit are now both enabled in the script and each has their own alerts. You can specify what type of stop loss or take profit you want: percentage or ATR. If you have alerts configured, you will be alerted mid-bar, instead of at close. This helps prevent loss from abrupt falls in price between closing price and next bar open.
Customizable Alert Messages In-Strategy → In the settings, there will be text boxes where you can create your own alerts. All you will need to do is create an alert in the alert panel on Tradingview and leave the message box blank - if you fill out the alert boxes in the settings, these will automatically populate into your alerts. There are in total eight different customizable alerts messages: Entry, Exit, Stop loss, and Take profit alerts for both Long and Short sides. If you disable stop loss and/or take profit, these alerts will also be disabled. Similarly, if you disable shorts, all short alerts will be disabled.
**********
Display
Configuring Stop Loss or Take Profit will make their corresponding displays appear.
Separately from the trading boxes, background colors (green, red) signify extended uptrends and downtrends, respectively.
Configuring Alerts
In TradingView desktop, go to the ‘Alerts’ tab on the right panel. Click the “+” button to create a new alert. Select this strategy for the condition and one of the two options that includes alert() function calls. Name the alert what you wish and clear the default message, because your text in the settings will replace this message.
Now that the alert is configured, you can go to the settings of the strategy and fill in your chosen text for the specific alert condition. You will need to check “Long and Short” in the “Trade Direction” setting in order for any Short Alerts to become active. Similarly, you will need to check “Enable Stop Loss” for stop loss alerts to become active and “Enable Take Profit” for take profit alerts to become active.
**********
Disclaimer
Copyright by wbburgin.
The information contained in my Scripts/Indicators/Algorithms does not constitute financial advice or a solicitation to buy or sell any securities of any type. I will not accept liability for any loss or damage, including without limitation any loss of profit, which may arise directly or indirectly from the use of or reliance on such information.
All investments involve risk, and the past performance of a security, industry, sector, market, financial product, trading strategy, backtest, or individual's trading does not guarantee future results or returns. Investors are fully responsible for any investment decisions they make. Such decisions should be based solely on an evaluation of their financial circumstances, investment objectives, risk tolerance, and liquidity needs.
**********
Notes on the Strategy Performance below: This is 3% of equity per trade, with a pyramiding number of 3. I did not include fees because Binance US on Bitcoin/USD does not charge fees on the instrument; however, I heavily encourage you to include fees in your backtesting if you use a different brokerage. To mitigate fees, this strategy is designed with a high average %/trade. If your current fees are greater than the strategy's average %/trade, I encourage you to choose a higher RSI period, such as 14 or 28, which will result in less trades but potentially a higher %/trade.

Risk Reward Calculator [lovealgotrading]
OVERVIEW:
This Risk Reward Calculator strategy can help you maximize your RR value with help of algorithmic trading.
INDICATOR:
I wanted to setup my trades more easier with this indicator, I didn't want to calculate everytime before orders, with help this indicator we can calculate R:R value, avarage price, stoploss price, take-profit price, order prices, all position cost and more ...
Our strategy is a risk revard calculation indicator that is made easy to use by using visualized lines and panels, and also has algorithmic trading support.
With the help of this indicator, we can quickly and easily calculate our risk reward values and enter the positions.
If we want to ensure that our balance grows regularly while trading in the stock market, we need to manage the risks and rewards otherwise we may fall below our initial balance at the end of the day, even if we seem to be winning.
What is the Risk-Reward value ?
This value is a value that shows how many times the amount of risk we take when entering the position is successful, we will earn.
- For example, you risked $100 while entering the trade, so if your trade stops, you will lose 100 $.
Your Risk-Reward(RR) value is 2 means that if your position is successful, you will have 200 $ in your pocket.
A trader's success is determined by the amount of R he earns monthly or yearly, not how much money he makes.
What is different in this indicator ?
I want to say thank you to © EvoCrypto. His Calculator (weighted) – evo indicator helped me when I was developed my indicator.
I want to explain what I have improved:
1-In this strategy, we can determine the time period in which we want to open our positions.
2-We can open a maximum of 4 positions in the same direction and close our positions at a single level. StopLoss or TakeProfit
3-This indicator, which works in the form of a strategy, shows where our positions have been opened or closed. With the help of this, it helps us to determine our strategy in our future positions more accurately.
4-The most important improvement is that we do not miss our positions with the help of alarms (WEB HOOK). if we want, we receive by quickly connecting all these positions to our robot, the software can enter and exit the position while we are busy.
IMPLEMENTATION DETAILS – SETTINGS:
1 - We can set the start and end dates of the positions we will take.
2- We can set our take profit, stoploss levels.
3- If your trade is stopped, we can determine the amount of the trade that we will lose.
4- We can adjust our entry levels to positions and our position sizes at entry levels.
(Sum of positions weight must be 100%)
5- We can receive our positions even if we are busy with the help of algorithmic trading. For this, we must paste our Jshon codes into the fields specified in the settings panel.
6- Finally, we can change the settings we want and don't want to have in our visual elements.
Let's make a LONG side example together
We have determined our positions to enter stoploss, take profit and long positions. We did not forget to set the start time of our strategy
Our strategy appear on the graph as follows.
Our strategy has calculated the total position size, our R-R value, the distance of the current price to the stop and take profit levels, in short, a lot of things we could look visually.
Notes:
If you're going to connect this bot to an automatic Long or Short direction,
Don’t forget! you need to Webhook URL,
Don’t miss paste this code to your message window {{strategy.order.alert_message}}
ALSO:
If you have any ideas what to add to my work to add more sources or make calculations cooler, feel free to write me.

MTF Diagonally Layered RSI - 1 minute Bitcoin Bot [wbburgin]This is a NON-REPAINTING multi-timeframe RSI strategy (long-only) that enters a trade only when two higher timeframes are oversold. I wrote it on BTC/USD for 1min, but the logic should work on other assets as well. It is diagonally layered to be profitable for when the asset is in a downtrend.
Diagonal layering refers to entry and exit conditions spread across different timeframes. Normally, indicators can become unprofitable because in downtrends, the overbought zones of the current timeframe are not reached. Rather, the overbought zones of the faster timeframes are reached first, and then a selloff occurs. Diagonally-layered strategies mitigate this by selling diagonally, that is, selling once the faster timeframe reaches overbought and buying once the slower timeframe reaches oversold.
Thus this strategy is diagonally layered down . I may create a separate script that alternates between diagonal-up and diagonal-down based off of overall trend, as in extended trend periods up this indicator may not flash as frequently. This can be visualized in a time series x timeframe chart as an "X" shape. Something to consider...
Let me know if you like this strategy. Feel free to alter the pyramiding entries, initial capital, and entry size, as well as commission regime. My strategies are designed to maximize average profit instead of flashing super frequently, as the fees will eat you up. Additionally, at the time of publication, all of my strategy scripts are intended to have profitable Sharpe and Sortino ratios.
Timeframes, RSI period, and oversold/overbought bounds are configurable.

basilGrid GridBot Live [basilChart]This strategy is a full implementation of Live Grid Trading.
Prominent features of this live grid trading strategy are:
- Logarithmic Chart Support: This strategy can support Log Scale on graph. Meaning that grid lines won't have irregular gaps in between the lines if you would like to view the chart Log Scaled. Every line will be aligned correctly even if you use Log Scale or not.
- Precise Buy & Sell: Script will execute precise Buy and Sell orders.
- Dynamic Grid Level Count: From 2 grid levels to n amount of grid levels are supported. There is no limitation on grid level count, however there may be irregularities because of limitations when higher grid levels are used. You can pick any number starting from 2.
- Average Price: Traders can monitor average price of positions.
- Alerts: When order is filled trader can receive notification. Create new alert > Select basilGrid Live > Order fills only()
Characteristics of this script:
- Able to fill more than one order in one single candle.
- Levels will keep being updated with every trade.
- There will be always one grid level ignored and it will be the level which made the last order filling possible. This is normal behavior of grid trading system.
- You can both use Log Scale and Normal Scale with this script. No issue will be on grid levels.
Using the script:
- Add this script to the chart from indicators tab
- Set starting date for the live grid bot either by dragging and dropping the vertical line or by the date-time picker from indicator Inputs tab.
- Set highest and lowest limit for the script. These will be the boundary limits. Highest and lowest price for the script to work on. Lines will populate between these two values
- Set grid level count. Number of levels of the grid.
- Set amount to spend on per level. This quantity of order will be placed on each level when needed.
After setting the above settings, there is one last thing to do in order to get precise results. It is setting the Initial Capital.
- We can set this setting from 'Properties' tab. Named 'Initial Capital'. After setting the boundaries all we need to is to navigate to TradingView's own 'Data Window', and get the value there. Then paste it on the strategy's own related setting area.
In this example we used pair BTCUSDT 1D timeframe, our settings are:
Inputs Tab:
- Grid Count: 19
- High Limit: 65 500
- Low Limit: 15 000
- Quantity per level: 0.1
- Toggle Log Scale: Checked (because I always use Log Scale on charts, if Log Scale is turned on for the chart, this needs to be checked)
- Terminate Grid At The Upmost Level: Not checked
- Show Grid Levels: Checked
- Show Average Position Price: Checked
Properties Tab:
- Initial Capital: 22 628
- Slippage: 5
- Commission: 0.1% (this is the broker commission value)
This script's purpose is to make it easier to get the idea of grid trading, experiencing it in live session.

Divergence for Many [Dimkud - v5]Strategy is based on "Divergence for Many Indicators v4 ST" strategy by CannyTolany01
which is based on "Divergence for Many Indicator" indicator by LonesomeTheBlue
This strategy is searching for divergences on 18 indicators which you can select and optimise one by one.
Additionally you can connect any other External Indicator value. (just add this indicator the the chart and select option in settings)
To the original indicator/strategy I have added 9 additional indicators:
( Money Flow Index, Williams_Vix, Stochastic RSI , SMI Ergodic Oscillator, Volume Weighted MACD , Bull Bear Power, Balance of Power , Relative Volatility Index , Logistic Settings).
Converted strategy to v5 of Pine Script.
Added Static SL/TP in percents (%).
Added filters to filter enters:
1. Volume Weighted MACD - Multi-TimeFrame Filter
(It checks for histogram to falling or rising for a set periods of bars)
2. Money Flow Index - Multi-TimeFrame Filter
(It checks if MFI Oscillator is in the set diapason.
Also It checks if MFI is falling or rising for a set periods of bars )
3. ATR filter
(check changes in fast ATR to slow ATR )
Strategy shows good backtest results on many crypto tokens on 45m - 1h periods. (with parameters optimisation for every indicator)
To find best parameters - you can enable indicators one-by one, and optimise best parameters for each of them.
Then enable all indicators with successful results.
Optimise SL/TP.
Then try to enable and optimise filters (channels etc.)
The better is to optimise parameters separately for Short and Long trading. And run two separate bots (in settings enable only Long or only Short.)
Updates:
- Added visualisation for open trades (SL/TP)
- Added Volatility filter by ATR with many options for tests.
- Fixed some small bugs.
- Added second RSI filter (you can use two RSIs with different TF or settings)
- Updated ATR volatility and MFI filter. Removed non-effective options
- Added CCI filter
- Added option to Enable/Disable visualisation of TP/SL on chart
- Fixed one small quick bug. ("ATR filter short" was not working)
- Added Super Trend filter
- Added Momentum filter
- Added Volume Filter
- All "request.security" MultiTimeFrame calls changed to 100% non-repait function "f_security()"

bc Grid Backtest v1.4This strategy is a full implementation of Grid Trading backtest.
Prominent features of this backtesting strategy are:
- Logarithmic Chart Support: This strategy can support Log Scale on graph. Meaning that grid lines won't have irregular gaps in between the lines if you would like to view the chart Log Scaled. Every line will be aligned correctly even if you use Log Scale or not.
- Precise Buy & Sell: Script will execute precise Buy and Sell orders.
- Dynamic Grid Level Count: From 2 grid levels to n amount of grid levels are supported. There is no limitation on grid level count. You can pick any number starting from 2.
- Customized Backtesting Results Table: A table which includes data for those who want to know has been added at top right. It can be disabled.
Characteristics of this script:
- Able to fill more than one order in one single candle.
- Levels will keep being updated with every trade.
- There will be always one grid level ignored and it will be the level which made the last order filling possible. This is normal behavior of grid trading system.
- You can both use Log Scale and Normal Scale with this script. No issue will be on grid levels.
Using the script:
- Add this script to the chart from indicators tab
- Set starting and ending date for the grid backtesting bot either by dragging and dropping the vertical lines or by the date-time picker from indicator Inputs tab.
- Set highest and lowest limit for the script. These will be the boundary limits. Highest and lowest price for the script to work on. Lines will populate between these two values
- Set grid level count. Number of levels of the grid.
- Set amount to spend on per level. This quantity of order will be placed on each level when needed.
After setting the above settings, there is one last thing to do in order to get precise results. It is setting the Initial Capital.
- We can set this setting from 'Properties' tab. Named 'Initial Capital'. After setting the boundaries all we need to is to navigate to TradingView's own 'Data Window', and get the value there. Then paste it on the strategy's own related setting area.
In this example we used pair BTCUSDT 4h timeframe, our settings are:
Inputs Tab:
- Grid Count: 13
- High Limit: 72 000
- Low Limit: 17 000
- Logarithmic Grids: Checked (because I always use Log Scale on charts, if Log Scale is turned on, this needs to be checked)
- Quantity per level: 0.1
- Show Table: Checked
- Show Grid Levels: Checked
- Show Average Position Price: Checked
Properties Tab:
- Initial Capital: 24 902
- Slippage: 5
- Commission: 0.1% (this is the broker commission value)
This script's purpose is to make simulating possible outcomes between two dates. Therefore making it easier to get the idea of grid trading, finding the best settings for your risk management and for your portfolio.

Selected Dates Filter by @zeusbottradingWe are presenting you feature for strategies in Pine Script.
This function/pine script is about NOT opening trades on selected days. Real usage is for bank holidays or volatile days (PPI, CPI, Interest Rates etc.) in United States and United Kingdom from 2020 to 2030 (10 years of dates of bank holidays in mentioned countries above). Strategy is simple - SMA crossover of two lengts 14 and 28 with close source.
In pine script you can see we picked US and GB bank holidays. If you add this into your strategy, your bot will not open trades on those days. You must make it a rule or a condition. We use it as a rule in opening long/short trades.
You can also add some of your prefered dates, here is just example of our idea. If you want to add your preffered days you can find them on any site like forexfactory, myfxbook and so on. But don’t forget to add function “time_tradingday ! = YourChoosedDate” as it is writen lower in the pine script.
Sometimes the date is substituted for a different day, because the day of the holiday is on Saturday or Sunday.
Made with ❤️ for this community.
If you have any questions or suggestions, let us know.
The script is for informational and educational purposes only. Use of the script does not constitutes professional and/or financial advice. You alone the sole responsibility of evaluating the script output and risks associated with the use of the script. In exchange for using the script, you agree not to hold zeusbottrading TradingView user liable for any possible claim for damages arising from any decision you make based on use of the script.

Time Based Crypto DayTrade StrategyThis is a time based strategy, designed to enter and exit within the same day of the week, using different hours for entry and exit.
The script is long only direction, and it has no risk management inside, so use it with caution.
At the same time you can also calculate each individual hour return within a certain day, and make your own idea about the best moments to be enter.
In order to filter a bit from the bad trades, I have applied an ATR filter, to check if that volatility is rising in order to help eliminate some of the bad trades when there is no volatility around.
For this example, on BTC, it seems that for the last years, on tuesday and thursday, enterring at the beginning of the daily candle, 01:00hours and exit at 00:00 hours, seems to give positive results giving the idea that can be converted in some sort of edge into our favor.
However dont take this entirelly for granted and conduct your own searches

Cipher_B (Finandy support)In this version of the script you can force to cancel your position after some amount of time indepedently on price action. For example, your bot open a short position with SL=1% and TP=2.4% but price did not reach any of this level over the course of to say 8 hours. In this case, position will be closed regardless of the price.
Other interesting features are volume and slope filters. Slope is essentially a derivative of price action. If you don't like to buy your instrument under high volatility, for example, if a trend goes down too fast then you can filter long position which could be opened according to the strategy. Same thing for volume filter. If the volume is too high/too low, you might want to escape such setup in your trading strategy.
Moreover, you can tune price shift for opening position. To say, if you believe that the signal for opening position comes too early everytime, you can force the strategy to buy at 1% lower price than the current price when the signal comes. Similar logic for short: open position price will be always higher than the price of the signal. If the price did not reach such level then position will be automatically cancel with a new signal arrival. Check the backtesting results to understand better the logic.
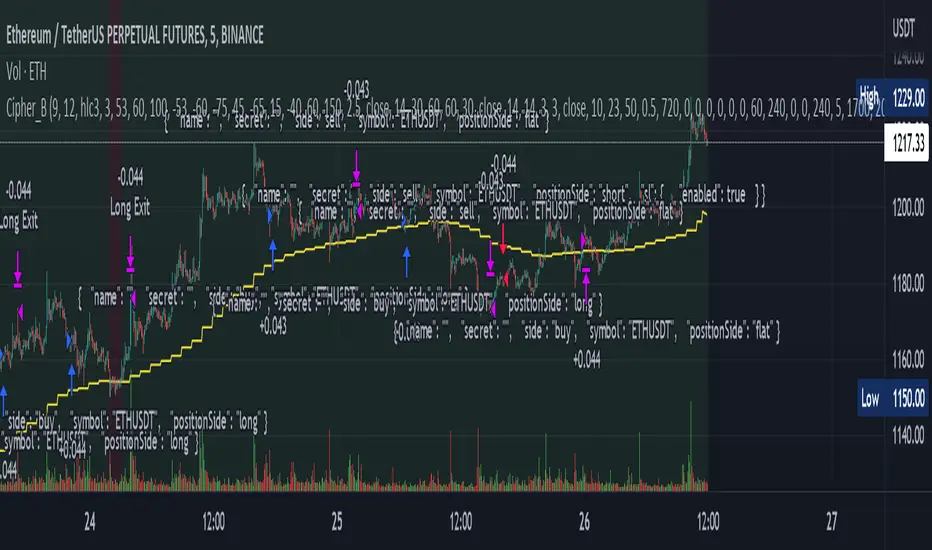
Ultimate Strategy Template (Advanced Edition)Hello traders
This script is an upgraded version of that one below
New features
- Upgraded to Pinescript version 5
- Added the exit SL/TP now in real-time
- Added text fields for the alerts - easier to send the commands to your trading bots
Step 1: Create your connector
Adapt your indicator with only 2 lines of code and then connect it to this strategy template.
For doing so:
1) Find in your indicator where are the conditions printing the long/buy and short/sell signals.
2) Create an additional plot as below
I'm giving an example with a Two moving averages cross.
Please replicate the same methodology for your indicator wether it's a MACD , ZigZag , Pivots , higher-highs, lower-lows or whatever indicator with clear buy and sell conditions.
//@version=5
indicator(title='Moving Average Cross', shorttitle='Moving Average Cross', overlay=true, precision=6, max_labels_count=500, max_lines_count=500)
type_ma1 = input.string(title='MA1 type', defval='SMA', options= )
length_ma1 = input(10, title=' MA1 length')
type_ma2 = input.string(title='MA2 type', defval='SMA', options= )
length_ma2 = input(100, title=' MA2 length')
// MA
f_ma(smoothing, src, length) =>
rma_1 = ta.rma(src, length)
sma_1 = ta.sma(src, length)
ema_1 = ta.ema(src, length)
iff_1 = smoothing == 'EMA' ? ema_1 : src
iff_2 = smoothing == 'SMA' ? sma_1 : iff_1
smoothing == 'RMA' ? rma_1 : iff_2
MA1 = f_ma(type_ma1, close, length_ma1)
MA2 = f_ma(type_ma2, close, length_ma2)
// buy and sell conditions
buy = ta.crossover(MA1, MA2)
sell = ta.crossunder(MA1, MA2)
plot(MA1, color=color.new(color.green, 0), title='Plot MA1', linewidth=3)
plot(MA2, color=color.new(color.red, 0), title='Plot MA2', linewidth=3)
plotshape(buy, title='LONG SIGNAL', style=shape.circle, location=location.belowbar, color=color.new(color.green, 0), size=size.normal)
plotshape(sell, title='SHORT SIGNAL', style=shape.circle, location=location.abovebar, color=color.new(color.red, 0), size=size.normal)
/////////////////////////// SIGNAL FOR STRATEGY /////////////////////////
Signal = buy ? 1 : sell ? -1 : 0
plot(Signal, title='🔌Connector🔌', display = display.data_window)
Basically, I identified my buy, sell conditions in the code and added this at the bottom of my indicator code
Signal = buy ? 1 : sell ? -1 : 0
plot(Signal, title="🔌Connector🔌", transp=100)
Important Notes
🔥 The Strategy Template expects the value to be exactly 1 for the bullish signal, and -1 for the bearish signal
Now you can connect your indicator to the Strategy Template using the method below or that one
Step 2: Connect the connector
1) Add your updated indicator to a TradingView chart
2) Add the Strategy Template as well to the SAME chart
3) Open the Strategy Template settings and in the Data Source field select your 🔌Connector🔌 (which comes from your indicator)
From then, you should start seeing the signals and plenty of other stuff on your chart
🔥 Note that whenever you'll update your indicator values, the strategy statistics and visual on your chart will update in real-time
Settings
- Color Candles: Color the candles based on the trade state ( bullish , bearish , neutral)
- Close positions at market at the end of each session: useful for everything but cryptocurrencies
- Session time ranges: Take the signals from a starting time to an ending time
- Close Direction: Choose to close only the longs, shorts, or both
- Date Filter: Take the signals from a starting date to an ending date
- Set the maximum losing streak length with an input
- Set the maximum winning streak length with an input
- Set the maximum consecutive days with a loss
- Set the maximum drawdown (in % of strategy equity)
- Set the maximum intraday loss in percentage
- Limit the number of trades per day
- Limit the number of trades per week
- Stop-loss: None or Percentage or Trailing Stop Percentage or ATR - I'll add shortly multiple options for the trailing stop loss
- Take-Profit: None or Percentage or ATR - I'll add also a trailing take profit
- Risk-Reward based on ATR multiple for the Stop-Loss and Take-Profit
Special Thanks
Special thanks to @JosKodify as I borrowed a few risk management snippets from his website: kodify.net
Best
Dave

Grid Trading V.3Grid DCA Trading System (Spot) This strategy does not use indicators.
The Buy Point is the price that has come down from the previous Entry or CloseLong 1.3%(as configured) and the Point of Sale is the desired %.
This strategy will have a lot of stuck in the mountain so it is very capital intensive or should be used during the sideway market.
In this system can call Alert : {{strategy.order.alert_message}}
buy message
{"side":"buy","amount":"@0.052","joint_limit":"sell","price_limit":"270.6","symbol":"BNBUSDT","price":"0", "strategy":"Grid Trading V.3", "passphrase": "xxxxxxx"}
- joint_limit for set to sell at the time of purchase (trad Spot)
- price_limit for the sale price already calculated by the system.
sell message
{"side":"sell","amount":"@0.052","joint_limit":"sell","price_limit":"270.6","symbol":"BNBUSDT","price":"0", "strategy":"Grid Trading V.3", "passphrase": "xxxxxxx"}
This message is for bots that are already designed.
----------------------------------------------------------------------------------------------------------------------
ระบบเทรด Grid DCA (Spot) กลยุทธ์นี้ไม่ได้ใช้ indicators
จุดซื้อคือราคาที่ลงมาจาก Entry หรือ CloseLong ก่อนหน้า 1.3% (ตามที่กำหนดค่า) และจุดขายคือ % ที่ต้องการ
กลยุทธ์นี้จะมีไม้ดอยจำนวนมาก จึงใช้ทุนมาก หรือ ควรใช้ช่วงตลาด sideway
ในระบบนี้สามารถเรียกใช้ Alert : {{strategy.order.alert_message}}
message ซื้อ
{"side":"buy","amount":"@0.052","joint_limit":"sell","price_limit":"269.438","symbol":"BNBUSDT","price":"268.9","strategy":"Grid Trading V.3", "passphrase": "xxxxxxx"}
- joint_limit สำหรับ ตั้งขายตอนซื้อ (trad Spot)
- price_limit สำหรับ ราคาขายที่ระบบคำนวนให้แล้ว
message ขาย
{"side":"sell","amount":"@0.052","joint_limit":"sell","symbol":"BNBUSDT","price":"268.6","strategy":"Grid Trading V.3", "passphrase": "xxxxxxx"}
message นี้ผมใช้กับบอทที่มีการออกแบบใว้แล้ว
enjoy.
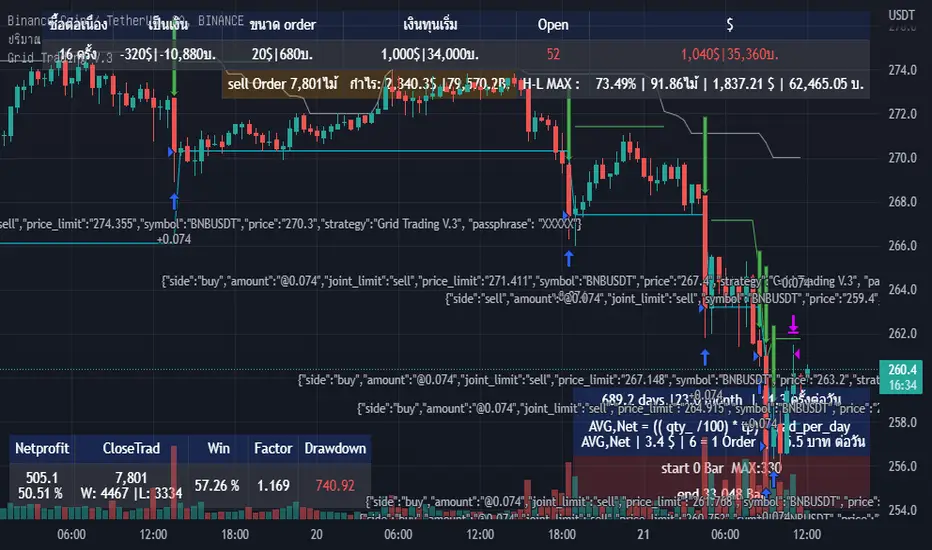
iMoku (Ichimoku Complete Tool) - The Quant Science iMoku™ is a professional all-in-one solution for the famous Ichimoku Kinko Hyo indicator.
The algorithm includes:
1. Backtesting spot
2. Visual tool
3. Auto-trading functions
With iMoku you can test four different strategies.
Strategy 1: Cross Tenkan Sen - Kijun Sen
A long position is opened with 100% of the invested capital ($1000) when "Tenkan Sen" crossover "Kijun Sen".
Closing the long position on the opposite condition.
There are 3 different strength signals for this strategy: weak, normal, strong.
Weak : the signal is weak when the condition is true and the price is above the 'Kumo'
Normal : the signal is normal when the condition is true and the price is within the 'Kumo'
Strong : the signal is strong when the condition is true and the price is below the 'Kumo'
Strategy 2: Cross Price - Kijun Sen
A long position is opened with 100% of the invested capital ($1000) when the price crossover the 'Kijun Sen'.
Closing the long position on the opposite condition.
There are 3 different strength signals for this strategy: weak, normal, strong.
Weak : the signal is weak when the condition is true and the price is above the 'Kumo'
Normal : the signal is normal when the condition is true and the price is inside the 'Kumo'
Strong : the signal is strong when the condition is true and the price is below the 'Kumo'
Strategy 3: Kumo Breakout
A long position is opened with 100% of the invested capital ($1000) when the price breakup the 'Kumo'.
Closing the long position with a percentage stop loss and take profit on the invested capital.
Strategy 4: Kumo Twist
A long position is opened with 100% of the invested capital ($1000) when the 'Kumo' goes from negative to positive (called "Twist").
Closing the long position on the opposite condition.
There are 2 different strength signals for this strategy: weak, and strong.
Weak : the signal is weak when the condition is true and the price is above the 'Kumo'
Strong : the signal is strong when the condition is true and the price is below the 'Kumo'
This script is compliant with algorithmic trading.
You can use this script with trading terminals such as 3Commas or CryptoHopper. Connecting this script is very easy.
1. Enter the user interface
2. Select and activate a strategy
3. Copy your bot's links into the dedicated fields
4. Create and activate alert
Disclaimer: algorithmic trading involves risk, the user should consider aspects such as slippage, liquidity and costs when evaluating an asset. The Quant Science is not responsible for any kind of damage resulting from use of this script. By using this script you take all the responsibilities and risks.

EMA RSI Strategy
Simple strategy
=============
If the last two closes are in ascending order, the rsi is below 50 and ascending, and the current candle is above 200 ema, then LONG. If the last two closes are in descending order, the rsi is above 50 and descending, and the current candle is below 200 ema, then SHORT.
LONG Exit strategy:
ATR: Last 14 day
Lowest: The lowest value of the last 14 candles
Limit points = (Trade Price - Lowest + ATR) * 100000
trail_points : Limit/2
trail_offset = Limit/2
SHORT Exit strategy:
ATR: Last 14 day
Highest: The higher value of the last 14 candles
Limit points = (Trade Price - Highest + ATR) * 100000
trail_points : Limit/2
trail_offset = Limit/2
Backtest results for the AUDUSD pair gave positive results over the last three months.
I am testing this strategy using a python bot in a real environment this week and will update the results at the end of the week.
Disclaimer
This is not financial advice. You should seek independent advice to check how the strategy information relates to your unique circumstances.
We are not liable for any loss caused, whether due to negligence or otherwise arising from the use of, or reliance on, the information provided directly or indirectly by this strategy.
