Joker Trailing TP BotTrailing Take Profit is used by the traders to increase their gains when the prices moves in a favorable direction. Let’s have a look at what is Trailing Take Profit and how it works.
What Is a Trailing Take Profit?
Trailing Take Profit is a term largely used in crypto, whereas you may encounter the term Trailing Stop in traditional trading describing almost the same thing, So what’s the difference between Trailing Take Profit and Trailing Stop? Trailing Stop is a type of Stop Loss automatically moving in the same direction as the asset’s price. Trailing Take Profit is nothing else than Trailing Stop activated after initial Take Profit is reached.
The main difference between these two is that Trailing Take Profit takes the profit in any case (altough it might be later annihilated by Trailing Stop). Thus, Trailing Take Profit reduces the risks that might’ve occurred using Trailing Stop alone. Trailing Take Profit is bound to the maximum of Take Profit price instead of just a price increase/decrease.
As you might notice, the terms Trailing Take Profit and Stop Loss are quite similar. To avoid confusion, in this article we will be talking about Trailing Take Profit as defined above.
Trailing Take Profit only moves in one direction. It is designed to lock in profit and limit losses. The trailing profit only moves up (in case of a long strategy) once the price has surpassed previous high and a new high has been established. If the trailing take profit moves up, it cannot move back down, thus securing the profit and preventing losses.
Trailing Take Profit allows the trade to remain open and continue to profit as long as the price is moving in the investor’s favor. If the price changes direction and the change surpasses the previously set percentage the order will be closed.
How Does it Work?
For example if you buy BTC at the price of 10000, if you set a Take Profit at 11000 and a Trailing Take Profit at 5% :
If the price goes up to 10500, nothing happens because the Take Profit at 11000 has not been reached.
Then if the BTC price goes up top 11000, a Stop Order at 10450 will be set.
Then if the BTC price goes down to 10500, the Stop Order stays at 104500.
Then if the BTC price goes up to 12000, the Stop Order moves to 11400.
Then if the BTC price goes down to 11000, the Stop Order at 11400 is executed.
You see that without Trailing Take Profit, the buy order would have been sold at 11000. Thus, a trader would miss an earning opportunity at 11400.
Cari dalam skrip untuk "bot"

Short Swing Bearish MACD Cross (By Coinrule)This strategy is oriented towards shorting during downside moves, whilst ensuring the asset is trading in a higher timeframe downtrend, and exiting after further downside.
This script can work well on coins you are planning to hodl for long-term and works especially well whilst using an automated bot that can execute your trades for you. It allows you to hedge your investment by allocating a % of your coins to trade with, whilst not risking your entire holding. This mitigates unrealised losses from hodling as it provides additional cash from the profits made. You can then choose to hodl this cash, or use it to reinvest when the market reaches attractive buying levels. Alternatively, you can use this when trading contracts on futures markets where there is no need to already own the underlying asset prior to shorting it.
ENTRY
This script utilises the MACD indicator accompanied by the Exponential Moving Average (EMA) 450 to enter trades. The MACD is a trend following momentum indicator and provides identification of short-term trend direction. In this variation it utilises the 11-period as the fast and 26-period as the slow length EMAs, with signal smoothing set at 9.
The EMA 450 is used as additional confirmation to prevent the script from shorting when price is above this long-term moving average. Once price is above the EMA 450 the script will not open any shorts - preventing the rule from attempting to short uptrends. Due to this, this strategy is ideal for setting and forgetting.
The script will enter trades based on two conditions:
1) When the MACD signals a bearish cross. This occurs when the EMA 11 crosses below the EMA 26 within the MACD signalling the start of a potential downtrend.
2) Price has closed below the EMA 450. Price closing below this long-term EMA signals that the asset is in a sustained downtrend. Price breaking above this could indicate a bullish strength in which shorting would not be profitable.
EXIT
This script utilises a set take-profit and stop-loss from the entry of the trade. The take profit is set at 8% and the stop loss of 4%, providing a risk reward ratio of 2. This indicates the script will be profitable if it has a win ratio greater than 33%.
Take-Profit Exit: -8% price decrease from entry price.
OR
Stop-Loss Exit: +4% price increase from entry price.
Based on backtesting results across a selection of assets, the 45-minute and 1-hour timeframes are the best for this strategy.
The strategy assumes each order is using 30% of the available coins to make the results more realistic and to simulate you only ran this strategy on 30% of your holdings. A trading fee of 0.1% is also taken into account and is aligned to the base fee applied on Binance.
The backtesting data was recorded from December 1st 2021, just as the market was beginning its downtrend. We therefore recommend analysing the market conditions prior to utilising this strategy as it operates best on weak coins during downtrends and bearish conditions, however the EMA 450 condition should mitigate entries during bullish market conditions.

Gucci Sniper Trading Bot [Open]A simple Buy/Sell signal algo designed for a trading bot.
Uses ATR and EMA cross to get signals.

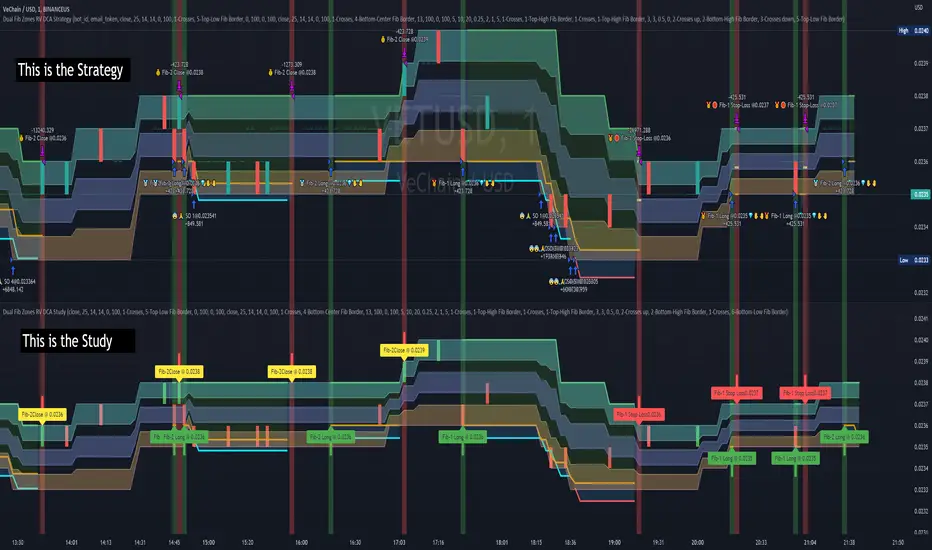
Dual Fibonacci Zones & Ranged Vol DCA Study - R3c0nTraderWhat does this do?
This signal script (aka Study) was created so it could be used with the corresponding strategy "Dual Fibonacci Zone & Ranged Vol DCA Strategy - R3c0nTrader" to create the buy and sell signals for 3Commas bots.
How to Use
Configure the study to match your settings you have set in the strategy. This script comes with an buy and sell alert conditions built-in. Just click to add alert and select Buy or Sell and paste in your bot messages.
Credits:
Thank you "EvoCrypto" for granting me permission to use "Ranged Volume" to create this study
Thank you "eykpunter" for granting me permission to use "Fibonacci Zones" to create this study
Customizable OCC Non Repainting Scalper Bot v7.0bThis strategy is intended to be used on an automated trading platform and should be run on a one minute chart for fastest confirmations and signal relay to crypto automation platform. The strategy has been modded to only go long at this time to focus on profitability for one direction. The open long and close long text fields allow you to use your own webhook message for this purpose.
I have spent quite a bit of time and I figured I would put it out to the community to share the work and also get some feedback.
Ok, so let me say that I have done absolutely everything I can to make the strategy not repaint while still maintaining it's profitability. It has been a challenge so I am publishing this to the community to help test this.
What I have observed: the strategy will not repaint in real time. That is, if you have the chart open and keep it open, the signals are the same as the ones that are sent out by the strategy. In certain cases, when I reload the chart- the signals might be off from what was sent. In some ways, that is repainting, but it is repainting based on losing the real time data and recalculating from a different set of bars- since I am running it on a one minute chart then the start becomes different when you refresh.
To address repainting while keeping the strategy calculating as quickly as possibly I have altered the logic in the following ways:
I have made an assumption which might not work for everyone- at the first tick of the next bar, you can almost safefly assume in crypto that if you are looking at the previous bar for information, the open of the current bar was the close of the previous bar. This for the most part holds true in crypto with good liquidity. If you are trading a pair that jumps around due to low volume- this might not be the strategy to use. I might publish a different version with a different logic.
I have altered the security repaint to use isbarconfirmed, so at the very end of the bar (as soon as the bar is confirmed), we recalculate to the higher time frames. So as soon as the data is available, it is at that point that we can then safely calculate higher time frames. This is unique and experimental, but seems to do well at creating good signals for entry.
I have employed my own intervals by utilizing the resolution as an integer (used by the previous authors)- but in this case, I use the interval to take a snapshot of the higher time frame. With open close cross, the different moving averages can cause the repainting as they change to show the exact point of the cross. The interval feature I created minimizes this by utilizing the previous bar info until the interval is closed and then we recalculate the variants. You can use the interval offset feature to denote which minute is the one that starts and ends the interval. So for instance, Trading View uses minue 1 and minute 31 for 30 minute intervals. If you offset your 30 minute interval would start on minute 16 and do its calculations based on the last 30 minutes,
As with most of my scripts, I have started using filters and a "show data" feature that will give you the ability to see the values of indicators that you cannot plot in the overlay. This allows you to figure out how to filter losing trades or market conditions.
I have also added a trailing stop and created a fixed stop loss as seems to perform better than the original occ strategy. The original one seemed to repaint enough that it would close too quickly and not give the posiition enough time to become profitable. In certain cases where there was a large move, it would perform well, but for the most part the trades would not close profitably even though the backtest said that it did - probably due to the delay in execution and pinescript not having a confirmation on what the actual position price was.
This is still in beta mode, so please forward test first and use at your own risk.
If you spot repaint issues, please send me a message and try to explain the situation.

Sherry on cryptoIf the price is above the 200 EMA, you are allowed to open only long positions and avoid shorts.
If the price is below the 200 EMA, you are allowed to open only short position and avoid longs. Don't use this indicator alone, use RSI, Stochastic RSI etc. Do not use this indicator like a bot, do TA and FA as well. This is just an indicator, do not always rely on it. It requires experience. This indicator has different winrate in different timeframes. Set its value accordingly.
Short Selling EMA Cross (By Coinrule)BINANCE:AVAXUSDT
This short selling script works best in periods of downtrends and general bearish market conditions, with the ultimate goal to sell as the the price decreases further and buy back before a rebound.
This script can work well on coins you are planning to hodl for long-term and works especially well whilst using an automated bot that can execute your trades for you. It allows you to hedge your investment by allocating a % of your coins to trade with, whilst not risking your entire holding. This mitigates unrealised losses from hodling as it provides additional cash from the profits made. You can then choose to to hodl this cash, or use it to reinvest when the market reaches attractive buying levels.
Entry
The exponential moving average ( EMA ) 20 and EMA 50 have been used for the variables determining the entry to the short. EMAs can operate better than simple moving averages due to the additional weighting placed on the most recent data points, whereas simple moving averages weight all the data the same. This means that price is tracked more closely and the most recent volatile moves can be captured and exploited more efficiently using EMAs.
Our backtesting data revealed that the most profitable timeframe was the 30-minute timeframe, this also enabled a good frequency of trades and high profitability.
A fast (shorter term) exponential moving average , in this strategy the EMA 20, crossing under a slow (longer term) moving average, in this example the EMA 50, signals the price of an asset has started to trend to the downside, as the most recent data signals price is declining compared to earlier data. The entry acts on this principle and executes when the EMA 20 crosses under the EMA 50.
Enter Short: EMA 20 crosses under EMA 50.
Exit
This script utilises a take profit and stop loss for the exit. The take profit is set at -8% and the stop loss is set at +16% from the entry price. This would normally be a poor trade due to the risk:reward equalling 0.5. However, when looking at the backtesting data, the high profitability of the strategy (93.33%) leads to increased confidence and showcases the high probability of success according to historical data.
The take profit (-8%) and the stop loss (+16%) of the strategy are widely placed to ensure the move is captured without being stopped out due to relief rallies. The stop loss also plays a role of mitigating losses and minimising risk of being stuck in a short position once there has been a fundamental trend reversal and the market has become bullish .
Exit Short: -8% price decrease from entry price.
OR
Exit Short: +16% price increase from entry price.
Tip: Research what coins have consistent and large token unlocks / highly inflationary tokenomics, and target these during bear markets to short as they will most likely have substantial selling pressure that outweighs demand - leading to declining prices.
The strategy assumes each order is using 30% of the available coins to make the results more realistic and to simulate you only ran this strategy on 30% of your holdings. A trading fee of 0.1% is also taken into account and is aligned to the base fee applied on Binance.
The backtesting data was recorded from December 1st 2021, just as the market was beginning its downtrend. We therefore recommend analysing the market conditions prior to utilising this strategy as it operates best on weak coins during downtrends and bearish conditions.

AlphaTrend For ProfitViewThis strategy is based on the AlphaTrend indicator by KivancOzbilgic A full description of this algorithm functionality may be found by clicking the linked image above.
Changes and/or additions:
It is now a backtestable strategy
Updated alert trigger logic
Easy integration with ProfitView to use this algorithm for automated trading
When you create an alert, and you are using ProfitView, select " alert() function calls only " as the condition option. If you would rather set your own custom alert message, select " Order fills only " instead.
There is a selectable setting in the options to trigger alert() function calls immediately, that you may use to see what text it will send.

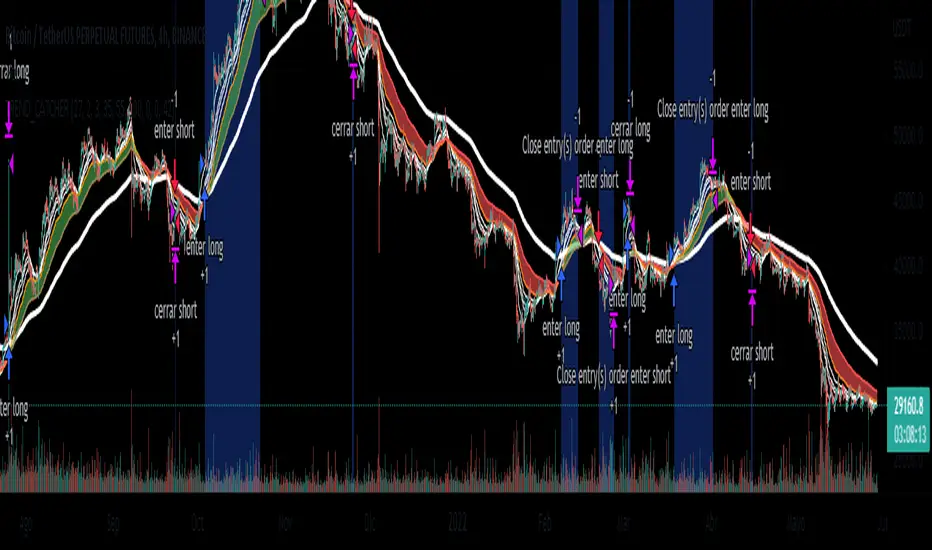
EMA_TREND_CATCHERSimple strategy based on the crossing of moving averages of 50,100 and 200 periods. Designed to identify trends
You are ready to use trading bots (all you have to do is fill in "Variables for Alert"). However, it can also be used for discretionary operations.
BTCUSDT FUTURES BINANCE
4H
TradingHookLibrary "TradingHook"
This library is a client script for making a webhook signal formatted string to TradingHook webhook server.
buy_message(password, amount, order_name) Make a buy Message for TradingHook.
Parameters:
password : (string) password that you set in .env file.
amount : (float) amount. If not set, your strategy qty will be sent.
order_name : (string) order_name. The default name is "Order".
Returns: (string) A string containing the formatted webhook message.
sell_message(password, percent, order_name) Make a sell message for TradingHook.
Parameters:
password : (string) password that you set in .env file.
percent : (string) what percentage of your quantity you want to sell.
order_name : (string) order_name. The default name is "Order".
Returns: (string) A string containing the formatted webhook message.
You can use TradingHook WebServer open source code in github(github.com)

AMASling - All Moving Average Sling ShotThis indicator modifies the SlingShot System by Chris Moody to allow it to be based on 'any' Fast and Slow moving average pair. Open Long / Close Long / Open Short / Close Short alerts can be generated for automated bot trading based on the SlingShot strategy:
• Conservative Entry = Fast MA above Slow MA, and previous bar close below Fast MA, and current price above Fast MA
• Conservative Entry = Fast MA below Slow MA, and previous bar close above Fast MA, and current price below Fast MA
• Aggressive Entry = Fast MA above Slow MA, and price below Fast MA
• Aggressive Exit = Fast MA below Slow MA, and price above Fast MA
Entries and exits can also be made based on moving average crossovers, I initially put this in to make it easy to compare to a more standard strategy, but upon backtesting combining crossovers with the SlingShot appeared to produce better results on some charts.
Alerts can also be filtered to allow long deals only when the fast moving average is above the slow moving average (uptrend) and short deals only when the fast moving average is below the slow moving averages (downtrend).
If you have a strategy that can buy based on External Indicators you can use the 'Backtest Signal' which plots the values set in the 'Long / Short Signals' section.
The Fast, Slow and Signal Moving Averages can be set to:
• Simple Moving Average (SMA)
• Exponential Moving Average (EMA)
• Weighted Moving Average (WMA)
• Volume-Weighted Moving Average (VWMA)
• Hull Moving Average (HMA)
• Exponentially Weighted Moving Average (RMA) (SMMA)
• Linear regression curve Moving Average (LSMA)
• Double EMA (DEMA)
• Double SMA (DSMA)
• Double WMA (DWMA)
• Double RMA (DRMA)
• Triple EMA (TEMA)
• Triple SMA (TSMA)
• Triple WMA (TWMA)
• Triple RMA (TRMA)
• Symmetrically Weighted Moving Average (SWMA) ** length does not apply **
• Arnaud Legoux Moving Average (ALMA)
• Variable Index Dynamic Average (VIDYA)
• Fractal Adaptive Moving Average (FRAMA)
'Backtest Signal' and 'Deal State' are plotted to display.none, so change the Style Settings for the chart if you need to see them for testing.
Yes I did choose the name because 'It's Amasling!'

Oversold RSI with tight SL Strategy (by Coinrule)This is one of the best strategies that can be used to get familiar with technical indicators and start to include them in your trading bot rules.
ENTRY
1. This trading system uses the RSI ( Relative Strength Index ) to anticipate good points to enter positions. RSI is a technical indicator frequently used in trading. It works by measuring the speed and change of price movements to determine whether a coin is oversold (indicating a good entry point) or overbought (indicating a point of exit/entry for a short position). The RSI oscillates between 0 and 100 and is traditionally considered overbought when over 70 and oversold when below 30.
2. To pick the right moment to buy, the strategy enters a trade when the RSI falls below 30 indicating the coin is oversold and primed for a trend reversal.
EXIT
The strategy then exits the position when the price appreciates 7% from the point of entry. The position also maintains a tight stop-loss and closes the position if the price depreciates 1% from the entry price. The idea behind this is to cut your losing trades fast and let your winners ride.
The best time frame for this strategy based on our backtesting data is the daily. Shorter time frames can also work well on certain coins, however in our experience, the daily works best. Feel free to experiment with this script and test it on a variety of your coins! With our backtesting data a trading fee of 0.1% is taken into account. The fee is aligned to the base fee applied on Binance, which is the largest cryptocurrency exchange by volume. In the example shown, this strategy made a handsome net profit of 39.31% on Chainlink with 61.54% of trades being profitable.

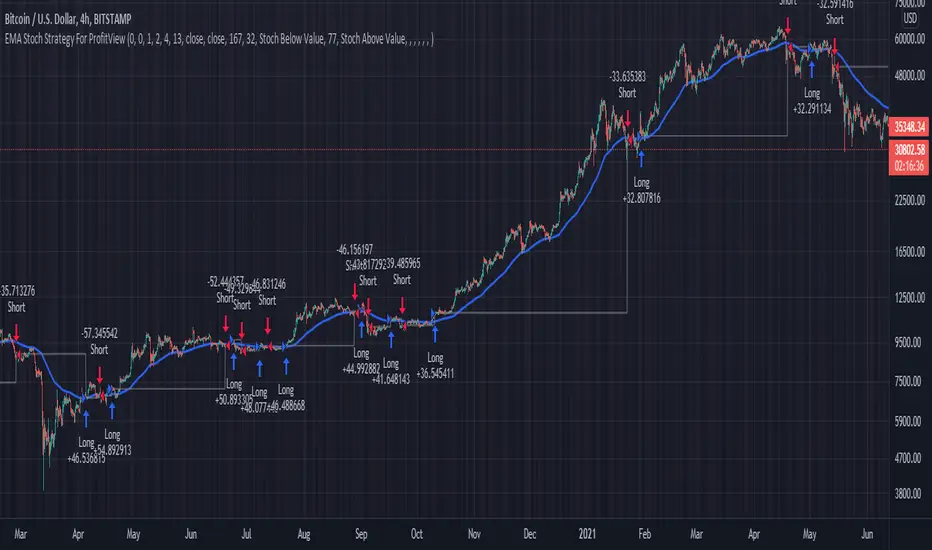
EMA Stoch Strategy For ProfitViewThis strategy will enter positions when the set stochastic conditions are met, and uses the moving average to filter the direction of the trades (long/short). The background is used to illustrate the strength of the stochastic values.
The following is a step by step guide in order to automate the trading of the strategy with ProfitView:
In the indicator settings, set the desired stochastic and ema values, and the stochastic condition you want to use to enter a trade.
In the indicator, set which exchange, symbol, and account to execute trades on.
In the indicator, set the PV Alert names you intend to use. If you want to use the same names as provided in the pastebin below, you may set the three names to Market Long, Market Short, TP SL Hit.
In PV, create two new PV Alerts in the PV Alert tab in accordance to these specifics pastebin.com .
On the Tradingview chart you want the indicator run on, create a new TV alert with this script as its condition, and specify the alert to "alert() function calls only".
Level 1 - Learn to code simply - PineScriptThe goal of this script is honestly to help everyone learn about trading with bots and algos.
At least, to get started.
Level 1:
10 lines of code.
learn to plot 2 moving averages on your chart.
learn to create a signal from a crossover.
learn the very basics of Pine Script algo.

Oversold RSI with Tight Stop-Loss Strategy (by Coinrule)KRAKEN:LINKUSD
This is one of the best strategies that can be used to get familiar with technical indicators and start to include them in your rules on Coinrule .
ENTRY
1. This trading system uses the RSI (Relative Strength Index) to anticipate good points to enter positions. RSI is a technical indicator frequently used in trading. It works by measuring the speed and change of price movements to determine whether a coin is oversold (indicating a good entry point) or overbought (indicating a point of exit/entry for a short position). The RSI oscillates between 0 and 100 and is traditionally considered overbought when over 70 and oversold when below 30.
2. To pick the right moment to buy, the strategy enters a trade when the RSI falls below 30 indicating the coin is oversold and primed for a trend reversal.
EXIT
The strategy then exits the position when the price appreciates 7% from the point of entry. The position also maintains a tight stop-loss and closes the position if the price depreciates 1% from the entry price. The idea behind this is to cut your losing trades fast and let your winners ride.
The best time frame for this strategy based on our back testing data is the daily. Shorter time frames can also work well on certain coins, however in our experience, the daily works best. Feel free to experiment with this script and test it on a variety of your coins! With our back testing data a trading fee of 0.1% is taken into account. The fee is aligned to the base fee applied on Binance, which is the largest cryptocurrency exchange by volume. In the example shown, this strategy made a handsome net profit of 52.6% on Chainlink with 66.67% of trades being profitable.
You can execute this strategy on your favorite exchanges with Coinrule .

MilleMachineHello traders,
I hereby present to you the second stage of my journey to finding a reliable, profitable trading strategy.
The "Millemachine" is based on the "Millebot", my previous published strategy. This means the backbone of the strategy is still the same: a trend following system. Instead of using a fixed TP and SL, a trailing stoploss is now used. To limit the losses when the trend weakens, the trailing stoploss automatically gets smaller, as it is based on the ATR.
A new utility is you can now easily switch between indicators on which the decision making is based. This allows the user to discover which indicators work best for entry, long/short switching and stoploss configuration.
The strategy has been proven to be very profitable in trending markets, but can suffer losses during ranging market. To make the system more robust, the strategy cannot solely rely on a trending system. Other systems must be added.
I believe that a good trading bot must consist of more than 4 different strategies, based on different systems. This is what I am currently working on.
My goal for publishing this strategy is to help other traders build their own. In my journey I found it difficult to find a good strategy that employs a decent risk management, which is truly essential for having good, consistent results. Also, a realistic commission needs to be defined to have a realistic performance prediction. This weighs on the profitability and therefore is often set at 0 by authors of other strategies, which I find misleading.
If you have found this strategy informative or useful, please leave a comment.
Greetings Michael

Bogdan Ciocoiu - Sniper EntryWhat is Sniper Entry
Sniper Entry is a set indicator that encapsulates a collection of pre-configured scripts using specific variables that enable users to extract signals by interpreting market behaviour quickly, suitable for 1-3min scalping. This instrument is a tool that acts as a confluence for traders to make decisions concerning current market conditions. This indicator does not apply solely to an asset.
What Sniper Entry is not
Sniper Entry is not interpreting fundamental analysis and will also not be providing out of box market signals. Instead, it will provide a collection of integrated and significantly improved open-source subscripts designed to help traders speculate on market trends. Traders must apply their strategies and configure Sniper Entry accordingly to maximise the script's output.
Originality and usefulness
The collection of subscripts encapsulated in this tool makes it unique in the Trading View ecosystem. This indicator enables traders to consider entry positions or exit positions by comparing similar algorithms at once.
Its usefulness also emerges from the unique configurations embedded in the indicator's settings, which are different from those of the original scripts.
This indicator's originality is also reflected in how its modules are integrated, including the integration of the settings.
Open-source reuse
I used the following open-source resources, which I simplified significantly and pre-configured for short term scalping. The source codes for the below are already in the public domain, including the following links listed below.
www.tradingview.com (open source)
(open source and generic algorithm)
www.tradingview.com (open source)
(open source)
(open source)
www.tradingview.com (generic MA algorithm and open source)
(generic VWAP algorithm and open source)

I11L OIL BotThe System makes use of the Bolinger Bands strategy from TradingView and implements simple Money Management Rules like SL and TP.
You can adjust the following Parameters:
Leverage: Leverage.
Risk Capital per Trade: The amount you are willing to lose per Trade, keep in mind that changes in Leverage should follow changes in Risk Capital.
TP_Factor: Default is 2:1 Risk:Reward, you might want to adjust this according to the underlying market.
InvertBuyLogic: Inverts the Logic of the System, important for checking if you have a true performance advantage from using the System. I look for a flat looking Curve in the wrong mode.
LookbackDistance: The distance your standart Deviation is refering to. A Lookback Distance too big might result in very few signals.
DevMult: We only want outliers, so we multiply our standart Deviation Bands by a Factor.

crypto futures hourly scalping with ma & rsi - ogcheckershi to all lovable traders,
hereby i want to share a combination of trade ideas for scalping
i've chosen hourly timeframe
indicators used: moving averages and rsi
moving averages:
ema 3, ema 5, ema 7
sma 3, sma 5, sma 7
daily_ema_3, daily_ema_5
daily_ema_5, daily_sma_5
rsi:
rsi 7, rsi 14, rsi 26
daily_rsi_7, daily_rsi_14, daily_rsi_26
as per the analysis over moving average behavioral patterns & rsi movements, useful points are given below which will be helpful while choosing good entry points & exit points,
strategical points for LONG:
* when ema3 crosses above sma3 - green candles start to form
* it's followed by ema5 > sma5 and ema7 > sma7
* when ema3 crosses down sma3 - it's considered as an indication of exit
* if rsi supports then can wait for ema5 crossing down sma5
* as similar, when daily_ema_3 crosses above daily_sma_3, its an higher timeframe bullish indication, so the lower timeframe entries inside this higher timeframe is a sure shot confident entry
* for LONG always take entries when rsi_14 < 30 or 25 else check rsi_7 < 25 or below
* as along the above, bullish CANDLE patterns like bullish engulfing , morning star is been used for entry at lower levels
* so here i've used OPEN as rsi_source in majority
* exit points also indicated at high_rsi and moving average crossunders or reverse crossovers
* for SHORTING, the above said ideas can be used in viceversa
* inputs in the indicator were tailored for users needs so that you will enjoy the magics of customization
if i am wrong in anyways regarding the above indicator strategy, please forgive me and help me improve in this aspect by commenting.
after few more studies and analysis and mainly QUERIES & COMMENTS, i'm planning to backtest these strategies here in tradingview.
also if these strategies are coded in python, we can link it to Binance Futures Algo or Bot Trading.
thankyou for this opportunity,
thanks to tradingview and pinecoders
thanks to Pranab (for 365MA)
thanks to Gandalf (for inspiring)
Special Thanks & Love to Chartbank for Everything

Ichimoku Cloud MasterIchimoku Cloud Master aims to provide the ichimoku trader with easy alert functionality to not miss out on valuable trade setups. The key purpose of this script is to better visualise crucial moments in Ichimoku trading. These alerts should not be used for botting in my opinion as they always need a human to confirm the ichimoku market structure. For example, is the Kijun-Sen flat and too far away from price? A good ichimoku trader will not enter at such a point in time.
Explanation of script:
Chikou(lagging span): pink line, this is price plotted 26 bars ago. People ignore the power of this it is crucial to see how chikou behaves towards past price action as seen in the chart below where we got an entry at red arrow because chikou bounced from past fractal bottom.
Kijun-Sen(base line): Black line or color coded line. This is the equilibrium of last 26 candles. To me this is the most important line in the system as it attracts price.
Kijun = (Highest high of 26 periods + Lowest low of 26 periods) ÷ 2
Tenkan-Sen(conversion line): Blue line. This is the equilibrium of last 9 candles. In a strong uptrend price stays above this line.
Tenkan = (Highest high of 9 periods + Lowest low of 9 periods) ÷ 2
Senkou A (Leading span A)= Pink cloud line, this is the average of the 2 components projected 26 bars in the future.
Senkou A = (Tenkan + Kijun) ÷ 2
Senkou B (Leading span B) = Green cloud line, this is the 52 day equilibrium projected 26 bars in the future.
Senkou B = (Highest high of prior 52 periods + Lowest low of prior 52 periods) ÷ 2
Notice how the distance between Chikou and the cloud is also 52 bars. This is all part of Hosoda's numbers which I am not going to explain here.
Fractals: These are the black triangles you find at key turning point. If you want to know how they work reseach williams fractals. I've used fractals with a period of 9 as it is an ichimoku number. These fractals are useful when working with ichimoku wave theory. Again I will not explain that here but in further education
Fractal Support: Ability to extend lines from the fractals which can be used as an entry/exit mechanism in your trading. For example wait for tenkan to cross kijun and then enter on fractal breakout.
Signals:
Crossing of Chikou (lagging span) with past Kijun-Sen: this will color code the Bars / Kijun-Sen (you can turn this off in options)
The script also has a signal for this, this will be the green and purple diamonds. Where green is bullish and purple is bearish.
wy is this important?
When current price plotted 26 candles back (chikou) crosses over the past equilibrium (kijun-sen) this usualy means price has moved past resistance levels where sellers come in. This indicates a switch in market structure and price is bullish from this point, this is the same in the other direction.
Kumo Twist: when the kumo cloud (future) has a crossover from for example green to red (bull to bear). The script plots these using the colored cross symbols as seen in the picture above. A chikou cross + a Kumo twist at same bar of next to eachother below the cloud can be a great entry sign: this would be an entry after cross in the chart above.
Kijun Bounce: when in an uptrend the price retraces back to Kijun-Sen and starts to go back up. These are marked by the yellow circles as seen in chart below:
low below Kijun-Sen and close above it
Strong Trend: when Tenkan is above Kijun, price above cloud, future cloud green, chikou above close, chikou above Kijun we establish a strong bullish trend. For bearish the exact opposite. The script has a function to send an alert at the start of such trends and to plot them with small colored circles above the bars.
Customisation:
I've added options to disable specific aspects of the indicator for those traders who do not want to use all aspects of the indicator. In the customisation tab I've given each part a clear title so you can use your own colors/shapes.
The perfect entry?
Further info:
Look into my education pane, I will be adding education in the future. The chance of me making a more advanced version of the script including line forecasting etc is rather high so watch out for that.
For those who want to master this system I recommend reading the book:
How to make money with the ichimoku system by Balkrishna M. Sadekar
Or the originals books by Hosoda the inventor of Ichimoku if you can get your hands on them and can read Japanese.
Almost all info about the ichimoku system you find on the internet will lose you money because they reduce the system to simple signals that do not generate money.
I will be providing educational material on tradingview using this indicator.

Template Trailing Strategy (Backtester)💭 Overview
+ Title: Template Trailing Strategy (Backtester)
+ Author: Iason Nikolas (jason5480)
+ License: CC BY-NC-SA 4.0
💢 What is the "Template Trailing Strategy (Backtester)" ❓
The "Template Trailing Strategy (Backtester)" (TTS) is a back-tester orchestration framework. It supercharges the implementation-test-evaluation lifecycle of new trading strategies, by making it possible to plug in your own trading idea.
While TTS offers a vast number of configuration settings, it primarily allows the trader to:
Test and evaluate your own trading logic that is described in terms of entry, exit, and cancellation conditions.
Define the entry and exit order types as well as their target prices when the limit, stop, or stop-limit order types are used.
Utilize a variety of options regarding the placement of the stop-loss and take-profit target(s) prices and support for well-known techniques like moving to breakeven and trailing.
Provide well-known quantity calculation methods to properly handle risk management and easily evaluate trading strategies and compare them.
Alert on each trading event or any related change through a robust and fully customizable messaging system.
All of the above makes TTS a practical toolkit: once you learn it, many repetitive tasks that strategy authors usually re-implement are eliminated. Using TradingView’s built-in backtesting engine makes testing and comparing ideas straightforward.
By utilizing the TTS one can easily swap "trading logic" by testing, evaluating, and comparing each trading idea and/or individual component of a strategy.
Finally, TTS, through its per-event alert management (and debugging) system, provides an automated solution that supports live trading with brokers via webhooks.
NOTE: The "Template Trailing Strategy (Backtester)" does not dictate how you can combine different indicator types. Thus, it should not be confused as a "Trading System", because it gives its user full flexibility on that end (for better or worse).
💢 What is a "Signal Indicator" ❓
"Signal Indicator" (SI) is an indicator that can output a "signal" that follows a specific convention so that the "Template Trailing Strategy (Backtester)" can "understand" and execute the orders accordingly. The SI realizes the core trading logic signaling to the TTS when to enter, exit, or cancel an order. A SI instructs the TTS "when" to enter or exit, and the TTS determines "how" to enter and exit the position once the Signal Indicator generates a signal.
A very simple example of a Signal Indicator might be a 200-day Simple Moving Average Signal. When the price of the security closes above the 200-day SMA, a SI would provide TTS with a "long entry signal". Once TTS receives the "long entry signal", the TTS will open a long position and send an alert or automated trade message via webhook to a broker, based on the Entry settings defined in TTS. If the TTS Entry settings specify a "Market" order type, then the open long position will be executed by TTS immediately. But if the TTS Entry settings specify a "Stop" order type with a 1% Stop Distance, then when the price of the security rises by 1% after the "long entry signal" occurs, the TTS will open a long position and the Long Entry alert or webhook to the broker will be sent.
🤔 How to Guide
💢 How to connect a "signal" from a "Signal Indicator" ❓
The "Template Trailing Strategy (Backtester)" was designed to receive external signals from a "Signal Indicator". In this way, a "new trading idea" can be developed, configured, and evaluated separately from the TTS. Similarly, the SI can be held constant, and the trading mechanics can change in the TTS settings and back-tested to answer questions such as, "Am I better with a different stop loss placement method, what if I used a limit order instead of a stop order to enter, what if I used 25% margin instead of trading spot market?"
To make that possible by connecting an external signal indicator to TTS, you should:
Add both your SI (e.g. "Two MA Signal Indicator" , "Click Signal Indicator" , "Signal Adapter" , "Signal Composer" ) and the TTS script to the same chart.
Open the script's Settings / Inputs dialog for the TTS.
In the 🛠️ STRATEGY group set 𝐃𝐞𝐚𝐥 𝐂𝐨𝐧𝐝𝐢𝐨𝐧𝐬 𝐌𝐨𝐝𝐞 to 🔨External (this makes TTS listen to an external signal source).
Still inside 🛠️ STRATEGY locate the 🔌𝐒𝐢𝐠𝐧𝐚𝐥 🛈 input and choose the plotted output of your SI. The option should look like: "<SI short title>:🔌Signal to TTS" .
Verbose troubleshooting & tips
If the SI does not appear in the 🔌Signal 🛈 selector, confirm both scripts are added to the same chart and the SI exposes a plotted series (title often "🔌Signal to TTS").
When using multiple SIs, pick the SI instance that actually outputs the "🔌Signal to TTS" plotted series.
Validate on the chart: when your SI changes state, the plotted "🔌Signal" series in the TTS (visible in the data window) should change accordingly.
The TTS accepts only signals that follow the tts_convention DealConditions structure. Do not attempt to feed arbitrary scalar series without using conv.getDealConditions / conv.DealConditions.
Make sure your SI composes a DealConditions value following the TTS convention (startLong, endLong, startShort, endShort — optional cancel fields). See the template below.
If the plot is present but TTS does not react, ensure the SI plot is non-repainting (or accept realtime/backtest limitations). Test on historical bars first.
Create alerts on the strategy (see the Alerts section). Use the {{strategy.order.alert_message}} placeholder in the Create Alert dialog to forward TTS messages.
💢 How to create a custom trading logic ❓
The "Template Trailing Strategy (Backtester)" provides two ways to plug in your custom trading logic. Both of them have their advantages and disadvantages.
✍️ Develop your own Customized "Signal Indicator" 💥
The first approach is meant to be used for relatively more complex trading logic. The advantages of this approach are the full control and customization you have over the trading logic and the relatively simple configuration setup by having two scripts only. The downsides are that you have to have some experience with pinescript or you are willing to learn and experiment. You should also know the exact formula for every indicator you will use since you have to write it by yourself. Copy-pasting from existing open-source indicators will get you started quite fast though.
The idea here is either to create a new indicator script from scratch or to copy an existing non-signal indicator and make it a "Signal Indicator". To create a new script, press the "Pine Editor" button below the chart to open the "Pine Editor" and then press the "Open" button to open the drop-down menu with the templates. Select the "New Indicator" option. Add it to your chart to copy an existing indicator and press the source code {} button. Its source code will be shown in the "Pine Editor" with a warning on top stating that this is a read-only script. Press the "create a working copy". Now you can give a descriptive title and a short title to your script, and you can work on (or copy-paste) the (other) indicators of your interest. Once you have the information needed to decide, define a DealConditions object and plot it like this:
import jason5480/tts_convention/ as conv
// Calculate the start, end, cancel start, cancel end conditions
dealConditions = conv.DealConditions.new(
startLongDeal = ,
startShortDeal = ,
endLongDeal = ,
endShortDeal = ,
cnlStartLongDeal = ,
cnlStartShortDeal = ,
cnlEndLongDeal = ,
cnlEndShortDeal = )
// Use this signal in scripts like "Template Trailing Strategy (Backtester)" and "Signal Composer" that can utilize its value
// Emit the current signal value according to the TTS framework convention
plot(series = conv.getSignal(dealConditions), title = '🔌Signal to TTS', color = #808000, editable = false, display = display.data_window + display.status_line, precision = 0)
You should import the latest version of the tts_convention library and write your deal conditions appropriately based on your trading logic and put them in the code section shown above by replacing the "…" part after "=". You can omit the conditions that are not relevant to your logic. For example, if you use only market orders for entering and exiting your positions the cnlStartLongDeal, cnlStartShortDeal, cnlEndLongDeal, and cnlEndShortDeal are irrelevant to your case and can be safely omitted from the DealConditions object. After successfully compiling your new custom SI script add it to the same chart with the TTS by pressing the "Add to chart" button. If all goes well, you will be able to connect your "signal" to the TTS as described in the "How to connect a "signal" from a "Signal Indicator"?" guide.
🧩 Adapt and Combine existing non-signal indicators 💥
The second approach is meant to be used for relatively simple trading logic. The advantages of this approach are the lack of pine script and coding experience needed and the fact that it can be used with closed-source indicators as long as the decision-making part is displayed as a line in the chart. The drawback is that you have to have a subscription that supports the "indicator on indicator" feature so you can connect the output of one indicator as an input to another indicator. Please check if your plan supports that feature here
To plug in your own logic that way you have to add your indicator(s) of preference in the chart and then add the "Signal Adapter" script in the same chart as well. This script is a "Signal Indicator" that can be used as a proxy to define your custom logic in the CONDITIONS group of the "Settings/Inputs" tab after defining your inputs from your preferred indicators in the VARIABLES group. Then a "signal" will be produced, if your logic is simple enough it can be directly connected to the TTS that is also added to the same chart for execution. Check the "How to connect a "signal" from a "Signal Indicator"?" in the "🤔 How to Guide" for more information.
If your logic is slightly more complicated, you can add a second "Signal Adapter" in your chart. Then you should add the "Signal Composer" in the same chart, go to the SIGNALS group of the "Settings/Inputs" tab, and connect the "signals" from the "Signal Adapters". "Signal Composer" is also a SI so its composed "signal" can be connected to the TTS the same way it is described in the "How to connect a "signal" from a "Signal Indicator"?" guide.
At this point, due to the composability of the framework, you can add an arbitrary number (bounded by your subscription of course) of "Signal Adapters" and "Signal Composers" before connecting the final "signal" to the TTS.
💢 How to set up ⏰Alerts ❓
The "Template Trailing Strategy (Backtester)" provides a fully customizable per-event alert mechanism. This means that you may have an entirely different message for entering and exiting into a position, hitting a stop-loss or a take-profit target, changing trailing targets, etc. There are no restrictions, and this gives you great flexibility.
First enable the events you want under the "🔔 ALERT MESSAGES" module. Each enabled event exposes a text area where you can craft the message using placeholders that TTS replaces with actual values when the event occurs.
The placeholder categories (exact names used by the script) are:
Chart & instrument:
{{ticker}}
{{base_currency}}
{{quote_currency}}
Entry / exit / stop / TP prices & offsets:
{{entry_price}}
{{exit_price}}
{{stop_loss_price}}
{{take_profit_price_1}} ... {{take_profit_price_5}}
{{entry+_price}}, {{entry-_price}}, {{exit+_price}}, {{exit-_price}} — Optional offset helpers (computed using "Offset Ticks")
Quantities, percents & derived quantities:
{{entry_base_quantity}} — base units at entry (e.g. BTC)
{{entry_quote_quantity}} — quote amount at entry (e.g. USD)
{{risk_perc}} — % of capital risked for that entry (multiplied by 100 when "Percentage Range " is enabled)
{{remaining_quantity_perc}} — % of the initial position remaining at close/SL
{{remaining_base_quantity}} — remaining base units at close/SL
{{take_profit_quantity_perc_1}} ... {{take_profit_quantity_perc_5}} — % sold/bought at each TP
{{take_profit_base_quantity_1}} ... {{take_profit_base_quantity_5}} — base units closed at each TP
❗ Important: the per-event alert text is injected into the Create Alert dialog using TradingView's strategy placeholder:
{{strategy.order.alert_message}}
During the creation of a strategy alert, make sure the placeholder {{strategy.order.alert_message}} exists in the "Message" box. TradingView will substitute the per-event text you configured and enabled in TTS Settings/Inputs before sending it via webhook/notification.
Tip: For webhook/broker execution, set the proper "Condition" in the Create Alert dialog (for changing-entry/exit/SL notifications use "Order fills and alert() function calls" or "alert() function calls only" as appropriate).
💢 How to execute my orders in a broker ❓
To execute your orders in a broker that supports webhook integration, you should enable the appropriate alerts in the "Template Trailing Strategy (Backtester)" first (see the "How to set up Alerts?" guide above). Then you should go to the "Create Alert/Notifications" tab check the "Webhook URL" and paste the URL provided by your broker. You have to read the documentation of your broker for more information on what messages are expected.
Keep in mind that some brokers have deep integration with TradingView so a per-event alert approach might be overkill.
📑 Definitions
This section tries to give some definitions in terms that appear in the "Settings/Inputs" tab of the "Template Trailing Strategy (Backtester)"
💢 What is Trailing ❓
Trailing is a technique where a price target follows another "barrier" price (usually high or low) by trying to keep a maximum distance from the "barrier" when it moves in only one direction (up or down). When the "barrier" moves in the other direction the price target will not change. There are as many types of trailing as price targets, which means that there are entry trailing, exit trailing, stop-loss trailing, and take-profit trailing techniques.
💢 What is a Moonbag ❓
A Moonbag in a trade is the quantity of the position that is reserved and will not be exited even if all take-profit targets defined in the strategy are hit, the quantity will be exited only if the stop-loss is hit or a close signal is received. This makes the stop-loss trailing technique in a trend-following strategy a good candidate to take advantage of a Moonbag.
💢 What is Distance ❓
Distance is the difference between two prices.
💢 What is Bias ❓
Bias is a psychological phenomenon where you make decisions based on market sentiment. For example, when you want to enter a long position you have a long bias, and when you want to exit from the long position you have a short bias. It is the other way around for the short position.
💢 What is the Bias Distance of a price target ❓
The Bias Distance of a price target is the distance that the target will deviate from its initial price. The direction of this deviation depends on the bias of the market. For example, suppose you are in a long position, and you set a take-profit target to the local highest high. In that case, adding a bias distance of five ticks will place your take-profit target 5 ticks below this local highest high because you have a short bias when exiting a long position. When the bias is long the bias distance will be added resulting in a higher target price and when you have a short bias the bias distance will be subtracted.
⚙️ Settings
In the "Settings/Inputs" tab of the "Template Trailing Strategy (Backtester)", you can find all the customizable settings that are provided by the framework. The variety of those settings is vast; hence we will only scratch the surface here. However, for every setting, there is an information icon 🛈 where you can learn more if you mouse over it. The "Settings/Inputs" tab is divided into ten main groups. Each one of them is responsible for one module of the framework. Every setting is part of a group that is named after the module it represents. So, to spot the module of a setting find the title that appears above it comes with an emoji and uppercase letters. Some settings might have the same name but belong to different modules e.g. "Tgt Dist Mtd" (Target Distance Method). Some settings are indented, which means that they are closely related to the non-indented setting above. Usually, indented settings provide further configuration for one or more options of the non-indented setting above. The groups that correspond to each module of the framework are the following:
🗺️ Quick Module Cross-Reference (use emojis to jump to setting groups)
📆 FILTERS — session, date & weekday filters
🛠️ STRATEGY — internal vs external deal-conditions; pick the signal source
🔧 STRATEGY – INTERNAL — built-in Two MA logic for demonstration purposes
🎢 VOLATILITY — ATR / StDev update modes
🔷 ENTRY — entry order types & trailing
🎯 TAKE PROFIT — multi-step TP and trailing rules
🛑 STOP LOSS — stop placement, move-to-breakeven, trailing
🟪 EXIT — exit order types & cancel logic
💰 QUANTITY/RISK MANAGEMENT — position sizing, moonbag, limits
📊 ANALYTICS — stats, streaks, seasonal tables
🔔 ALERT MESSAGES — per-event alert templates & placeholders
😲 Caveats
💢 Does "Template Trailing Strategy (Backtester)" have repainting behavior? ❓
The answer is that the "Template Trailing Strategy (Backtester)" does not repaint as long as the "Signal Indicator" that is connected also does not repaint. If you developed your own SI make sure that you understand and know how to prevent this behavior. The publication by @PineCoders here will give you a good idea on how to avoid most of the repainting cases.
⚠️ There is an exception though, when the "Enable Trail⚠️💹" checkbox is checked, the Take Profit trailing feature is enabled, and a tick-based approach is used, meaning that after a while, when the TradingView discards all the real-time data, assumptions will be made by the backtesting engine that will cause a form of repainting. To avoid making false assumptions please disable this feature in the early stages and evaluate its usefulness in your strategy later on, after first confirming the success of the logic without this feature. In this case, consider turning on the bar magnifier feature. This way you will get more accurate backtest results when the Take Profit trailing feature is enabled.
💢 Can "Template Trailing Strategy (Backtester)" satisfy all my trading strategies ❓
While this framework can satisfy quite a large number of trading strategies there are cases where it cannot do so. For example, if you have a custom logic for your stop-loss or take-profit placement, or if you want to dollar cost average, then it might be better to start a new strategy script from scratch.
⚠️ It is not recommended to copy the official TTS code and start developing unless you are a Pine wizard! Even in that case, there is a stiff learning curve that might not be worth your time. Last, you must consider that I do not offer support for customized versions of the TTS script and if something goes wrong in the process you are all alone.
💝 Support & Feedback
For feedback, bug reports, or feature requests, contact me via TradingView PM or use the script comments.
Note: The author's personal links and contact are available on the TradingView profile.
🤗 Thanks
Special thanks to the welcoming community members, who regularly gave feedback all those years and helped me to shape the framework as it is today! Thanks everyone who contributed by either filing a "defect report" or asking questions that helped me to understand what improvements were necessary to help traders.
Enjoy!
Jason

Buy / Sell indicator light version [Crypto_BCT]The indicator is based on the search for the lowest bars in a given period (can be customized).
You can add a search for the highest bars to determine the closed order points.
You can add a filter by the value of the RSI (you can customized it separately for buying and selling).
Alerts for buying and selling are set.
It can be used to work with bots, for example 3COMMAS DCA bot.
--------------------------
Signal Condition Settings:
(Buy) Lowest Bar
The closing of the current bar is lower than the closing of the bars back in this range
(Buy) RSI value <
The RSI index is below this value
(Sell) Highest Bar
The closing of the current bar is higher than the closing of bars in this range
(Sell) RSI value >
The RSI index is higher than this value
