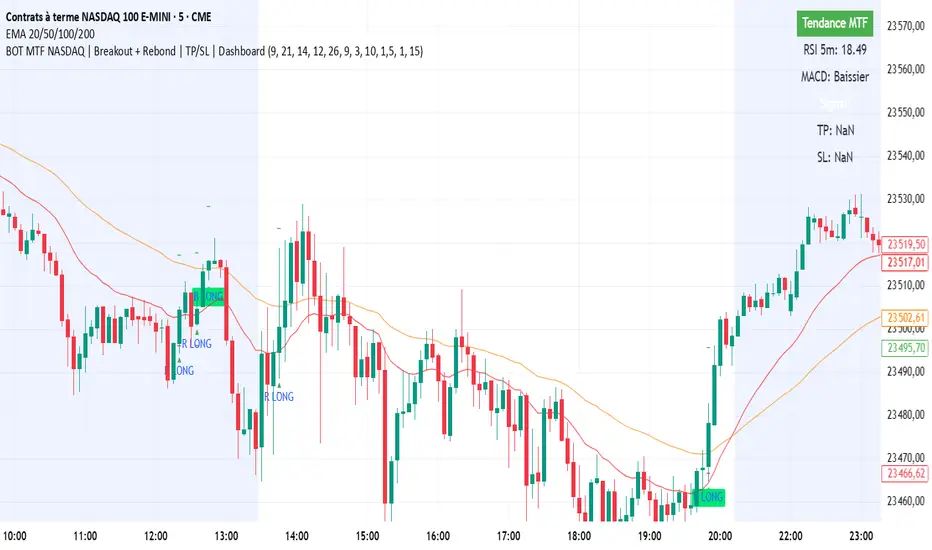
BOT MTF NASDAQ | Breakout + Rebond | TP/SL | DashboardBOT MTF NASDAQ | Breakout + Rebond | TP/SL | Dashboard
Cari dalam skrip untuk "bot"
Bot Analyzer📌 Script Name: Bot Analyzer
This TradingView Pine Script v5 indicator creates a dashboard table on the chart that helps you analyze any asset for running a martingale grid bot on futures.
🔧 User Inputs
TP % (tpPct): Take Profit percentage.
SO step % (soStepPct): Step size between safety orders.
SO n (soCount): Number of safety orders.
M mult (martMult): Martingale multiplier (how much each next order increases in size).
Lev (leverage): Leverage used in futures.
BB len / BB mult: Bollinger Bands settings for measuring channel width.
ATR len: ATR period for volatility.
HV days: Lookback window (days) for Historical Volatility calculation.
📐 Calculations
ATR % (atrPct): Normalized ATR relative to price.
Bollinger Band width % (bbPct): Market channel width as percentage of basis.
Historical Volatility (hvAnn): Annualized volatility, calculated from daily log returns.
Dynamic Step % (dynStepPct): Step size for safety orders, automatically adjusted from ATR and clamped between 0.3% and 5%.
Covered Move % (coveredPct): Total percentage move the bot can withstand before last safety order.
Martingale Size Factor (sizeFactor): Total position size multiplier after all safety orders, based on martingale multiplier.
Risk Score (riskLabel): Simple risk estimate:
Low if risk < 30
Mid if risk < 60
High if risk ≥ 60
📊 Output (Table on Chart)
At the top-right of the chart, the script draws a table with 9 rows:
Metric Value
BB % Bollinger Band width in %
HV % Historical Volatility (annualized %)
TP % Take profit setting
SO step % Safety order step size
SO n Number of safety orders
M mult Martingale multiplier
Dyn step % Dynamic step based on ATR
Size x Total position size factor (e.g., 4.5x)
Risk Risk label (Low / Mid / High)
⚙️ Use Case
Helps choose coins for a martingale bot:
If BB% is wide and HV% is high → the asset is volatile enough.
If Risk shows "High" → parameters are aggressive, you may need to adjust step size, SO count, or leverage.
The dashboard lets you compare assets quickly without switching between multiple indicators.

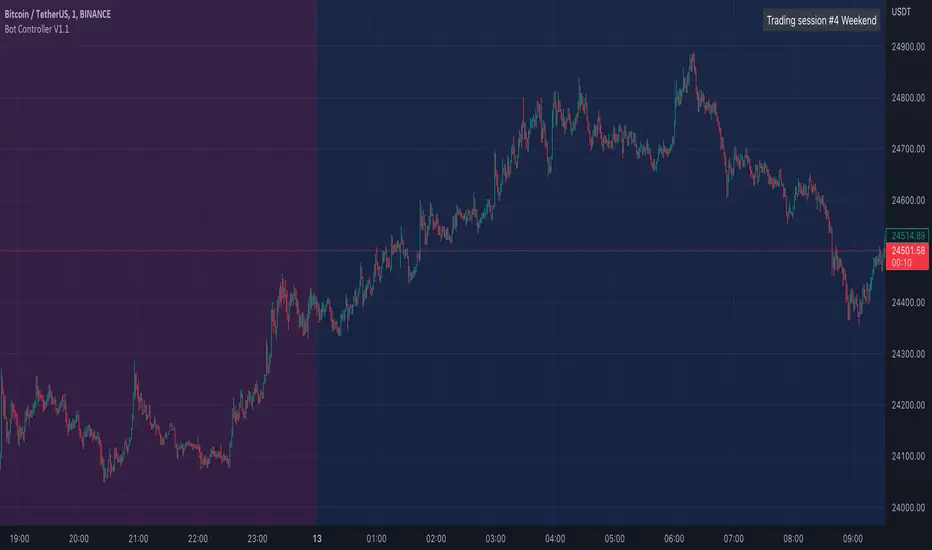
Bot Controller V1.1This script allows you to define various trading sessions with alerts for when the session starts and ends. This allows you to do things like switch your trading bots off while you are sleeping.
It starts with default settings for weekday daytime, evening, nighttime, and weekends
Setup recommendations:
Use the Timezone setting in the indicator to match your trading view timezone setting to have alerts triggered when you expect
Add alerts from a lower TF e.g 1min chart
Use once per bar for the alerts
Notes on alerts:
If you have a session stop then immediately have another starting with no time break in between the start/stop alerts may overlap/trigger at the same time so it's probably best just to use the stop or start alerts for each session.

Grid Bot Parabolic [xxattaxx]🟩 The Grid Bot Parabolic, a continuation of the Grid Bot Simulator Series , enhances traditional gridbot theory by employing a dynamic parabolic curve to visualize potential support and resistance levels. This adaptability is particularly useful in volatile or trending markets, enabling traders to explore grid-based strategies and gain deeper market insights. The grids are divided into customizable trade zones that trigger signals as prices move into new zones, empowering traders to gain deeper insights into market dynamics and potential turning points.
While traditional grid bots excel in ranging markets, the Grid Bot Parabolic’s introduction of acceleration and curvature adds new dimensions, enabling its use in trending markets as well. It can function as a traditional grid bot with horizontal lines, a tilted grid bot with linear slopes, or a fully parabolic grid with curves. This dynamic nature allows the indicator to adapt to various market conditions, providing traders with a versatile tool for visualizing dynamic support and resistance levels.
🔑 KEY FEATURES 🔑
Adaptable Grid Structures (Horizontal, Linear, Curved)
Buy and Sell Signals with Multiple Trigger/Confirmation Conditions
Secondary Buy and Secondary Sell Signals
Projected Grid Lines
Customizable Grid Spacing and Zones
Acceleration and Curvature Control
Sensitivity Adjustments
📐 GRID STRUCTURES 📐
Beyond its core parabolic functionality, the Parabolic Grid Bot offers a range of grid configurations to suit different market conditions and trading preferences. By adjusting the "Acceleration" and "Curvature" parameters, you can transform the grid's structure:
Parabolic Grids
Setting both acceleration and curvature to non-zero values results in a parabolic grid.This configuration can be particularly useful for visualizing potential turning points and trend reversals. Example: Accel = 10, Curve = -10)
Linear Grids
With a non-zero acceleration and zero curvature, the grid tilts to represent a linear trend, aiding in identifying potential support and resistance levels during trending phases. Example: Accel =1.75, Curve = 0
Horizontal Grids
When both acceleration and curvature are set to zero, the indicator reverts to a traditional grid bot with horizontal lines, suitable for ranging markets. Example: Accel=0, Curve=0
⚙️ INITIAL SETUP ⚙️
1.Adding the Indicator to Your Chart
Locate a Starting Point: To begin, visually identify a price point on your chart where you want the grid to start.This point will anchor your grid.
2. Setting Up the Grid
Add the Grid Bot Parabolic Indicator to your chart. A “Start Time/Price” dialog will appear
CLICK on the chart at your chosen start point. This will anchor the start point and open a "Confirm Inputs" dialog box.
3. Configure Settings. In the dialog box, you can set the following:
Acceleration: Adjust how quickly the grid reacts to price changes.
Curve: Define the shape of the parabola.
Intervals: Determine the distance between grid levels.
If you choose to keep the default settings, with acceleration set to 0 and curve set to 0, the grid will display as traditional horizontal lines. The grid will align with your selected price point, and you can adjust the settings at any time through the indicator’s settings panel.
⚙️ CONFIGURATION AND SETTINGS ⚙️
Grid Settings
Accel (Acceleration): Controls how quickly the price reacts to changes over time.
Curve (Curvature): Defines the overall shape of the parabola.
Intervals (Grid Spacing): Determines the vertical spacing between the grid lines.
Sensitivity: Fine tunes the magnitude of Acceleration and Curve.
Buy Zones & Sell Zones: Define the number of grid levels used for potential buy and sell signals.
* Each zone is represented on the chart with different colors:
* Green: Buy Zones
* Red: Sell Zones
* Yellow: Overlap (Buy and Sell Zones intersect)
* Gray: Neutral areas
Trigger: Chooses which part of the candlestick is used to trigger a signal.
* `Wick`: Uses the high or low of the candlestick
* `Close`: Uses the closing price of the candlestick
* `Midpoint`: Uses the middle point between the high and low of the candlestick
* `SWMA`: Uses the Symmetrical Weighted Moving Average
Confirm: Specifies how a signal is confirmed.
* `Reverse`: The signal is confirmed if the price moves in the opposite direction of the initial trigger
* `Touch`: The signal is confirmed when the price touches the specified level or zone
Sentiment: Determines the market sentiment, which can influence signal generation.
* `Slope`: Sentiment is based on the direction of the curve, reflecting the current trend
* `Long`: Sentiment is bullish, favoring buy signals
* `Short`: Sentiment is bearish, favoring sell signals
* `Neutral`: Sentiment is neutral. No secondary signals will be generated
Show Signals: Toggles the display of buy and sell signals on the chart
Chart Settings
Grid Colors: These colors define the visual appearance of the grid lines
Projected: These colors define the visual appearance of the projected lines
Parabola/SWMA: Adjust colors as needed. These are disabled by default.
Time/Price
Start Time & Start Price: These set the starting point for the parabolic curve.
* These fields are automatically populated when you add the indicator to the chart and click on an initial location
* These can be adjusted manually in the settings panel, but he easiest way to change these is by directly interacting with the start point on the chart
Please note: Time and Price must be adjusted for each chart when switching assets. For example, a Start Price on BTCUSD of $60,000 will not work on an ETHUSD chart.
🤖 ALGORITHM AND CALCULATION 🤖
The Parabolic Function
At the core of the Parabolic Grid Bot lies the parabolic function, which calculates a dynamic curve that adapts to price action over time. This curve serves as the foundation for visualizing potential support and resistance levels.
The shape and behavior of the parabola are influenced by three key user-defined parameters:
Acceleration: This parameter controls the rate of change of the curve's slope, influencing its tilt or steepness. A higher acceleration value results in a more pronounced tilt, while a lower value leads to a gentler slope. This applies to both curved and linear grid configurations.
Curvature: This parameter introduces and controls the curvature or bend of the grid. A higher curvature value results in a more pronounced parabolic shape, while a lower value leads to a flatter curve or even a straight line (when set to zero).
Sensitivity: This setting fine-tunes the overall responsiveness of the grid, influencing how strongly the Acceleration and Curvature parameters affect its shape. Increasing sensitivity amplifies the impact of these parameters, making the grid more adaptable to price changes but potentially leading to more frequent adjustments. Decreasing sensitivity reduces their impact, resulting in a more stable grid structure with fewer adjustments. It may be necessary to adjust Sensitivity when switching between different assets or timeframes to ensure optimal scaling and responsiveness.
The parabolic function combines these parameters to generate a curve that visually represents the potential path of price movement. By understanding how these inputs influence the parabola's shape and behavior, traders can gain valuable insights into potential support and resistance areas, aiding in their decision-making process.
Sentiment
The Parabolic Grid Bot incorporates sentiment to enhance signal generation. The "Sentiment" input allows you to either:
Manually specify the market sentiment: Choose between 'Long' (bullish), 'Short' (bearish), or 'Neutral'.
Let the script determine sentiment based on the slope of the parabolic curve: If 'Slope' is selected, the sentiment will be considered 'Long' when the curve is sloping upwards, 'Short' when it's sloping downwards, and 'Neutral' when it's flat.
Buy and Sell Signals
The Parabolic Grid Bot generates buy and sell signals based on the interaction between the price and the grid levels.
Trigger: The "Trigger" input determines which part of the candlestick is used to trigger a signal (wick, close, midpoint, or SWMA).
Confirmation: The "Confirm" input specifies how a signal is confirmed ('Reverse' or 'Touch').
Zones: The number of "Buy Zones" and "Sell Zones" determines the areas on the grid where buy and sell signals can be generated.
When the trigger condition is met within a buy zone and the confirmation criteria are satisfied, a buy signal is generated. Similarly, a sell signal is generated when the trigger and confirmation occur within a sell zone.
Secondary Signals
Secondary signals are generated when a regular buy or sell signal contradicts the prevailing sentiment. For example:
A buy signal in a bearish market (Sentiment = 'Short') would be considered a "secondary buy" signal.
A sell signal in a bullish market (Sentiment = 'Long') would be considered a "secondary sell" signal.
These secondary signals are visually represented on the chart using hollow triangles, differentiating them from regular signals (filled triangles).
While they can be interpreted as potential contrarian trade opportunities, secondary signals can also serve other purposes within a grid trading strategy:
Exit Signals: A secondary signal can suggest a potential shift in market sentiment or a weakening trend. This could be a cue to consider exiting an existing position, even if it's currently profitable, to lock in gains before a potential reversal
Risk Management: In a strong trend, secondary signals might offer opportunities for cautious counter-trend trades with controlled risk. These trades could utilize smaller position sizes or tighter stop-losses to manage potential downside if the main trend continues
Dollar-Cost Averaging (DCA): During a prolonged trend, the parabolic curve might generate multiple secondary signals in the opposite direction. These signals could be used to implement a DCA strategy, gradually accumulating a position at potentially favorable prices as the market retraces or consolidates within the larger trend
Secondary signals should be interpreted with caution and considered in conjunction with other technical indicators and market context. They provide additional insights into potential market reversals or consolidation phases within a broader trend, aiding in adapting your grid trading strategy to the evolving market dynamics.
Examples
Trigger=Wick, Confirm=Touch. Signals are generated when the wick touches the next gridline.
Trigger=Close, Confirm=Touch. Signals require the close to touch the next gridline.
Trigger=SWMA, Confirm=Reverse. Signals are triggered when the Symmetrically Weighted Moving Average reverse crosses the next gridline.
🧠THEORY AND RATIONALE 🧠
The innovative approach of the Parabolic Grid Bot can be better understood by first examining the limitations of traditional grid trading strategies and exploring how this indicator addresses them by incorporating principles of market cycles and dynamic price behavior
Traditional Grid Bots: One-Dimensional and Static
Traditional grid bots operate on a simple premise: they divide the price chart into a series of equally spaced horizontal lines, creating a grid of trading zones. These bots excel in ranging markets where prices oscillate within a defined range. Buy and sell orders are placed at these grid levels, aiming to profit from mean reversion as prices bounce between the support and resistance zones.
However, traditional grid bots face challenges in trending markets. As the market moves in one direction, the bot continues to place orders in that direction, leading to a stacking of positions. If the market eventually reverses, these stacked trades can be profitable, amplifying gains. But the risk lies in the potential for the market to continue trending, leaving the trader with a series of losing trades on the wrong side of the market
The Parabolic Grid Bot: Adding Dimensions
The Parabolic Grid Bot addresses the limitations of traditional grid bots by introducing two additional dimensions:
Acceleration (Second Dimension): This parameter introduces a second dimension to the grid, allowing it to tilt upwards or downwards to align with the prevailing market trend. A positive acceleration creates an upward-sloping grid, suitable for uptrends, while a negative acceleration results in a downward-sloping grid, ideal for downtrends. The magnitude of acceleration controls the steepness of the tilt, enabling you to fine-tune the grid's responsiveness to the trend's strength
Curvature (Third Dimension): This parameter adds a third dimension to the grid by introducing a parabolic curve. The curve's shape, ranging from gentle bends to sharp turns, is controlled by the curvature value. This flexibility allows the grid to closely mirror the market's evolving structure, potentially identifying turning points and trend reversals.
Mean Reversion in Trending Markets
Even in trending markets, the Parabolic Grid Bot can help identify opportunities for mean reversion strategies. While the grid may be tilted to reflect the trend, the buy and sell zones can capture short-term price oscillations or consolidations within the broader trend. This allows traders to potentially pinpoint entry and exit points based on temporary pullbacks or reversals.
Visualize and Adapt
The Parabolic Grid Bot acts as a visual aid, enhancing your understanding of market dynamics. It allows you to "see the curve" by adapting the grid to the market's patterns. If the market shows a parabolic shape, like an upward curve followed by a peak and a downward turn (similar to a head and shoulders pattern), adjust the Accel and Curve to match. This highlights potential areas of interest for further analysis.
Beyond Straight Lines: Visualizing Market Cycle
Traditional technical analysis often employs straight lines, such as trend lines and support/resistance levels, to interpret market movements. However, many analysts, including Brian Millard, contend that these lines can be misleading. They propose that what might appear as a straight line could represent just a small part of a larger curve or cycle that's not fully visible on the chart.
Markets are inherently cyclical, marked by phases of expansion, contraction, and reversal. The Parabolic Grid Bot acknowledges this cyclical behavior by offering a dynamic, curved grid that adapts to these shifts. This approach helps traders move beyond the limitations of straight lines and visualize potential support and resistance levels in a way that better reflects the market's true nature
By capturing these cyclical patterns, whether subtle or pronounced, the Parabolic Grid Bot offers a nuanced understanding of market dynamics, potentially leading to more accurate interpretations of price action and informed trading decisions.
⚠️ DISCLAIMER⚠️
This indicator utilizes a parabolic curve fitting approach to visualize potential support and resistance levels. The mathematical formulas employed have been designed with adaptability and scalability in mind, aiming to accommodate various assets and price ranges. While the resulting curves may visually resemble parabolas, it's important to note that they might not strictly adhere to the precise mathematical definition of a parabola.
The indicator's calculations have been tested and generally produce reliable results. However, no guarantees are made regarding their absolute mathematical accuracy. Traders are encouraged to use this tool as part of their broader analysis and decision-making process, combining it with other technical indicators and market context.
Please remember that trading involves inherent risks, and past performance is not indicative of future results. It is always advisable to conduct your own research and exercise prudent risk management before making any trading decisions.
🧠 BEYOND THE CODE 🧠
The Parabolic Grid Bot, like the other grid bots in this series, is designed with education and community collaboration in mind. Its open-source nature encourages exploration, experimentation, and the development of new grid trading strategies. We hope this indicator serves as a framework and a starting point for future innovations in the field of grid trading.
Your comments, suggestions, and discussions are invaluable in shaping the future of this project. We welcome your feedback and look forward to seeing how you utilize and enhance the Parabolic Grid Bot.

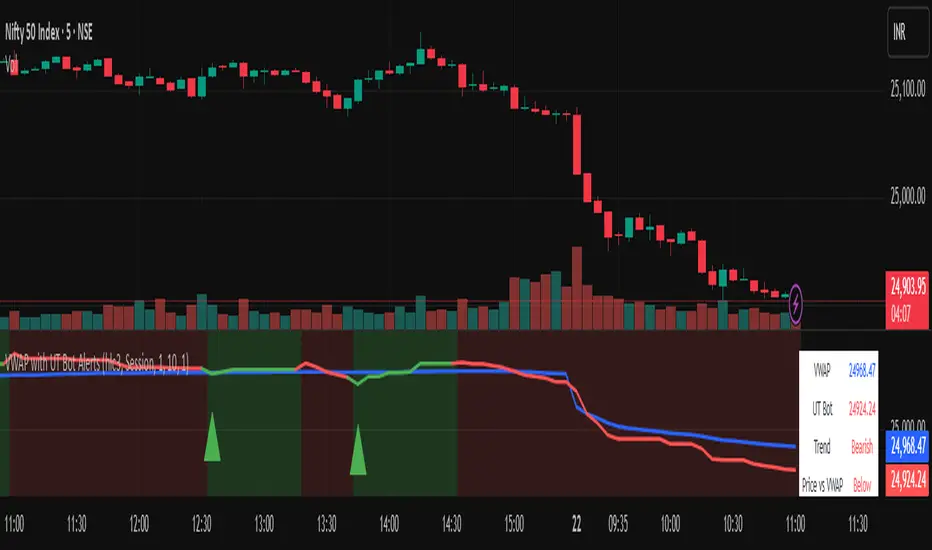
Vwapbot (VWAP + Ut Bot Alerts)Vwapbot (VWAP + Ut Bot Alerts) - Complete Guide
This Pine Script indicator combines two powerful trading tools: Volume Weighted Average Price (VWAP) and the UT Bot trend-following system. Here's a comprehensive breakdown:
What This Indicator Does
The indicator provides:
1. VWAP calculation with deviation bands
2. UT Bot trend signals with trailing stops
3. Combined confluence alerts when both indicators align
4. Visual information table showing current market conditions
Core Components
1. VWAP (Volume Weighted Average Price)
What it is: VWAP calculates the average price weighted by volume, giving more importance to high-volume periods.
Settings:
• VWAP Source: Price used for calculation (default: hlc3 - average of high, low, close)
• VWAP Anchor: Reset period (Session/Week/Month/Quarter/Year)
Usage:
• Price above VWAP = bullish bias
• Price below VWAP = bearish bias
• VWAP acts as dynamic support/resistance
2. VWAP Deviation Bands
What they show: Statistical boundaries around VWAP based on price volatility
Settings:
• Standard Deviation Multiplier: How far the bands extend (default: 1.0)
• Show Bands: Toggle visibility
Usage:
• Gray dashed lines: 1 standard deviation bands (normal price range)
• Red dotted lines: 2 standard deviation bands (extreme price levels)
• Price touching outer bands may indicate reversal opportunities
3. UT Bot (Ultimate Trend Bot)
What it does: Creates a trailing stop system that follows trends and signals reversals
Settings:
• Key Value: Sensitivity multiplier (1.0 = balanced, lower = more sensitive)
• ATR Period: Lookback period for volatility calculation (default: 10)
How it works:
• Uses ATR (Average True Range) to calculate dynamic support/resistance levels
• Green line = uptrend (trailing stop below price)
• Red line = downtrend (trailing stop above price)
4. UT Bot Alerts are integrated to the logic of Volume Profile i,e VWAP, the UT Bot Stop trailing line plot its data and change trends obtaining it's logic from the VWAP and Standard Deviation bands, thus it differs in it's logic of UT Bot alerts from other indicators.
Visual Elements
On-Chart Displays:
1. Blue line: VWAP
2. Gray lines: 1st deviation bands
3. Red lines: 2nd deviation bands
4. Green/Red thick line: UT Bot trailing stop
5. Green triangles up: Buy signals
6. Red triangles down: Sell signals
7. Background color: Light green (bullish) / Light red (bearish)
Information Table (Top Right):
• VWAP: Current VWAP value
• UT Bot: Current trailing stop level
• Trend: Bullish/Bearish status
• Price vs VWAP: Above/Below comparison
• Deviation: Percentage distance from VWAP
• Volume: Current bar volume
Trading Signals
Basic Signals:
1. UT Bot Buy: Green triangle when trend turns bullish
2. UT Bot Sell: Red triangle when trend turns bearish
3. VWAP Cross Above: Price crosses above VWAP
4. VWAP Cross Below: Price crosses below VWAP
Confluence Signals :
1. Bullish Confluence: UT Bot buy signal + Price above VWAP
2. Bearish Confluence: UT Bot sell signal + Price below VWAP
How to Use This Indicator
For Trend Following:
1. Enter long when you get a bullish confluence signal
2. Enter short when you get a bearish confluence signal
3. Exit when the UT Bot trend changes color
For Mean Reversion:
1. Look for reversals when price hits the 2nd deviation bands
2. Confirm with UT Bot signals
3. Target return to VWAP
For Support/Resistance:
1. Use VWAP as dynamic support in uptrends, resistance in downtrends
2. Watch for bounces at deviation bands
3. Confirm direction with UT Bot trend color
Best Practices
Timeframes:
• Intraday: Use Session VWAP anchor
• Swing trading: Use Weekly/Monthly anchors
• Position trading: Use Monthly/Quarterly anchors
Risk Management:
• Stop loss: Below/above the UT Bot trailing stop
• Position sizing: Smaller positions when price is at extreme deviation bands
• Confluence: Wait for both VWAP and UT Bot alignment for strongest signals
Market Conditions:
• Trending markets: Focus on UT Bot signals and VWAP direction bias
• Ranging markets: Use deviation bands for entry/exit points
• High volume periods: VWAP becomes more significant
Alert System
The indicator provides 6 types of alerts:
1. UT Bot buy/sell signals
2. VWAP crossover alerts
3. Confluence alerts (most important)
Set up alerts for confluence signals to catch the highest probability setups when both indicators align.
This indicator works best when combined with proper risk management and used in conjunction with market structure analysis. The confluence signals provide the highest probability entries, while the individual components help with market.
Advice from the publisher:
For using with Indices e.g NIFTY 50, BANKNIFTY etc. use parameters:
UT BOT Key Value : 1
UT BOT ATR Period : 10
Standard Deviation Multiplier : 1 {Default}
For using with commodities e.g NATURALGAS, CRUDEOIL etc. use parameters:
UT BOT Key Value : 2
UT BOT ATR Period : 7
Standard Deviation Multiplier : 1 {Default}
UT Bot + Hull MA Confirmed Signal DelayOverview
This indicator is designed to detect high-probability reversal entry signals by combining "UT Bot Alerts" (UT Bot Alerts script adapted from QuantNomad - Originally developed by Yo_adriiiiaan and idea of original code for "UT Bot Alerts" from HPotter ) with confirmation from a Hull Moving Average (HMA) Developed by Alan Hull . It focuses on capturing momentum shifts that often precede trend reversals, helping traders identify potential entry points while filtering out false signals.
🔍 How It Works
This strategy operates in two stages:
1. UT Bot Momentum Trigger
The foundation of this script is the "UT Bot Alerts" , which uses an ATR-based trailing stop to detect momentum changes. Specifically:
The script calculates a dynamic stop level based on the Average True Range (ATR) multiplied by a user-defined sensitivity factor (Key Value).
When price closes above this trailing stop and the short-term EMA crosses above the stop, a potential buy setup is triggered.
Conversely, when price closes below the trailing stop and the short-term EMA crosses below, a potential sell setup is triggered.
These UT Bot alerts are designed to identify the initial shift in market direction, acting as the first filter in the signal process.
2. Hull MA Confirmation
To reduce noise and false triggers from the UT Bot alone, this script delays the entry signal until price confirms the move by crossing the Hull Moving Average (or its variants: HMA, THMA, EHMA) in the same direction as the UT Bot trigger:
A Buy Signal is generated only when:
A UT Bot Buy condition is active, and
The price closes above the Hull MA.
Or, if a UT Bot Buy condition was recently triggered but price hadn’t yet crossed above the Hull MA, a delayed buy is signaled when price finally breaks above it.
A Sell Signal is generated only when:
A UT Bot Sell condition is active, and
The price closes below the Hull MA.
Similarly, a delayed sell signal can occur if price breaks below the Hull MA shortly after a UT Bot Sell trigger.
This dual-confirmation process helps traders avoid premature entries and improves the reliability of reversal signals.
📈 Best Use Cases
Reversal Trading: This strategy is particularly well-suited for catching early trend reversals rather than trend continuations. It excels at identifying momentum pivots that occur after pullbacks or exhaustion moves.
Heikin Ashi Charts Recommended: The script offers a Heikin Ashi mode for smoothing out noise and enhancing visual clarity. Using Heikin Ashi candles can further reduce whipsaws and highlight cleaner shifts in trend direction.
MACD Alignment: For best results, trade in the direction of the MACD trend or use it as a filter to avoid counter-trend trades.
⚠️ Important Notes
Entry Signals Only: This indicator only plots entry points (Buy and Sell signals). It does not define exit strategies, so users should manage trades manually using trailing stops, profit targets, or other exit indicators.
No Signal = No Confirmation: You may see a UT Bot trigger without a corresponding Buy/Sell signal. This means the price did not confirm the move by crossing the Hull MA, and therefore the setup was considered too weak or incomplete.
⚙️ Customization
UT Bot Sensitivity: Adjust the “Key Value” and “ATR Period” to make the UT Bot more or less reactive to price action.
Use Heikin Ashi: Toggle between standard candles or Heikin Ashi in the indicator settings for a smoother trading experience.
The HMA length may also be modified in the indicator settings from its standard 55 length to increase or decrease the sensitivity of signal.
This strategy is best used by traders looking for a structured, logic-based way to enter early into reversals with added confirmation to reduce risk. By combining two independent systems—momentum detection (UT Bot) and trend confirmation (Hull MA)—it aims to provide high-confidence entries without overwhelming complexity.
Let the indicator guide your entries—you manage the exits.
Examples of use:
Futures:
Stock:
Crypto:
As shown in the snapshots this strategy, like most, works the best when price action has a sizeable ATR and works the least when price is choppy. Therefore it is always best to use this system when price is coming off known support or resistance levels and when it is seen to respect short term EMA's like the 9 or 15.
My personal preference to use this system is for day trading on a 3 or 5 minute chart. But it is valid for all timeframes and simply marks a high probability for a new trend to form.
Sources:
Quant Nomad - www.tradingview.com
Yo_adriiiiaan - www.tradingview.com
HPotter - www.tradingview.com
Hull Moving Average - alanhull.com

Ultimate UT Bot ScreenerWhat Does the Ultimate UT Bot Screener Do?
Ultimate UT Bot Screener will help you navigate UT Bot signals and backtest results for up to 40 instruments simultaneously. It scans the market for provided UT Bot indicator parameters, calculates essential metrics, and displays the information in 1 fully customizable table.
How Does It Work?
Market Scanning : The screener scans multiple instruments for the selected timeframe, ensuring you never miss an opportunity.
Customizable Parameters : Adjust the UT Bot parameters to fit your unique trading style and risk tolerance.
Filtering and Sorting : Use advanced filtering and sorting options to narrow down the results based on your specific criteria.
Alerts and Notifications : Set up custom alerts to stay updated on important market movements and potential trades.
Visual Customization : Tailor the screener's visual appearance to suit your preferences, making data interpretation effortless.
Currently, Ultimate UT Bot Screener Supports 13 columns:
Price - the last price of the instrument
UT Signal - last UT bot signal. Value in the square brackets ( for ex.) means how many bars ago the last signal fired.
Move To Revert —We have to observe the price move for the current bar to see the UT Bot signal change.
Revert Prob - probability estimation for UT Bot to revert for the current bar.
Trade History - the last five trade outcomes are coded as green(profit)/red(loss) squares.
Total Trades - total trades number for UT Bot strategy for the entire available history.
Current P&L - P&L for the open trade
Trade Avg P&L - Average P&L for the last X trades
Trade Prof - percent profitable trades from the last X trades
Profit Factor - profit factor the last X trades
Net Profit - total net Profit for the last X trades
Max DD - maximum drawdown for the last X trades Avg Bars in Trades - average trade duration for the last X trades
How to Use the Ultimate UT Bot Screener
Using the Ultimate UT Bot Screener is straightforward:
Set Up Your Screener : Choose the instruments you want to monitor and configure the columns to display the data most relevant to you.
Customize Parameters : Fine-tune the UT Bot parameters to align with your trading strategy. Filter and Sort: Apply filters to isolate the most promising trading opportunities and sort the results based on your priorities.
Monitor and Act: Keep an eye on the screener and act on the high-probability signals it generates. Set up alerts to ensure you never miss a critical trade.
Why Is the Ultimate UT Bot Screener Original and Worth Paying For?
Highly Customizable : our tool allows you to configure almost every element, from the set of columns and instruments to the UT Bot parameters and visual appearance.
User-Friendly Interface : Designed with traders in mind, the screener offers an intuitive interface that makes complex data easy to understand and act upon.
Time-Saving : By automating the market scanning and analysis process, it saves you valuable time and effort, allowing you to focus on executing your trades.
Real-Time Alerts : Stay ahead of the market with customizable alerts that notify you of important events and potential trades.
Disclaimer : Please remember that past performance may not be indicative of future results. Due to various factors, including changing market conditions, the strategy may no longer perform as well as in historical backtesting. This post and the script don't provide any financial advice.

Sigwo Tech AI - 3m TF BitMex BotI’ve made a ROI of 600%+ (and counting) in 91 days using this bot and the ‘close when large’ method described below. First, some stuff. There are zero guarantees of the bot working well for you like it does me. Some is ‘guts’ and some is ‘damn this bot rocks’. I’m always open to help with advice. I will not listen to whining or otherwise unsavory words. This bot doesn’t substitute learning how to trade. Get a load of this Mango Sauce, it rocks!
You will need a few things:
TradingView account (free account will not work, but be Pro, recommend Pro+)
You will need an AutoView subscription (coupon: 5CPLM-4PY3Q-EEWJN)
You'll need a Bitmex or a Deribit account (bitmex - www.bitmex.com)
VPN (always a good idea when connecting to exchanges)
You need to email info@gojupiter.tech to gain access to the indicator. In the email, we need your TradingView username
Setup instructions:
Add the indicator to your 3m TF chart (not tuned for other timeframes)
Right click on an area of the 'Study STAI' indicator, click "Add alert on 'Study STAI'"
In the box that pops up, select the drop down "Short" and select the box 'Once per bar close'
In the 'Message' box, copy paste the following (no quotes):
"Short!
a=bitmexlive e=bitmex s=xbtusd b=short q=1000 l=10 t=limit"
l=leverage q=quantity of contracts in $ amount
Do the same procedure above to make 'Long' alert, but insert the below in the new 'Message' box.
"Long!
a=bitmexlive e=bitmex s=xbtusd b=long q=1000 l=10 t=limit"
Save the alert. You should now see the alerts in the left side of your browser and a green dot next to them. You are live and ready to rock!
Notes:
You must have a browser open for the orders to fire! You will still receive alerts, but the orders will NOT fire unless a browser is open!
Nothing is infallible. Bots should be checked 3-4 times a day to ensure orders are executing properly and to check if the orders are 'lopsided'. Alerts for price support/resistance should be set by you and checked when the alert comes in. This usually means you have a chance to close a nice large position in profit manually….yes there are some manual interactions you can take with the bot when necessary but it happens maybe 3-4 times a WEEK. This could be more, depending on the price action of the market. Example: Overnight, XBTUSD market was very sideways in a generally upward move. When I woke up, the bot had made a little money (0.0025 or so) but also accumulated a $34,000 short. The short was well positioned (9616) and the market was hovering around 9575. I closed $10,000 manually at 9575 and left the rest until we broke downward to 9540. This brought the bot back into a ‘neutral’ position to alleviate lopsidedness,or being to large in one direction or another. The point of this bot is NOT to make LARGE amounts on every trade….The point of this bot is to be profitable in little chunks by being quick and providing liquidity (0.025% rebate for limit order). Do NOT try to ‘pile on orders’ in the direction your bot is traveling! You WILL eventually lose big. I’ve done it twice, and then I stopped doing that. Over $30,000 lost on those 2 moves because I got greedy and tried to override the bot. (I’ve recovered those losses by letting the bot do its thing)
CLOSE manually do NOT OPEN manually!
Let the bot run 24x7 and leave the orders that are not hit alone...price action will eventually come back and pick it up.
*I reserve the right to remove your access if you are unsavory or I find you conducting unauthorized sharing. You will be warned at LEAST once before any punitive measures are taken.*
Gyspy Bot Trade Engine - V1.2B - Alerts - 12-7-25 - SignalLynxGypsy Bot Trade Engine (MK6 V1.2B) - Alerts & Visualization
Brought to you by Signal Lynx | Automation for the Night-Shift Nation 🌙
1. Executive Summary & Architecture
Gypsy Bot (MK6 V1.2B) is not merely a strategy; it is a massive, modular Trade Engine built specifically for the TradingView Pine Script V6 environment. While most tools rely on a single dominant indicator to generate signals, Gypsy Bot functions as a sophisticated Consensus Algorithm.
Note: This is the Indicator / Alerts version of the engine. It is designed for visual analysis and generating live alert signals for automation. If you wish to see Backtest data (Equity Curves, Drawdown, Profit Factors), please use the Strategy version of this script.
The engine calculates data from up to 12 distinct Technical Analysis Modules simultaneously on every bar closing. It aggregates these signals into a "Vote Count" and only fires a signal plot when a user-defined threshold of concurring signals is met. This "Voting System" acts as a noise filter, requiring multiple independent mathematical models—ranging from volume flow and momentum to cyclical harmonics and trend strength—to agree on market direction.
Beyond entries, Gypsy Bot features a proprietary Risk Management suite called the Dump Protection Team (DPT). This logic layer operates independently of the entry modules, specifically scanning for "Moon" (Parabolic) or "Nuke" (Crash) volatility events to signal forced exits, preserving capital during Black Swan events.
2. ⚠️ The Philosophy of "Curve Fitting" (Must Read)
One must be careful when applying Gypsy Bot to new pairs or charts.
To be fully transparent: Gypsy Bot is, by definition, a very advanced curve-fitting engine. Because it grants the user granular control over 12 modules, dozens of thresholds, and specific voting requirements, it is extremely easy to "over-fit" the data. You can easily toggle switches until the charts look perfect in hindsight, only to have the signals fail in live markets because they were tuned to historical noise rather than market structure.
To use this engine successfully:
Visual Verification: Do not just look for "green arrows." Look for signals that occur at logical market structure points.
Stability: Ensure signals are not flickering. This script uses closed-candle logic for key decisions to ensure that once a signal plots, it remains painted.
Regular Maintenance is Mandatory: Markets shift regimes (e.g., from Bull Trend to Crab Range). Gypsy Bot settings should be reviewed and adjusted at regular intervals to ensure the voting logic remains aligned with current market volatility.
Timeframe Recommendations:
Gypsy Bot is optimized for High Time Frame (HTF) trend following. It generally produces the most reliable results on charts ranging from 1-Hour to 12-Hours, with the 4-Hour timeframe historically serving as the "sweet spot" for most major cryptocurrency assets.
3. The Voting Mechanism: How Entries Are Generated
The heart of the Gypsy Bot engine is the ActivateOrders input (found in the "Order Signal Modifier" settings).
The engine constantly monitors the output of all enabled Modules.
Long Votes: GoLongCount
Short Votes: GoShortCount
If you have 10 Modules enabled, and you set ActivateOrders to 7:
The engine will ONLY plot a Buy Signal if 7 or more modules return a valid "Buy" signal on the same closed candle.
If only 6 modules agree, the signal is rejected.
4. Technical Deep Dive: The 12 Modules
Gypsy Bot allows you to toggle the following modules On/Off individually to suit the asset you are trading.
Module 1: Modified Slope Angle (MSA)
Logic: Calculates the geometric angle of a moving average relative to the timeline.
Function: Filters out "lazy" trends. A trend is only considered valid if the slope exceeds a specific steepness threshold.
Module 2: Correlation Trend Indicator (CTI)
Logic: Measures how closely the current price action correlates to a straight line (a perfect trend).
Function: Ensures that we are moving up with high statistical correlation, reducing fake-outs.
Module 3: Ehlers Roofing Filter
Logic: A spectral filter combining High-Pass (trend removal) and Super Smoother (noise removal).
Function: Isolates the "Roof" of price action to catch cyclical turning points before standard moving averages.
Module 4: Forecast Oscillator
Logic: Uses Linear Regression forecasting to predict where price "should" be relative to where it is.
Function: Signals when the regression trend flips. Offers "Aggressive" and "Conservative" calculation modes.
Module 5: Chandelier ATR Stop
Logic: A volatility-based trend follower that hangs a "leash" (ATR multiple) from extremes.
Function: Used as an entry filter. If price is above the Chandelier line, the trend is Bullish.
Module 6: Crypto Market Breadth (CMB)
Logic: Pulls data from multiple major tickers (BTC, ETH, and Perpetual Contracts).
Function: Calculates "Market Health." If Bitcoin is rising but the rest of the market is dumping, this module can veto a trade.
Module 7: Directional Index Convergence (DIC)
Logic: Analyzes the convergence/divergence between Fast and Slow Directional Movement indices.
Function: Identifies when trend strength is expanding.
Module 8: Market Thrust Indicator (MTI)
Logic: A volume-weighted breadth indicator using Advance/Decline and Volume data.
Function: One of the most powerful modules. Confirms that price movement is supported by actual volume flow. Recommended setting: "SSMA" (Super Smoother).
Module 9: Simple Ichimoku Cloud
Logic: Traditional Japanese trend analysis.
Function: Checks for a "Kumo Breakout." Price must be fully above/below the Cloud to confirm entry.
Module 10: Simple Harmonic Oscillator
Logic: Analyzes harmonic wave properties to detect cyclical tops and bottoms.
Function: Serves as a counter-trend or early-reversal detector.
Module 11: HSRS Compression / Super AO
Logic: Detects volatility compression (HSRS) or Momentum/Trend confluence (Super AO).
Function: Great for catching explosive moves resulting from consolidation.
Module 12: Fisher Transform (MTF)
Logic: Converts price data into a Gaussian normal distribution.
Function: Identifies extreme price deviations. Uses Multi-Timeframe (MTF) logic to ensure you aren't trading against the major trend.
5. Global Inhibitors (The Veto Power)
Even if 12 out of 12 modules vote "Buy," Gypsy Bot performs a final safety check using Global Inhibitors.
Bitcoin Halving Logic: Prevents trading during chaotic weeks surrounding Halving events (dates projected through 2040).
Miner Capitulation: Uses Hash Rate Ribbons to identify bearish regimes when miners are shutting down.
ADX Filter: Prevents trading in "Flat/Choppy" markets (Low ADX).
CryptoCap Trend: Checks the total Crypto Market Cap chart for broad market alignment.
6. Risk Management & The Dump Protection Team (DPT)
Even in this Indicator version, the RM logic runs to generate Exit Signals.
Dump Protection Team (DPT): Detects "Nuke" (Crash) or "Moon" (Pump) volatility signatures. If triggered, it plots an immediate Exit Signal (Yellow Plot).
Advanced Adaptive Trailing Stop (AATS): Dynamically tightens stops in low volatility ("Dungeon") and loosens them in high volatility ("Penthouse").
Staged Take Profits: Plots TP1, TP2, and TP3 events on the chart for visual confirmation or partial exit alerts.
7. Recommended Setup Guide
When applying Gypsy Bot to a new chart, follow this sequence:
Set Timeframe: 4 Hours (4H).
Tune DPT: Adjust "Dump/Moon Protection" inputs first. These filter out bad signals during high volatility.
Tune Module 8 (MTI): Experiment with the MA Type (SSMA is recommended).
Select Modules: Enable/Disable modules based on the asset's personality (Trending vs. Ranging).
Voting Threshold: Adjust ActivateOrders to filter out noise.
Alert Setup: Once visually satisfied, use the "Any Alert Function Call" option when creating an alert in TradingView to capture all Buy/Sell/Close events generated by the engine.
8. Technical Specs
Engine Version: Pine Script V6
Repainting: This indicator uses Closed Candle data for all Risk Management and Entry decisions. This ensures that signals do not vanish after the candle closes.
Visuals:
Blue Plot: Buy/Sell Signal.
Yellow Plot: Risk Management (RM) / DPT Close Signal.
Green/Lime/Olive Plots: Take Profit hits.
Disclaimer:
This script is a complex algorithmic tool for market analysis. Past performance is not indicative of future results. Cryptocurrency trading involves substantial risk of loss. Use this tool to assist your own decision-making, not to replace it.
9. About Signal Lynx
Automation for the Night-Shift Nation 🌙
Signal Lynx focuses on helping traders and developers bridge the gap between indicator logic and real-world automation. The same RM engine you see here powers multiple internal systems and templates, including other public scripts like the Super-AO Strategy with Advanced Risk Management.
We provide this code open source under the Mozilla Public License 2.0 (MPL-2.0) to:
Demonstrate how Adaptive Logic and structured Risk Management can outperform static, one-layer indicators
Give Pine Script users a battle-tested RM backbone they can reuse, remix, and extend
If you are looking to automate your TradingView strategies, route signals to exchanges, or simply want safer, smarter strategy structures, please keep Signal Lynx in your search.
License: Mozilla Public License 2.0 (Open Source).
If you make beneficial modifications, please consider releasing them back to the community so everyone can benefit.

Rapha Crypto - Bot1. Purpose of the Indicator
This indicator was designed to be used alongside the Rapha Crypto Bot. Its goal is to help identify market conditions where the bot performs best. The bot operates more efficiently on assets showing a minimum candle volatility of 0.5%, and this indicator measures exactly that.
2. How the Indicator Works
For each candle, the indicator calculates the full amplitude (including wicks) using:
Amplitude = (high - low)/low ×100
Based on this, it provides three key pieces of information:
Consistency: how many candles within the selected window reached at least the minimum required volatility (0.5%).
Average per Candle: the average amplitude of all candles in the window, helping you verify whether the asset has enough volatility to support bot operations.
Window Amplitude and Price Variation: additional context about how much the asset moved within the selected period.
All metrics are displayed in a dashboard format for quick and easy interpretation.
3. Analysis Window
By default, the indicator evaluates 20 candles. Within these 20 candles, it measures:
How many candles meet the minimum volatility threshold.
The average candle amplitude.
The overall price behavior during the window.
4. Recommended Time Frames
The recommended time frames for analysis are 15 minutes or 5 minutes.
Suggested workflow:
→ 15m or 5m: analyze whether the asset shows sufficient structural volatility.
→ 1m: execution time frame for the bot itself.
In other words, use the indicator as a pre-operational filter on 15m or 5m, then allow the bot to execute trades on the 1m chart when conditions are favorable.
5. Dashboard Interpretation
Asset: the current symbol.
Window: number of candles considered (default 20).
Minimum Variation: amplitude required per candle (default 0.5%).
Consistency: percentage of candles in the window that reached or exceeded the minimum volatility. Higher consistency indicates a better environment for the bot.
Average per Candle: the average amplitude across the window. This should preferably be above the minimum threshold.
Window Amplitude: total movement between the highest high and lowest low in the window.
Price Variation: percentage change between the first and last close in the window.
These metrics help determine whether an asset is volatile enough for the bot to operate efficiently.
6. Visual Highlighting
Values above the minimum volatility threshold are highlighted in green.
Values below are highlighted in red.
This makes it easier to identify favorable assets at a glance.
7. Practical Usage with the Rapha Crypto Bot
Before enabling the bot:
Open the asset on a 15m or 5m chart.
Check whether both Consistency and Average per Candle are above 0.5%.
If the asset meets these criteria, the bot can be used on the 1m chart with improved effectiveness.
8. Benefits of the Indicator
Prevents trading on assets with low or stagnant volatility.
Improves strategy accuracy by ensuring the environment is suitable before the bot starts working.
Offers a fast and clear volatility overview.
Acts as a valuable pre-trade filter to enhance bot performance.

3Commas DCA Bot Indicator v1.0Introduction
The indicator attempts to implement a majority all of the settings found on the 3Commas DCA Bot setting page that can be implemented within a TradingView indicator. Specifically, it will implement the "Open new trade ASAP" and "Trading View Custom Signal" deal start conditions. In this way, you can leverage the power of TradingView's backtester to model your settings and analysis past performance as well as leverage TradingView's alert notification subsystem to send Deal Start and Close signals to 3Commas using almost any of the thousands of scripts found in the Public Library (see "What does it do and how does it do it?" section below for more information on how to do this using the RSI indicator as an example).
How is it original and useful?
This indicator is unique in that it's the only one (as of the initial publications) that can handle 28 out of 32 bot settings (88% coverage) that are found on the 3Commas bot settings page. In addition, because it is a TradingView script, you will benefit from the following:
Model your bot's configuration using the backtester on any timeframe and evaluate its performance using the chart's history.
View a table of detailed statistics pertaining to deals started and completed, win/loss rates, daily P&L, true max drawdown, and detailed statistics on bars in deal along with safety orders filled.
View a table of "Used amount for each step" as presented in 3Commas as well.
Ability to link to almost any TradingView chart indicator that provides a single data point for buy/sell signals.
Make use of the 3Commas TA Start Conditions indicator to emulate the 3Commas built-in indicators for further performance evaluation with the backtester.
How does it compare to other scripts in the Public Library?
This indicator offers a very detailed, comprehensive settings and maybe the only one (as of the initial publication) that can handle 28 out of the 32 bot settings that are found on the 3Commas bot settings page (that can be handled within TradingView, because some cannot be modeled due to chart and language constraints). Specifically, the following 3Commas bot settings and inputs are addressed with asterisks denoting specific limitation due to TradingView's platform architecture and/or constraints:
Main settings
✅ Name
❌ Exchange* (Not handled since it is inherited from chart)
⚠ Bot type* (Only Single-pair because you simply apply the indicator to as many pairs you desire in separate charts to simulate a Multi-pair setting)
Pairs
❌ Pairs* (Not handled since it is inheriting the symbol from the chart)
Strategy
✅ Strategy
❌ Profit currency* (Not handled since there is no equivalence in TradingView)
✅ Base order size / unit
✅ Safety order size / unit
✅ Start order type
Deal start condition
⚠ TradingView* (You can modify the "Technical Rating" indicator by TradingView to output a signal yourself like @TheTradingParrot has done in the TV signal for DCA backtest script)
⚠ QFL* (See Quickfingers Luc's Base Breaking Strategy v2.5 - 3Commas Edition for an alternative)
❌ Manually/API* (Not handled since there is no equivalence in TradingView)
✅ Trading View custom signal
✅ Open new trade asap
Take profit
✅ Take profit (%)
✅ Take profit type
✅ Trailing
⚠ Trailing deviation* (modified to handle TradingView's broker emulator properly)
Stop loss
✅ Stop Loss (%)
✅ Stop Loss action
⚠ Stop Loss timeout* (modified to use "bars" as the unit of measure)
Safety orders
✅ Max safety trades count (a total of 100 safety orders are supported!)
⚠ Max active safety trades count* (Not handled since there is no equivalence in TradingView)
✅ Price deviation to open safety orders (% from initial order)
✅ Safety order volume scale
✅ Safety order step scale
Advanced settings
✅ Don't start deal(s) if the daily volume is less than
✅ Minimum price to open deal
✅ Maximum price to open deal
⚠ Deal start delay (QFL and standard TV signals only)* (modified to use "bars" as the unit of measure)
✅ Cooldown between deals
✅ Open deals & stop
Close deal after timeout
⚠ The time after which, deal will be closed automatically* (modified to use "bars" as the unit of measure)
In addition to the above inputs, the script will also support the same output data points that are found on the bot settings page, which are:
Assistant
✅ Balance
✅ Max amount for bot usage (Based on current rate)
✅ Max safety order price deviation
✅ % of available balance to be used by the bot
Table (Used amount for each step)
✅ Order No.
✅ Deviation %
✅ Order Size (Base currency)
✅ Order Volume (Quote currency)
✅ Price
✅ Average price
✅ Required price
✅ Required change
✅ Total Size (Base currency)
✅ Total Volume (Quote currency)
What does it do and how does it do it?
When applied to the chart for the first time, the default settings will work to execute the "Open new trade asap" deal start condition using a take profit of 4%, a base order size of 1.335% of equity (initial capital + net profit), a safety order size of 2.003% of equity (initial capital + net profit), a safety order volume scale of 1.5, a safety order step scale of 1.21, and a max safety trades count of 8. With these settings, as you scroll through the chart's history you should see price action crossing the DCA layers (denoted with blue triangles), and a green take-profit price line will render (with green triangle denoting the crossings). Lastly, in the upper-right corner of the chart the table of DCA statistics will render showing you all the gathered data that took place since the chart's starting history until the current time.
Using the "TV Custom Signal" section will allow you to "link" other chart indicators to supply "Start" and "Close" signals for the script. For example, here's how you can use the standard RSI indicator to generate an entry signal:
1) Add the stock RSI indicator and configure it to your desire.
2) Select the "RSI" indicator in the "Chart/Indicator Data Point" input.
3) Select "Chart/Indicator Data Point" in the "Start Deal When" input.
4) Select "Less Than" in the "Is" input.
5) Select "Custom Value(s)" in the "The Value Of" input.
6) Enter "25" in the "Custom Value 1 (Single or Lower Bound)" input.
7) Select "Trading View Custom Signal" in the "Open new trade" input (in the DEAL START CONDITION section).
8) Lastly, check the checkbox with a horizontal straight line above the "Start Deal When" input.
This means that the indicator will start a deal when the "RSI indicator" is "Less Than" the value of "25".
Strategy Results
The default settings are designed to ensure that the indicator will render chart elements when first loaded as well as to allow the backtester to gather order executions and display performance summary. The chart above is is using $10,000 initial capital, a commission rate of 0.1% for both entries and exits, and a 1 tick slippage setting. It is also using 3.22581% of the equity for the Base Order Size, 6.45161% of equity for the first Safety Order Size. The Maximum Safety Trade Count is 4 with a Safety Order Volume Scale of 2, a Safety Order Step Scale of 1.53, Price Deviation To Option Safety Orders at 5.3, and a take profit of 4.5% with Trailing turned on at a deviation of 1.5%. All other settings are defaults.
It is recommended that the indicator be "tuned" for your specific market in order to best implement the strategy and obtain better desirable results. You do so by using the backtester and statistics table and observe the output values and learn how the indicator is performing in the chart history. Using this information, you can adjust the settings accordingly until you find the settings acceptable to your trading goals and risk tolerance.
Always keep in mind that past performance may not be indicative of future results. Settings that seem favorable for one market may be found to be disastrous in another. Therefore, do take the time needed to understand how the settings will behave with the given chart symbol.
Enjoy! 😊👍
How to obtain access to the script?
You have two choices:
Use the "Website" link below to obtain access to this indicator, or
Send us a private message (PM) in TradingView itself.

Simple Grid Lines VisualizerAbout Grid Bots
A grid bot is a type of trading bot or algorithm that is designed to automatically execute trades within a predefined price range or grid. It is commonly used in markets that exhibit ranging or sideways movement, where prices tend to fluctuate within a specific range without a clear trend.
The grid bot strategy involves placing a series of buy and sell orders at regular intervals within the predefined price range or grid. The bot essentially creates a grid of orders, hence the name. When the price reaches one of these levels, the bot will execute the corresponding trade. For example, if the price reaches a predefined lower level, the bot will buy, and if it reaches a predefined upper level, it will sell.
The purpose of the grid bot strategy is to take advantage of the price oscillations within the range. As the price moves up and down, the bot aims to generate profits by buying at the lower end of the range and selling at the higher end. By repeatedly buying and selling at these predetermined levels, the bot attempts to capture gains from the price fluctuations.
About this Script
Simple Grid Lines Visualizer is designed to assist traders in visualizing and implementing automated price grids on their charts. With just a few inputs, this script generates gridlines based on your specified top price, bottom price, and the number of grids or profit per grid.
How it Works:
Specify Top and Bottom Prices: Start by setting the top and bottom prices that define the range within which the gridlines will be generated. These prices can be based on support and resistance levels, historical data, or any other factors you consider relevant to your analysis.
Determine Grid Parameters: Choose either the number of grids or profit per grid, depending on your preference and trading strategy. If you select the number of grids, the script will evenly distribute the gridlines within the specified price range. Alternatively, if you opt for profit per grid, the script will calculate the price increment required to achieve your desired profit level per grid.
Note that when choosing Profit per Grid , an approximation usually is performed, as all grid lines must be evenly distributed. To achieve that, the script computes the grid distance using the mean price between top and bottom, then computes how many of those complete distances may enter the entire range, and lastly, creates a grid with evenly distributed distances as close as possible to the previously computed.
Customize Styling and Display: Adjust the line color, line style, transparency, and other visual aspects to ensure clear visibility on your charts.
Analyze and Trade: Once the gridlines are plotted on your chart, carefully observe how the market interacts with them. The gridlines can act as reference points for potential support and resistance levels, as well as simple buy/sell orders for a trading bot.
Try to find gridlines that intersect prices as frequently as possible from one to another.
A grid with too many lines will make lots of potential trades, but the amount traded will be minimal (as the total amount invested is divided over the number of grids).
A grid with too few lines will make lots of profits with each trade, but the trades will be less likely to occur (depending on the top/bottom distance).
This tool aims to help visually which grid parameters seem to optimize this problem.
Future versions may include automatic profit computation.

Mike's Crossover BotGreetings! As a newcomer to coding, I've developed a simple trading bot for experimentation purposes. However, it's important to note that this bot has not undergone rigorous testing, so please exercise caution and use it at your own risk.
Bot Overview:
The bot operates by leveraging two technical indicators: Moving Average Convergence Divergence (MACD) with 7-day and 25-day parameters, and the Relative Strength Index (RSI). These indicators help identify potential buying and selling opportunities in the market.
MACD Crossovers:
The MACD is a trend-following momentum indicator that compares short-term and long-term moving averages. In our bot, we look for crossovers between the 7-day and 25-day MACD lines. A crossover occurs when these lines intersect, suggesting a potential change in market direction.
RSI Confirmation:
To refine our signals, we incorporate the Relative Strength Index (RSI). When a MACD crossover happens, the bot checks if the RSI is below 40. If it is, a buy signal is generated, indicating a potential undervalued condition. Conversely, when the RSI is above 60 during a crossover, a sell signal is triggered, suggesting a potentially overvalued condition.
Important Considerations:
New Coder Disclaimer: This bot is designed for educational purposes, especially for those who are new to coding. It serves as a learning tool and is not intended for live trading without proper testing.
Risk Awareness: Trading always involves risks, and the bot's performance has not been thoroughly tested in live market conditions. It's crucial to exercise caution and be aware of the inherent risks associated with financial markets.
Continuous Learning: Coding and algorithmic trading are dynamic fields. As you explore this bot, consider it a starting point for learning and continuously seek to enhance your understanding and skills in coding and trading strategies.
Remember, the success of any trading strategy depends on various factors, and past performance is not indicative of future results. Always conduct thorough testing before considering any automated strategy for live trading.

Algo BOT 3.0Algo BOT 3.0 is a sophisticated, rule-based intraday trading strategy designed for index option traders who seek high-probability entries based on market structure, institutional zones, and controlled risk management. This strategy intelligently identifies BUY and SELL trade opportunities using price action, Fibonacci retracements, and pivot confluences, layered with dynamic trade management through trailing stop loss (TSL) and predefined profit/loss thresholds.
🔍 Strategic Foundation
Algo BOT 3.0 combines multiple proven intraday trading concepts into a single unified system:
Candle Behavior Analysis:
Detects strong green (bullish) and red (bearish) candles based on configurable range filters, wick/body ratios, and volume-backed movement.
Ensures only impactful candles are considered for signal generation, filtering out noise.
Dynamic Candle Range Filtering:
Filters out low-momentum candles by comparing their range against a dynamically calculated threshold (based on recent 30-minute close).
Prevents premature or weak entries by focusing on high-volatility structures.
Fibonacci Entry Zones:
Automatically calculates 0.382 and 0.618 Fibonacci levels between the most recent key candles (highest green & lowest red).
These fib levels are used to define entry zones for BUY (above red fib 0.382) and SELL (below green fib 0.382).
Optional fib zones can be visually shown on the chart with real-time drawing.
📈 Signal Generation Logic
The core BUY/SELL signals are triggered based on a combination of:
Green/Red Candle Identification:
A green candle qualifies if:
Open is near the bottom 38.2% of its range.
Close is above the top 61.8% of the range.
High is above a pivot or institutional level.
A red candle qualifies if:
Open is near the top 38.2% of its range.
Close is below the bottom 61.8% of the range.
Low is below a pivot or institutional level.
Support/Resistance Touch Confirmation:
Signals are only considered valid if the qualifying candle touches:
CPR Top/Bottom
Daily Pivot Points (PP, R1–R4, S1–S4)
VWAP or MVWAP
CE Entry (BOT BUY):
Occurs when the price crosses above red fib 0.382 after red candle touch at support.
PE Entry (BOT SELL):
Occurs when the price crosses below green fib 0.382 after green candle touch at resistance.
Signal Controls:
Only one active signal per type (BUY/SELL) at a time.
Real-time tracking of active trade with condition-based resets.
🎯 Exit Management
Built-in risk and profit control with dynamic logic:
Trailing Stop Loss (TSL):
TSL is dynamically adjusted based on peak price after entry.
Trail distance is customizable via input (% below peak).
Visual alerts notify when TSL is hit.
Profit Target:
Trade exits automatically when desired % profit is achieved from entry.
Loss Limit:
Trade exits immediately if unrealized loss exceeds a set % threshold.
Helps prevent large drawdowns during volatile market moves.
🧠 Technical Indicator Integration
To enhance trade accuracy, the strategy includes several optional filters:
RSI: Momentum confirmation or divergence filtering.
SMA/EMA: Trend direction confirmation.
MVWAP: Modified VWAP for smoother institutional bias tracking.
🖼️ Visuals & Alerts
BOT BUY and BOT SELL Signal Labels appear directly on the chart with trade type and candle reference.
TSL, Target, and SL Exits shown as label markers with optional background highlight.
Live Alerts:
BOT BUY (CE Entry)
BOT SELL (PE Entry)
Trailing Stop Loss Triggered
Profit Target Hit
Stop Loss Triggered
⚙️ Customizable Settings
Users can fine-tune the strategy using the following input options:
MVWAP Length
RSI / SMA / EMA Lengths
Candle Range Sensitivity
TSL Distance (%)
Profit Target (%)
Loss Limit (%)
Enable/Disable Background Highlights & Labels
Display Fib Zones
⏱️ Best Use Case & Timeframes

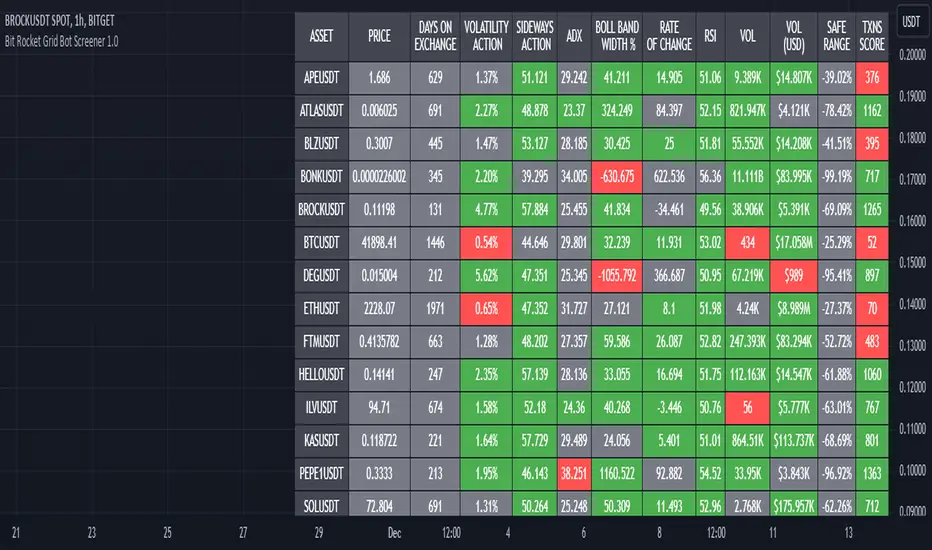
Bit Rocket Grid Bot Screener 1.0DESCRIPTION
A grid bot is an automated trading bot that is designed to execute buy and sell orders based on a pre-defined grid of prices. Grid bots operate within a specified price range, placing trades at set intervals above and below the current market price. The key idea behind a grid bot is to take advantage of price fluctuations and market volatility, not looking for trends or breakouts.
The optimal trading pair for a grid bot is one that exhibits frequent oscillations within a predictable range while demonstrating a slight upward trend. In simpler terms, it's a pair that consistently fluctuates within the same range.
The Grid Bot Screener serves as a valuable tool for identifying the most suitable trading pairs, by showing the indicators that matter the most for sideways Grid Bot trading. Most screeners look for trends, breakouts and use indicators that are used for assisting the trader with when to buy and sell. This indicator assists in the selection of pairs that are likely to yield the best results for high volatility sideways trading.
USAGE
This screener looks at volatility, sideways action, ADX, and other indicators that are most helpful when determining the amount and potential volatility, sideways action, and transactions for up to twenty pairs at a time.
Each indicator has a threshold that the user can set themselves, this way the user is in control when comparing or hunting for the optimal pairs.
User selects up to twenty pairs, sets thresholds if different than defaults, then sets length (how far back to look). Once this is set the user can quickly look and compare the results.
KEY INDICATORS
VOLATILITY ACTION - Percentage of Price Action Volatility; Temporal Volatility Trends; Elevated price action signifies accelerated price fluctuations, disregarding directional cues.
SIDEWAYS ACTION - The higher the value, the greater the horizontal movement; a robust trend, which is not our objective, provides no directional insight.
Values exceeding 45 indicate pronounced sideways activity, while lower values approaching zero signify a vigorous trend.
These values do not assist in determining the trend direction.
Higher values imply a more sideways orientation, whereas lower values indicate a more pronounced trend.
ADX - Does not indicate trend direction; instead measures trend strength.
An indicator for price range
Lower values signal a weak trend
Higher values denote a robust trend
Strategy: Look for values of 25 or lower which indicate a ranging or neutral trend.
TXNS SCORE – Transaction Activity.
TXNS indicator represents grid performance and serves as a direct measure of trading activity. TXNS accumulates the number of buy and sell actions, reflecting the user-defined grid percentage.
Elevated transaction numbers signify increased activity, leading to enhanced bot profitability.
NOTE: For an accurate representation of the actual number of transactions, use the Bit Rocket Transactions indicator on the 30min time frame.
CONFIRMATION INDICATORS
While the key indicators are generally reliable on their own, it's also valuable to assess how well the asset is performing and its historical trajectory. The confirmation indicators provide valuable insights into an asset's performance and direction, reinforcing the assessments made through the key indicators, again these indicators on their own are not enough they must be used in conjunction with the key indicators.
VOL - Trading Activity: For assets engaged in sideways trading, sufficient volume is necessary, but it doesn't need to be as high as you might expect.
VOL(USD) - USD-Based Activity: A high USD volume signifies strong market interest.
ROC - Rate of Change Percentage: This metric calculates the percentage change in price over a specified date range. Shows trend direction using price percentage.
• Avoid extremely high or extremely low values.
o Excessively high values may indicate overbought conditions with potential for a price correction.
o Very low values could imply waning interest and diminished asset value.
o Conversely, high values might indicate asset strength, while low values could suggest that the asset has reached a bottom and is unlikely to decrease further.
BOLLINGER BAND WIDTH PERCENT - Average MACD Percentage Width, percent is used with Bollinger bands to allow for comparison with other assets.
RSI - Buying and Selling Pressure Strength: When assessing RSI, look for a balance between buying and selling pressure while still maintaining high volatility and sideways strength. Key RSI levels to consider:
• 40-60: Neutral range, indicating equilibrium and stability.
• Above 70: Approaching overbought conditions.
• Below 30: Nearing oversold conditions.
These confirmation indicators provide valuable insights into an asset's performance and direction, reinforcing the assessments made through the key indicators.
ADDITIONAL INDICATORS
DAYS ON EXCHANGE – This metric reveals how long the crypto pair has been listed on the exchange. It serves multiple purposes, such as assessing the data's historical depth and indicating whether the crypto might be relatively new. Keep in mind that while the asset could exist for a while, it might not have been available on the exchange for an extended period.
PRICE – This merely states the current price, making it suitable for those focusing on price action, it is provided for informational value only.
SAFE RANGE – This percentage indicates the price movement range from the highest to the lowest within a specified data range. Use this to determine the upper and lower levels for setting up your grid range.
Oasis Trading Group Market Making Bot - Mean Reversion BandsThe OTG Market Making Bot was designed with mean reversion trading in mind. It uses advanced ATR and other volatility formulas to create a set of bands that price should stay within. If price is testing the upper or lower bands then it is "extended" and a mean reversion back to the midline is likely.
The indicator comes with two sets of reversion bands, by default they are set to two and three standard deviations away from the midline, these can be changed to your preference. The indicator will give you Buy and Sell arrows if the conditions are being met. The conditions can be as simple as price hitting the bands or with certain filters, the filters are as follows:
Volatility Filter: Based on your settings it will look at the Current ATR vs Historic ATR Average if the Current ATR is higher than the average it will not show the mean reversion Buy/Sell signals because the volatility is too high. This filter can be turned on and off in the settings.
Trend Filter: Based on your settings it will lookback a certain amount of candles to see if the current price action is ranging or trending. If the current price action is determined to be trending it will not show the mean reversion Buy/Sell signals because it wants to trade within a range. This filter cannot be turned off in the settings, but if you wish to see all the Mean Reversion Buy/Sell signals without any filters you can turn them on in the style settings.
Midline: The midline is color coded based on your Trend Lookback settings. If it determines that the market is ranging it will be colored Green, if it determines that the market is trending it will be colored Red. Green means you are safe to take Mean Reversion trades.
The indicator comes with multiple alerts for all the different Buy/Sell signals. These signals can come from the first set of bands, second set, or unfiltered.
This indicator is designed to be paired with the ATR Improved Indicator I have created which is open source, it can be found here.
Also, paired with the OTG Automated Trading Bot. The OTG Trading Bot is a trend following bot, it excels in trend trading but fails in range trading. This Mean Reversion bot was designed to compliment the OTG Bot perfectly.
The Oasis Trading Group Market Making Bot will be available as a free add-on to all OTG Trading Bot users.
If you have any questions feel free to let me know in the comments or DM me.

The Witcher [30MIN] - AlertsHello,
This is the Witcher Bot
This bot is got best performance at BTCUSDTPERP BINANCE FUTURES
this is bot for leverage 1x,
I tried focusing at highest % profitable trades, bot could be optimalised to even higher profit net.
TP: 1.1
SL: 8.2
Stop-loss unfortunelly have to be high to avoid bear/bull traps
The core of this strategy is trend strenght ( MONEY FLOW INDKES)
Strategy can only open position on strong price movment, to avoid wrong decision
Settings are set for highest profitable trades %
Bot using 10 indicators to trigger basic condtition for long and short :
1) ADX - Is one of the most powerful and accurate trend indicators. ADX measures how strong a trend is, and can give valuable information on whether there is a potential trading opportunity.
2) RSI - value helps strategy to stop trade in right time. When RSI is overbought strategy don't open new longs , also when RSI is oversold strategy don't open new shorts
3) TREND STRENGHT
4) JURIK MOVING AVERAGE - The Jurik Moving Average indicator is one of the surest ways to smoothen price curves within a minimum time lag. The indicator offers currency traders one of the best price filters during strong price moves. In this time, when bitcoin price action is so strong, this indicator is necessary.
5) SAR - The parabolic SAR is a technical indicator used to determine the price direction of an asset, as well as draw attention to when the price direction is changing. SAR supporting bot, to not open new trades when the trends are slowly changing
6) TREND INDICATOR
7) MOMENTUM - Indicator istechnical analysis tool used to determine the strength or weakness of a stock's price. Momentum measures the rate of the rise or fall of stock prices. Common momentum indicators include the relative strength index ( RSI ) and moving average convergence divergence ( MACD ).
8) OBV - On-balance volume (OBV) is a technical trading momentum indicator that uses volume flow to predict changes in stock price.
9) FAST MA - like previous ones this is for better view of trends, and correctly define the trends, also Speed_MA are using for predict the future price action.
10) RANGE FILTER - this indicator is for the better view of trends, define trends, that is important for every bull/bear traps which helps a lot becouse of the very variable trends.
I decided to add momentum indicator to strategy, to make a fast-reacting decision on lower timeframes at extremly price volatility
Also bot got additional EMA scalping option, which increase profit net but, in some situation, that could be risky.
For max security I recommend to turn off this option.
Commision are set at standard binancefutures VIP-0 = 0.04%
After converting strategy into study version, bot is ready for automation.
All the ploting color depends of adx value.
Strategy are not Repainting
For the source code I tried to keep as clean as I could
Enjoy

Quantbot Pro
Bot built on advanced algo 'under the hood' made very simple for traders to enter/exit trades.
Notice how the bot enters short in good time before the drop from 10.2 and stays in the position until a long signal is triggered. The bot is designed to capture trends as well as do reasonably well in ranging conditions, and is a very good compromise for traders unwilling/unable to re-train machine learning bots each time market conditions change.
Usage:
Wait for long/short indication by the bot (unconfirmed initially), take the trade once the bot indicates 'confirmed' on candle close.
Exit when opposite unconfirmed signal is flashing (or use in combination with Better SCMR for early exit indication). Notice that the bot will provide dynamic sup/res levels.
It's beneficial to combine the bot signals with Better SCMR, which makes it possible to enter on unconfirmed signals when SCMR gives confluence.
Recommended timeframe for scalping is 1h, while higher timeframe signals give confirmation of sustained trend and keeps the trader in trade.
Quantbot Pro in combination with Better SCMR is a very profitable way to trade, and requires less than a week of practice before going live with good probability of success.
Lifetime license: $900
Monthly trial license: $250
Contact by pm for payment instructions

[ADOL_]Trend Break Pro ARVIS BOTENG) Trend Break Pro Version : ARVIS BOT
It automatically draws trend lines and signals signals based on sophisticated standards.
It is an indicator that can be used as a tool for trading. from scalping
It was made as an all-round player that can even use the swing.
It contains all the signals of a breakout of the basic trend line,
By applying a new logic, signals that are faster than the breakout point of the basic trend line and
I made it to produce a better value while catching the signal of the press.
principle)
Basic trendline features:
It reflects the concepts of HH and LL.
Trendlines are created using the basic construction method, connecting highs and highs and lows and lows.
The 3 candles prior to the breakout of the trend line are the triggers to create a ready-to-prepare base signal.
What is HH? It is an abbreviation of Higher High, which means to raise the high.
What is LL? An abbreviation of Lower Low, which means to lower the low.
Features of the new core logic:
This is a quick way to find a reversal of a trend, taking into account candle patterns, volume, and moving averages.
The candle pattern that is reversed when the trading volume increases and then disappears is processed by subdividing and digitizing the pattern.
generate a signal. At the turning point of the trend, it triggers a long and short reversal signal.
For trading volume, obv was utilized. Overlaid elements allow you to find signals that are slightly faster than the trend line.
What is obv? OBV = An abbreviation of On Balance Volume. It is a secondary indicator showing the cumulative total of trading volume.
The background is a notation of the section where the trend is reversing.
option)
The degree of freedom to set options according to scalping, single stroke, swing, and bot implementation is given.
A volatility warning notification has been included. The function of TD setup is included.
You can set the range of candles as an option. The backtesting value is printed.
The backtesting value is calculated as the average of the opening and closing prices.
Volatility warnings are displayed in yellow.
TD Setup: Numbers floating on the candle, in ascending and descending order (=sequence) from 1 to 9.
The reason for writing up to 9 is based on statistics, and the more fundamental principle is the theory of the Fibonacci sequence.
The Fibonacci sequence is the number in the golden ratio that makes up nature, 1.1.2.3.5.8.13.21.34.55.89...
The sum of the nth and n+1th numbers becomes n+2th.
A note on odds of winning. Even if the win rate is 33%, if the profit-loss stop-loss ratio is 3 to 1, the profit exceeds 2, so cumulative profits are generated.
In other words, it is decided by considering both the win rate and profit/loss ratio, not just the win rate. The logic of a short stop loss and a long profit trend is reflected.
time frame)
Applicable to any timeframe.
Scalping: 1 minute, 3 minute, 5 minute / Danta: 15 minute, 1 hour / Swing: 4 hour, daily
Recommended time frame: 3, 15 minutes
alarm)
Various alert functions are available. based on the alert signal
When trading, various signals help to set specific conditions.
- Basic long and short alerts
- Volatility warning alert
- Filtered long and short alerts
- Long and short alerts occur Next peak alerts
- Uptrend line, downtrend line breakout alert
- Alerts about bot start and end when bot is running
- Filtered uptrend line, downtrend line breakout alert
- Alerts for rising and falling 1 setup and rising and falling 9 setups respectively
trading method)
1. For the trend line breakout signal, when the signal overlaps more than 3 times, the breakout probability increases.
It reflects the concept below.
One touch of support/resistance: The first touch sees longs at support and shorts at resistance.
2 touches of support/resistance line: Confirm the position once more in the stage of building support/resistance line (compacting). We see longs at support and shorts at resistance.
3 touches of the ground/resistance line: This is a section with a high possibility of both directions.
Support/resistance line 4 (over) touch: Used as a breakout reference line. When breaking through, short at support and long at resistance.
When the support/resistance line breaks through the closing price, support becomes resistance and resistance becomes support.
2. Trade support/resistance lines using the trend line breakout and signal as an important reference bar.
example)
3-1. Entry criteria/stop loss criteria (when trading hands and bots)
- entry criteria; Follow the signal.
- Stop loss criteria;
Use fixed stop loss: Set 1% fixed stop loss section from signal generation. (% is set individually)
Use Candle Stop Loss: Set a stop loss when the low or high point of the signal generating bar collapses.
Use flow stop loss: Set the stop loss considering the flow of the wave.
3-2. Entry criteria/stop loss criteria (in case of signal-based bot trading)
- Approach with a low magnification (more than 10 times is not recommended) to prevent the risk of liquidation of the largest drop,
There is an opposite signal after entering without setting stop loss separately.
4. Note
You are solely responsible for any trading decisions you make.
5. How to use
It is set to be available only to invited users. When invited,
Tap Add Indicator to Favorites at the bottom of the indicator.
If you click the indicator at the top of the chart screen and look at the left tab, there is a Favorites tab.
Add an indicator by clicking the indicator name in the Favorites tab.
KOR) Trend Break Pro버전 : ARVIS BOT ; 아비스 봇 입니다.
추세선을 자동으로 작도해주며, 정교화된 기준으로 시그널을
발생시켜 매매에 도구로써 활용가능한 지표입니다. 스캘핑부터
스윙까지 활용가능한 올라운드 플레이어로 만들어졌습니다.
기본 추세선 돌파의 시그널들을 모두 포함하고 있으며,
새로운 로직을 적용하여 기본 추세선 돌파시점보다 빠른 신호와
눌림의 신호까지 잡아내면서, 더 나은 값을 산출하도록 만들었습니다.
원리)
기본 추세선 기능 :
HH와 LL의 개념을 반영합니다.
추세선은 고점과 고점, 저점과 저점을 잇는 기본 작도 방법으로 만들어집니다.
추세선 돌파의 3개 이전 캔들부터 신호발생으로 준비를 기본 시그널을 만듭니다.
HH란 ? Higher High의 약자로 고점을 높인다는 의미입니다.
LL란? Lower Low의 약자로 저점을 낮춘다는 의미입니다.
새로운 핵심적인 로직의 기능 :
추세의 반전을 빠르게 찾기 위한 방법으로 캔들패턴, 거래량, 이평선을 고려하여 만들어졌습니다.
거래량이 증가하다가 소멸하는 시점에서 반전되는 캔들패턴을 세분화하고 수치화하여 가공된
신호를 발생시킵니다. 추세의 전환자리에서 롱과 숏의 전환 신호를 발생시키도록 합니다.
거래량에는 obv가 활용되었습니다. 중첩된 요소들을 통해 추세선보다 조금 더 빠른 신호를 찾을 수 있습니다.
obv란 ? OBV = On Blance Volume의 약자로 거래량의 누적합계를 나타내는 보조지표 입니다.
배경은 추세가 전환되는 구간의 표기입니다.
옵션)
스캘핑과 단타, 스윙, 봇의 구현에 맞게 옵션을 설정할 수 있는 자유도를 부여하였습니다.
변동성 경고 알림이 포함되었습니다. TD셋업의 기능이 포함되었습니다.
캔들의 범위를 옵션으로 설정할 수 있습니다. 백테스팅 값이 출력됩니다.
백테스팅 값은 시가와 종가의 평균값으로 산출됩니다.
변동성경고는 yellow 컬러로 표기됩니다.
TD셋업 : 캔들위에 플로팅 되는 숫자로 1~9까지의 오름차순, 내림차순 (=시퀀스)으로 구성됩니다.
9까지 쓰는 이유는 통계기반, 좀 더 근본적인 원리는 피보나치 수열의 이론이 반영되어 있습니다.
피보나치 수열이란 자연을 이루는 황금비율의 숫자로 1.1.2.3.5.8.13.21.34.55.89...
n번째와 n+1번째 숫자의 합이 n+2번째가 됩니다.
원리 예시)
승률에 관한 참고사항. 승률이 33퍼센트의 승률이어도 3대 1의 익절 손절 비율이면 이익이 2를 넘어가니까 누적수익이 발생합니다.
즉, 승률과 손익비를 모두 고려해서 결정하는 것이지, 승률만 봐서는 안됩니다.
손절은 짧게, 수익은 추세대로 길게의 로직이 반영되어 있습니다.
타임프레임)
모든 시간프레임에 적용 가능합니다.
스캘핑 : 1분봉, 3분봉, 5분봉 / 단타 : 15분봉, 1시간봉 / 스윙 : 4시간봉, 일봉
추천타임프레임 : 3, 15분봉
5분봉)
15분봉)
4시간봉)
알람)
다양한 얼러트 기능을 사용할 수 있습니다. 얼러트 신호를 기반으로
매매시 다양한 신호는 구체적 조건 설정에 도움이 됩니다.
- 기본 롱,숏 얼러트
- 변동성 경고 얼러트
- 필터링된 롱,숏 얼러트
- 롱,숏 얼러트 발생 다음봉 얼러트
- 상승추세선, 하락추세선 돌파 얼러트
- 봇구동시 봇의 시작과 종료에 관한 얼러트
- 필터링된 상승추세선, 하락추세선 돌파 얼러트
- 상승,하락1셋업과 상승,하락9셋업 각각에 대한 얼러트
매매방법)
1. 추세선 돌파신호는 신호가 3번이상 중첩될시 돌파확률이 상승합니다.
아래 개념을 반영합니다.
지지/저항선 1터치 : 첫번째 터치에는 지지선에서 롱을, 저항선에서 숏을 봅니다.
지지/저항선 2터치 : 지지/저항선 구축(다지기)의 단계로 한번 더 자리를 확인합니다. 지지선에서 롱을, 저항선에서 숏을 봅니다.
지/저항선의 3터치 : 양방향의 가능성이 높은 구간입니다.
지지/저항선4(이상)터치 : 돌파기준선으로 사용합니다. 돌파할 때, 지지선에서 숏을, 저항선에서 롱을 칩니다.
지지/저항선이 종가로 뚫리면 지지는 저항이 되고, 저항은 지지가 됩니다.
2. 추세선돌파와 시그널이 발생한 봉을 중요한 기준봉으로 활용하여 지지/저항선 매매를 합니다.
예시)
3-1. 진입기준/손절기준(손,봇 매매시)
- 진입기준; 시그널을 따릅니다.
- 손절기준;
고정손절가 이용 : 시그널 발생으로부터 1% 고정 손절가 구간을 설정합니다.(%는 개별로 설정)
캔들손절가 이용 : 시그널 발생봉의 저점이나 고점이 무너지면 손절을 설정합니다.
흐름손절가 이용 : 파동의 흐름을 고려하여 손절을 설정합니다.
3-2. 진입기준/손절기준(신호기반 봇 매매시)
- 저배율(10배이상은 권장하지 않습니다)로 접근해 최대낙폭의 청산위험을 예방하며,
손절가를 따로 설정하지 않고 진입후 반대신호가 뜰때마다 스위칭을 합니다.
4. 참고
귀하가 내리는 모든 거래 결정은 전적으로 귀하의 책임입니다.
5. 사용방법
초대된 사용자만 사용할 수 있도록 설정이 되어있습니다. 초대를 받을 경우,
지표 하단의 즐겨찾기에 인디케이터 넣기를 누릅니다.
차트화면 상단에 지표를 눌러서 왼쪽탭에 보면 즐겨찾기 탭이 있습니다.
즐겨찾기 탭에서 지표이름을 눌러서 지표를 추가합니다.
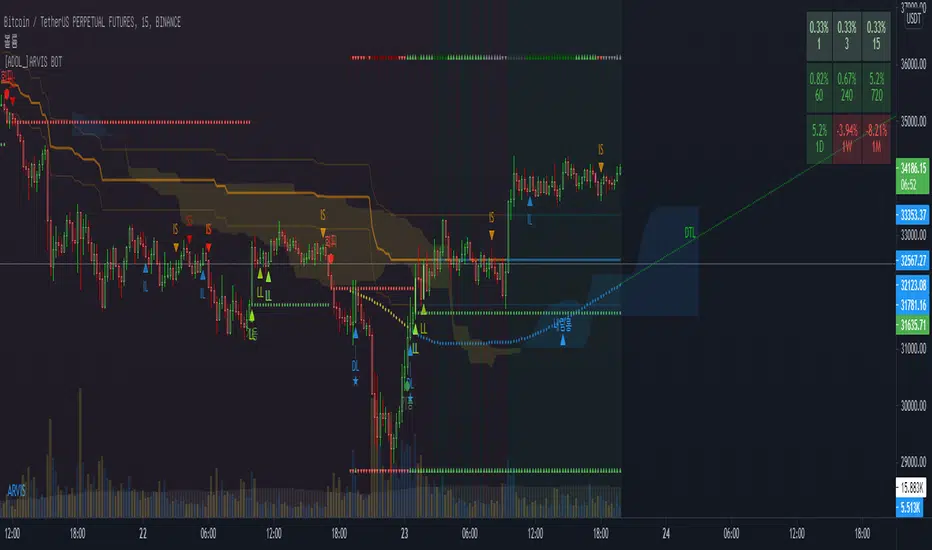
Argo II - (alerts for 3commas composite bots) - publicThis script lets users create BUY/SELL alerts for 3commas composite bots (1 alert = 12 pairs) in a simple way, based on a built in set of indicators that can be tweaked to work together or alone through the study settings.
There is a version of this script for single pair bots, with slightly more features here .
If the user choses to create both BUY and SELL signals from the study settings, the (1) alert created will send both BUY and SELL signals for all 12 pairs selected. At this stage, the script forces the user to select 12 pairs in the study settings. If less pairs are inserted, it will not work. Also, the script will only send alerts for the pairs selected in the study settings, not for the current chart (if different).
How to use:
- Add the script to the current chart
- Open the study settings , insert bot details and select 12 pairs. You should write the pairs manually, using the format BTC , ADA, ETH, etc. They MUST be in capital letters or 3commas will not recognize them.
- Still in the study settings, tweak the deal start/close conditions from various indicators until happy. The study will plot the entry / exit points below the current chart (1 = buy, 2 = sell)
- Make sure your strategy works for all the pairs you have selected, simply by checking each chart with the same study settings
- When happy, right click on the "..." next to the study name, then "Add alert'".
- Under "Condition", on the second line, chose "Any alert () function call". Add the webhook from 3commas, give it a name, and "create".
That's it.
Notes:
- If you insert coins that are not available for the quote currency and exchange of your choosing, the script will not work and return an error.
- Make sure you run tests with paper trading or dummy bots (i.e without actual bot ID) to ensure your alerts trigger as intended on all coins.
- If alerts trigger too much (i.e they all trigger at the same time for all coins), Trading View will stop the alert. So probably not ideal for a scalping bot. It could also be the sign the script doesn't work as intended.
- The script is a bit slow on my side. I am a beginner in pinescript, so if anyone knows how to simplify it, please let me know.
- if anyone knows how to tell the script to function with less than 12 pairs (when not filling the 12 fields in the setting), please also let me know :)
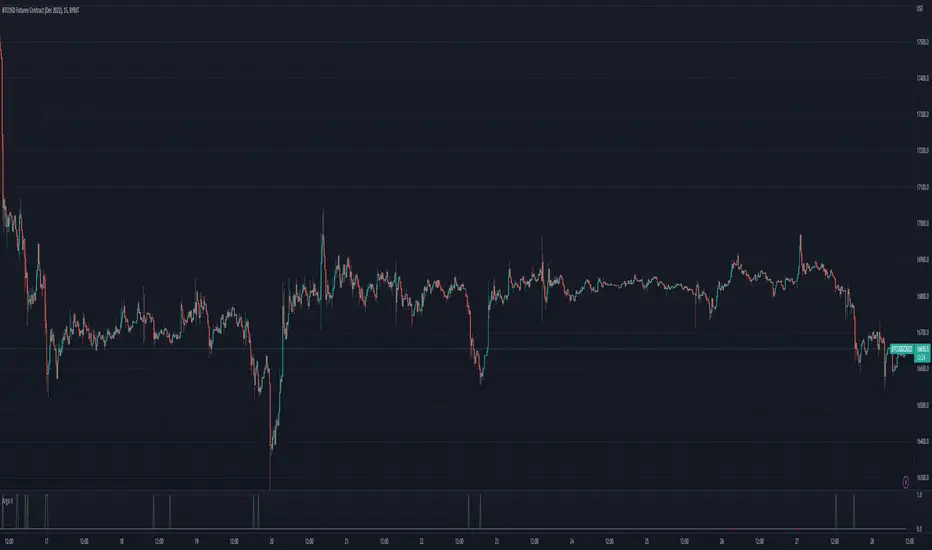
ATR Start & Stop BotThis script is using Average True Range (ATR) and works very well on the Bitcoin 4 hour timeframe to determine when to stop and start your bots.
It has a very similar visual to the EMA RSI Indicator found here:
This 'ATR Start & Stop Bot' is better because it has less confusion during sideways market movement.
As an example - You are using 3commas and have a Composite bot setup with several alt coins, you can use this indicator with the ' Stop bot ' alert to disable your composite bot from taking trades at times when the market is on a trend that looks in the red.
Alternatively you can use the ' Start bot ' alert to turn your bot back on during the green uptrends.
Using this indicator with these alerts on the Bitcoin 4-Hour chart add a great layer of automation to your already existing bots.
Credits:
Original 'ATR Stops' indicator belong to the user failathon and that script is found here:
Also credits to Dradian for the alert additions.
