Detect Sequential Trading - Bot DetectorDetect Sequential Trading - Bot Detector.
This tool requires access to volume data .
There are many trading bots out there, that trade 24/7 .
The detector can be used to understand how the bots are configured - to push the market up or down .
Alerts can be set to fire whenever a bot pattern is detected .
They must be configured to run Once per Bar .
It works well with range charts (1R) .
It would work best on 1 second charts or tick charts (currently, TradingView's alert system doesn't work with second charts).
The alternative would be 1 minute charts .
It can be used on higher timeframes but may be less effective.
Cari dalam skrip untuk "bot"

UT Bot Pro Max (Maks Edition)Script v2.0
UT Bot Pro Max is an advanced, high-precision evolution of the well-known UT Bot indicator.
This version is fully rebuilt into a complete decision-making system that evaluates trend structure, volatility conditions, momentum signals, and entry quality.
It is designed for traders who want clear, structured signals supported by objective filters and transparent reasoning.
1. Core Engine: ATR-Based Trailing Logic
At the heart of the system is an ATR dynamic trailing stop.
It is responsible for:
detecting trend reversals
identifying breakout conditions
switching between long and short bias
determining signal strength
Unlike simple ATR lines, this engine adapts to momentum expansion and contraction, forming the backbone for every signal.
2. Three-Tier Signal Structure
Each signal is classified into one of three levels based on the number of confirmations:
Strong Signals
ATR breakout
trend filter (price relative to EMA200)
RSI filter (oversold/overbought context)
This is the highest-quality confirmation and is suitable for full-size entries.
Medium Signals
ATR breakout
trend filter
(no RSI filter)
This represents a valid trend continuation but with slightly reduced confirmation.
Weak Signals
ATR breakout only
(no trend filter, no RSI filter)
This is an early-stage impulse which can evolve into a stronger move.
The multi-level classification allows the trader to size positions rationally and avoid over-committing during uncertain market conditions.
3. Move-Since-Entry Tracking
When a new long or short position is detected, the indicator records the entry price and automatically tracks the percentage movement from that point.
This offers:
real-time monitoring of open trade performance
objective context for managing exits
clear visualization of progress since entry
4. Smart State-Change Alerts
Instead of simple “BUY” or “SELL” messages, the script sends highly structured alerts whenever the internal state changes.
Each alert includes:
the symbol and timeframe
signal direction and strength
recommended position size based on signal tier
ATR values
RSI value and its state
trend context (bullish, bearish, neutral)
distance from ATR trailing stop
movement since entry
previous state reference (optional)
This makes it ideal for automated systems, algorithmic routing, or Telegram-based signal delivery.
5. Professional On-Chart Status Table
The indicator displays a refined information panel containing:
current signal state (Strong / Medium / Weak / Hold)
ATR signal direction
trend filter result
RSI value and condition
distance to trailing stop (percentage)
current position (long / short / flat)
entry recommendation based on signal strength
ATR value and additional context in expanded mode
There is also a compact mode optimized specifically for mobile trading.
6. Optional Heikin Ashi Mode
The indicator can operate using Heikin Ashi close values for traders who prefer smooth, noise-reduced visualizations.
The internal logic is recalculated automatically.
7. Trend-Colored Candles
An optional feature allows candle coloring based on price position relative to the ATR stop line, highlighting bullish and bearish phases directly on the chart.
What This Indicator Provides
Accurate, context-aware entry signals
Scalable position sizing through multi-tier structure
Objective trend confirmation
Breakout detection with volatility adaptation
Continuous tracking of open position performance
Detailed real-time explanations through alerts
A complete visual dashboard consolidating all key metrics
UT Bot Pro Max (Maks Edition) is built as a practical tool for daily trading.
It is suitable for scalping, day trading, swing trading, automated alerts, and mobile workflows.

DCA Bot v7 - Cryptosa Nostra 1.0Technical Overview: Adaptive RSI DCA Bot
This is a sophisticated DCA (Dollar Cost Averaging) indicator designed for accumulating assets and managing portfolio distribution. It does not trade on simple RSI crosses. Instead, it combines multi-zone RSI analysis with ATR-based volatility triggers to execute staggered, dynamically-sized trades.
Its core feature is a "learning" engine that adapts its own settings over time. This "brain" can be trained on historical data and then applied to your real-time portfolio holdings via a "Live Override" feature.
Core Logic: How It Works
A trade is only executed when two conditions are met simultaneously:
The RSI Condition: The RSI must be inside one of the four pre-defined zones.
The Price Condition: The price must cross a "trigger line" (the green or red line) that is dynamically calculated based on volatility.
1. The Four RSI Zones
This script uses four distinct zones to determine the intent to trade:
Deep Buy Zone (Default: RSI <= 35 & Downtrend): This is the primary "value" buy signal. It only activates if the RSI is deeply oversold and the price is below the 200-period Trend MA.
Reload Buy Zone (Default: RSI 40-50 & Uptrend): This is a "buy the dip" signal. It looks for minor pullbacks during an established uptrend (price above the 200-period Trend MA).
Profit-Taking Zone (Default: RSI 70-80): Triggers a standard, small sell when the market is overbought.
Euphoria Zone (Default: RSI >= 80): Triggers a larger, more aggressive sell during extreme "blow-off" tops.
2. Dynamic Trade Sizing
The amount to buy or sell is not fixed. It scales dynamically based on how high or low the RSI is:
Buy Sizing: Spends a higher percentage of available cash when RSI is at its lowest (e.g., 35) and a smaller percentage when it's at the top of the reload zone (e.g., 50).
Sell Sizing: Sells a smaller percentage of holdings when RSI just enters the overbought zone (e.g., 70) and a much larger percentage when it's in the euphoria zone (e.g., 80+).
3. The "Adaptive Brain" (ATR Multipliers)
This is the script's learning mechanism. The green/red trigger lines are calculated as: Last Trade Price +/- (ATR * Multiplier).
This "Multiplier" is the brain. It adapts based on trade performance.
After a successful trade (as defined by profit_target_multiplier), the bot gets more confident and reduces the multiplier. This places the next trigger line closer to the price, making it more aggressive.
After a losing trade (as defined by loss_limit_multiplier), the bot gets more cautious and increases the multiplier. This places the next trigger line further away, making it more patient.
How to Use This Indicator
This script is designed to be "trained" on historical data to provide relevant signals for today.
To Train the Brain: In the settings, go to "1. Backtest Settings". Set the "Start Date (For Learning)" to a date in the past (e.g., 6 months or 1 year ago). The script will run a simulation from that date, allowing its Adaptive Multipliers (the "brain") to adjust to the market's volatility.
To See Live Signals: In "2. Live Portfolio Override", check the box "Override Backtest Balance?" and enter your real current coin and USD holdings.
Result: The "Live Status" table (top-right) will now display signals from the trained brain but will calculate the "Potential Buy %" and "Potential Sell %" based on your real portfolio. The "Buy Multi" and "Sell Multi" fields show you the brain's current learned values.

Supertrend Hombrok BotSupertrend Hombrok Bot – Automated Trading Strategy for Dynamic Market Conditions
This trading strategy script has been developed to operate automatically based on detailed market conditions. It combines the popular Supertrend indicator, RSI (Relative Strength Index), Volume, and ATR (Average True Range) to determine the best entry and exit points while maintaining proper risk management.
Key Features:
Supertrend as the Base: Uses the Supertrend indicator to identify the market's trend direction, generating buy signals when the market is in an uptrend and sell signals when in a downtrend.
RSI Filter: The RSI is used to determine overbought and oversold conditions, helping to avoid entries in extreme market conditions. Entries are avoided when RSI > 70 (overbought) and RSI < 30 (oversold), reducing the risk of false movements.
Volume Filter: The strategy checks if the trading volume is above the average multiplied by a user-defined factor. This ensures that only significant movements, with higher liquidity, are considered.
Candle Body Size: The strategy filters only candles with a body large enough relative to the ATR (Average True Range), ensuring that the price movements on the chart have sufficient strength.
Risk Management: The bot is configured to operate with an adjustable Risk/Reward Ratio (R:R). This means that for each trade, both Take Profit (TP) and Stop Loss (SL) are adjusted based on the market's volatility as measured by the ATR.
Automatic Entries and Exits: The script automatically executes entries based on the specified conditions and exits with predefined Stop Loss and Take Profit levels, ensuring risk is controlled for each trade.
How It Works:
Buy Condition: Triggered when the market is in an uptrend (Supertrend), the volume is above the adjusted average, the candle body is strong enough, and the RSI is below the overbought level.
Sell Condition: Triggered when the market is in a downtrend (Supertrend), the volume is above the adjusted average, the candle body is strong enough, and the RSI is above the oversold level.
Alerts:
Buy and Sell Alerts are configured with detailed information, including Stop Loss and Take Profit values, allowing the user to receive notifications when trading conditions are met.
Capital Management:
The capital per trade can be adjusted based on account size and risk profile.
Important Note:
Always test before trading with real capital: While the strategy has been designed based on solid technical analysis methods, always perform tests in real-time market conditions with demo accounts before applying the bot in live trading.
Disclaimer: This script is a tool to assist in the trading process and does not guarantee profit. Past performance is not indicative of future results, and the trader is always responsible for their investment decisions.

Reversal Trading Bot Strategy[BullByte]Overview :
The indicator Reversal Trading Bot Strategy is crafted to capture potential market reversal points by combining momentum, volatility, and trend alignment filters. It uses a blend of technical indicators to identify both bullish and bearish reversal setups, ensuring that multiple market conditions are met before entering a trade.
Core Components :
Technical Indicators Used :
RSI (Relative Strength Index) :
Purpose : Detects divergence conditions by comparing recent lows/highs in price with the RSI.
Parameter : Length of 8.
Bollinger Bands (BB) :
Purpose : Measures volatility and identifies price levels that are statistically extreme.
Parameter : Length of 20 and a 2-standard deviation multiplier.
ADX (Average Directional Index) & DMI (Directional Movement Index) :
Purpose : Quantifies the strength of the trend. The ADX threshold is set at 20, and additional filters check for the alignment of the directional indicators (DI+ and DI–).
ATR (Average True Range) :
Purpose : Provides a volatility measure used to set stop levels and determine risk through trailing stops.
Volume SMA (Simple Moving Average of Volume ):
Purpose : Helps confirm strength by comparing the current volume against a 20-period average, with an optional filter to ensure volume is at least twice the SMA.
User-Defined Toggle Filters :
Volume Filter : Confirms that the volume is above average (or twice the SMA) before taking trades.
ADX Trend Alignment Filter : Checks that the ADX’s directional indicators support the trade direction.
BB Close Confirmation : Optionally refines the entry by requiring price to be beyond the upper or lower Bollinger Band rather than just above or below.
RSI Divergence Exit : Allows the script to close positions if RSI divergence is detected.
BB Mean Reversion Exit : Closes positions if the price reverts to the Bollinger Bands’ middle line.
Risk/Reward Filter : Ensures that the potential reward is at least twice the risk by comparing the distance to the Bollinger Band with the ATR.
Candle Movement Filter : Optional filter to require a minimum percentage move in the candle to confirm momentum.
ADX Trend Exit : Closes positions if the ADX falls below the threshold and the directional indicators reverse.
Entry Conditions :
Bullish Entry :
RSI Divergence : Checks if the current close is lower than a previous low while the RSI is above the previous low, suggesting bullish divergence.
Bollinger Confirmation : Requires that the price is above the lower (or upper if confirmation is toggled) Bollinger Band.
Volume & Trend Filters : Combines volume condition, ADX strength, and an optional candle momentum condition.
Risk/Reward Check : Validates that the trade meets a favorable risk-to-reward ratio.
Bearish Entry :
Uses a mirror logic of the bullish entry by checking for bearish divergence, ensuring the price is below the appropriate Bollinger level, and confirming volume, trend strength, candle pattern, and risk/reward criteria.
Trade Execution and Exit Strateg y:
Trade Execution :
Upon meeting the entry conditions, the strategy initiates a long or short position.
Stop Loss & Trailing Stops :
A stop-loss is dynamically set using the ATR value, and trailing stops are implemented as a percentage of the close price.
Exit Conditions :
Additional exit filters can trigger early closures based on RSI divergence, mean reversion (via the middle Bollinger Band), or a weakening trend as signaled by ADX falling below its threshold.
This multi-layered exit strategy is designed to lock in gains or minimize losses if the market begins to reverse unexpectedly.
How the Strategy Works in Different Market Conditions :
Trending Markets :
The ADX filter ensures that trades are only taken when the trend is strong. When the market is trending, the directional movement indicators help confirm the momentum, making the reversal signal more reliable.
Ranging Markets :
In choppy markets, the Bollinger Bands expand and contract, while the RSI divergence can highlight potential turning points. The optional filters can be adjusted to avoid false signals in low-volume or low-volatility conditions.
Volatility Management :
With ATR-based stop-losses and a risk/reward filter, the strategy adapts to current market volatility, ensuring that risk is managed consistently.
Recommendation on using this Strategy with a Trading Bot :
This strategy is well-suited for high-frequency trading (HFT) due to its ability to quickly identify reversal setups and execute trades dynamically with automated stop-loss and trailing exits. By integrating this script with a TradingView webhook-based bot or an API-driven execution system, traders can automate trade entries and exits in real-time, reducing manual execution delays and capitalizing on fast market movements.
Disclaimer :
This script is provided for educational and informational purposes only. It is not intended as investment advice. Trading involves significant risk, and you should always conduct your own research and analysis before making any trading decisions. The author is not responsible for any losses incurred while using this script.

Iron Bot Statistical Trend Filter📌 Iron Bot Statistical Trend Filter
📌 Overview
Iron Bot Statistical Trend Filter is an advanced trend filtering strategy that combines statistical methods with technical analysis.
By leveraging Z-score and Fibonacci levels, this strategy quantitatively analyzes market trends to provide high-precision entry signals.
Additionally, it includes an optional EMA filter to enhance trend reliability.
Risk management is reinforced with Stop Loss (SL) and four Take Profit (TP) levels, ensuring a balanced approach to risk and reward.
📌 Key Features
🔹 1. Statistical Trend Filtering with Z-Score
This strategy calculates the Z-score to measure how much the price deviates from its historical mean.
Positive Z-score: Indicates a statistically high price, suggesting a strong uptrend.
Negative Z-score: Indicates a statistically low price, signaling a potential downtrend.
Z-score near zero: Suggests a ranging market with no strong trend.
By using the Z-score as a filter, market noise is reduced, leading to more reliable entry signals.
🔹 2. Fibonacci Levels for Trend Reversal Detection
The strategy integrates Fibonacci retracement levels to identify potential reversal points in the market.
High Trend Level (Fibo 23.6%): When the price surpasses this level, an uptrend is likely.
Low Trend Level (Fibo 78.6%): When the price falls below this level, a downtrend is expected.
Trend Line (Fibo 50%): Acts as a midpoint, helping to assess market balance.
This allows traders to visually confirm trend strength and turning points, improving entry accuracy.
🔹 3. EMA Filter for Trend Confirmation (Optional)
The strategy includes an optional 200 EMA (Exponential Moving Average) filter for trend validation.
Price above 200 EMA: Indicates a bullish trend (long entries preferred).
Price below 200 EMA: Indicates a bearish trend (short entries preferred).
Enabling this filter reduces false signals and improves trend-following accuracy.
🔹 4. Multi-Level Take Profit (TP) and Stop Loss (SL) Management
To ensure effective risk management, the strategy includes four Take Profit levels and a Stop Loss:
Stop Loss (SL): Automatically closes trades when the price moves against the position by a certain percentage.
TP1 (+0.75%): First profit-taking level.
TP2 (+1.1%): A higher probability profit target.
TP3 (+1.5%): Aiming for a stronger trend move.
TP4 (+2.0%): Maximum profit target.
This system secures profits at different stages and optimizes risk-reward balance.
🔹 5. Automated Long & Short Trading Logic
The strategy is built using Pine Script®’s strategy.entry() and strategy.exit(), allowing fully automated trading.
Long Entry:
Price is above the trend line & high trend level.
Z-score is positive (indicating an uptrend).
(Optional) Price is also above the EMA for stronger confirmation.
Short Entry:
Price is below the trend line & low trend level.
Z-score is negative (indicating a downtrend).
(Optional) Price is also below the EMA for stronger confirmation.
This logic helps filter out unnecessary trades and focus only on high-probability entries.
📌 Trading Parameters
This strategy is designed for flexible capital management and risk control.
💰 Account Size: $5000
📉 Commissions and Slippage: Assumes 94 pips commission per trade and 1 pip slippage.
⚖️ Risk per Trade: Adjustable, with a default setting of 1% of equity.
These parameters help preserve capital while optimizing the risk-reward balance.
📌 Visual Aids for Clarity
To enhance usability, the strategy includes clear visual elements for easy market analysis.
✅ Trend Line (Blue): Indicates market midpoint and helps with entry decisions.
✅ Fibonacci Levels (Yellow): Highlights high and low trend levels.
✅ EMA Line (Green, Optional): Confirms long-term trend direction.
✅ Entry Signals (Green for Long, Red for Short): Clearly marked buy and sell signals.
These features allow traders to quickly interpret market conditions, even without advanced technical analysis skills.
📌 Originality & Enhancements
This strategy is developed based on the IronXtreme and BigBeluga indicators,
combining a unique Z-score statistical method with Fibonacci trend analysis.
Compared to conventional trend-following strategies, it leverages statistical techniques
to provide higher-precision entry signals, reducing false trades and improving overall reliability.
📌 Summary
Iron Bot Statistical Trend Filter is a statistically-driven trend strategy that utilizes Z-score and Fibonacci levels.
High-precision trend analysis
Enhanced accuracy with an optional EMA filter
Optimized risk management with multiple TP & SL levels
Visually intuitive chart design
Fully customizable parameters & leverage support
This strategy reduces false signals and helps traders ride the trend with confidence.
Try it out and take your trading to the next level! 🚀

RSI Box Strategy (pseudo- Grid Bot)This is a strategy intended primarily for algorithmic traders. It's a pseudo-grid bot that uses a dynamic, volume-weighted grid that only updates when the RSI meets certain conditions. It's also a breakout strategy, whereas normal grid bots are not (typical grid bots sell when a higher grid is reached, whereas this strategy sells when a lower grid is breached under specific conditions). This strategy also sells 100% of pyramiding orders on close.
In a nutshell, the strategy updates its grid to the volume-weighted highest/lowest values of your given source ("src" in the settings) each time that there is a RSI crossunder/crossover. From this range it produces an evenly-spaced grid of five lines, and uses the current source to determine which grid line is closest to the source. Then, if the source crosses over the line directly above the current line, it enters a buy order. If the source crosses under the line directly below the current line, it enters a sell order.
You can configure shorts, source, RSI length, and overbought/oversold levels in the settings.
For the strategy results below: fees are at 0.1% per trade, with order size 1% of equity and a max pyramiding value of 33. For a greater R/R profile, you can increase the order size, which will increase drawdown but potentially yield better results.

Mizar_LibraryThe "Mizar_Library" is a powerful tool designed for Pine Script™ programmer’s, providing a collection of general functions that facilitate the usage of Mizar’s DCA (Dollar-Cost-Averaging) bot system.
To begin using the Mizar Library, you first need to import it into your indicator script. Insert the following line below your indicator initiation line: import Mizar_Trading/Mizar_Library/1 as mizar (mizar is the chosen alias).
In the import statement, Mizar_Trading.Mizar_Library_v1 refers to the specific version of the Mizar Library you wish to use. Feel free to modify mizar to your preferred alias name.
Once the library is imported, you can leverage its functions by prefixing them with mizar. . This will prompt auto-completion suggestions displaying all the available user-defined functions provided by the Mizar Library.
Now, let's delve into some of the key functions available in the Mizar Library:
DCA_bot_msg(_cmd)
The DCA_bot_msg function accepts an user-defined type (UDT) _cmd as a parameter and returns a string with the complete JSON command for a Mizar DCA bot.
Parameters:
_cmd (bot_params) : ::: User-defined type (UDT) that holds all the necessary information for the bot command.
Returns: A string with the complete JSON command for a Mizar DCA bot.
rounding_to_ticks(value, ticks, rounding_type)
The rounding_to_ticks function rounds a calculated price to the nearest actual price based on the specified tick size.
Parameters:
value (float) : ::: The calculated price as float type, to be rounded to the nearest real price.
ticks (float) : ::: The smallest possible price obtained through a request in your script.
rounding_type (int) : ::: The rounding type for the price: 0 = closest real price, 1 = closest real price above, 2 = closest real price below.
Returns: A float value representing the rounded price to the next tick.
bot_params
Bot_params is an user-defined type (UDT) that represents the parameters required for a Mizar DCA bot.
Fields:
bot_id (series string) : The ID number of your Mizar DCA bot.
api_key (series string) : Your private API key from your Mizar account (keep it confidential!).
action (series string) : The command to perform: "open" (standard) or "close" optional .
tp_perc (series string) : The take profit percentage in decimal form (1% = "0.01") optional .
base_asset (series string) : The cryptocurrency you want to buy (e.g., "BTC").
quote_asset (series string) : The coin or fiat currency used for payment (e.g., "USDT" is standard if not specified) optional .
direction (series string) : The direction of the position: "long" or "short" (only applicable for two-way hedge bots) optional .
To obtain the JSON command string for the alert_function call, you can use the DCA_bot_msg function provided by the library. Simply pass the cmd_msg UDT as an argument and assign the returned string value to a variable.
Here's an example to illustrate the process:
// Import of the Mizar Library to use the included functions
import/Mizar_Trading/Mizar_Library/1 as mizar
// Example to set a variable called “cmd_msg” and all of its parameters
cmd_msg = mizar.bot_params. new()
cmd_msg.action := "open"
cmd_msg.api_key := "top secret"
cmd_msg.bot_id := "9999"
cmd_msg.base_asset := "BTC"
cmd_msg.quote_asset := "USDT"
cmd_msg.direction := "long"
cmd_msg.tp_perc := "0.015"
// Calling the Mizar conversion function named “DCA_bot_msg()” with the cmd_msg as argument to receive the JSON command and save it in a string variable called “alert_msg”
alert_msg = mizar.DCA_bot_msg(cmd_msg)
Feel free to utilize (series) string variables instead of constant strings. By incorporating the Mizar Library into your Pine Script, you gain access to a powerful set of functions and can leverage them according to your specific requirements.
For additional help or support, you can join the Mizar Discord channel. There, you'll find a dedicated Pine Script channel where you can ask any questions related to Pine Script.
Customizable Non-Repainting HTF MACD MFI Scalper Bot Strategy v2Customizable Non-Repainting HTF MACD MFI Scalper Bot Strategy v2
This script was originally shared by Wunderbit as a free open source script for the community to work with. This is my second published iteration of this idea.
WHAT THIS SCRIPT DOES:
It is intended for use on an algorithmic bot trading platform but can be used for scalping and manual trading.
This strategy is based on the trend-following momentum indicator . It includes the Money Flow index as an additional point for entry.
This is a new and improved version geared for lower timeframes (15-5 minutes), but can be run on larger ones as well. I am testing it live as my high frequency trader.
HOW IT DOES IT:
It uses a combination of MACD and MFI indicators to create entry signals. Parameters for each indicator have been surfaced for user configurability.
Take profits are now trailing profits, and the stop loss is now fixed. Why? I found that the trailing stop loss with ATR in the previous version yields very good results for back tests but becomes very difficult to deploy live due to transaction fees. As you can see the average trade is a higher profit percentage than the previous version.
HOW IS MY VERSION ORIGINAL:
Now instead of using ATR stop loss, we have a fixed stop loss - counter intuitively to what some may believe this performs better in live trading scenarios since it gives the strategy room to move. I noticed that the ATR trailing stop was stopping out too fast and was eating away balance due to transaction fees.
The take profit on the other hand is now a trailing profit with a customizable deviation. This ensures that you can have a minimum profit you want to take in order to exit.
I have depracated the old ATR trailing stop as it became too confusing to have those as different options. I kept the old version for others that want to experiment with it. The source code still requires some cleanup, but its fully functional.
I added in a way to show RSI values and ATR values with a checkbox so that you can use the new an improved ATR Filter (and grab the right RSI values for the RSI filter). This will help to filter out times of very low volatility where we are unlikely to find a profitable trade. Use the "Show Data" checkbox to see what the values are on the indicator pane, then use those values to gauge what you want to filter out.
Both versions
Delayed Signals : The script has been refactored to use a time frame drop down. The higher time frame can be run on a faster chart (recommended on one minute chart for fastest signal confirmation and relay to algotrading platform.)
Repainting Issues : All indicators have been recoded to use the security function that checks to see if the current calculation is in realtime, if it is, then it uses the previous bar for calculation. If you are still experiencing repainting issues based on intended (or non intended use), please provide a report with screenshot and explanation so I can try to address.
Filtering : I have added to additional filters an ABOVE EMA Filter and a BELOW RSI Filter (both can be turned on and off)
Customizable Long and Close Messages : This allows someone to use the script for algorithmic trading without having to alter code. It also means you can use one indicator for all of your different alterts required for your bots.
HOW TO USE IT:
It is intended to be used in the 5-30 minute time frames, but you might be able to get a good configuration for higher time frames. I welcome feedback from other users on what they have found.
Find a pair with high volatility (example KUCOIN:ETH3LUSDT ) - I have found it works particularly well with 3L and 3S tokens for crypto. although it the limitation is that confrigurations I have found to work typically have low R/R ratio, but very high win rate and profit factor.
Ideally set one minute chart for bots, but you can use other charts for manual trading. The signal will be delayed by one bar but I have found configurations that still test well.
Select a time frame in configuration for your indicator calculations.
Select the strategy config for time frame (resolution). I like to use 5 and 15 minutes for scalping scenarios, but I am interested in hearing back from other community memebers.
Optimize your indicator without filters : customize your settings for MACD and MFI that are profitable with your chart and selected time frame calculation. Try different Take Profits (try about 2-5%) and stop loss (try about 5-8%). See if your back test is profitable and continue to optimize.
Use the Trend, RSI, ATR Filter to further refine your signals for entry. You will get less entries but you can increase your win ratio.
You can use the open and close messages for a platform integration, but I choose to set mine up on the destination platform and let the platform close it. With certain platforms you cannot be sure what your entry point actually was compared to Trading View due to slippage and timing, so I let the platform decide when it is actually profitable.
Limitations: this works rather well for short term, and does some good forward testing but back testing large data sets is a problem when switching from very small time frame to large time frame. For instance, finding a configuration that works on a one minute chart but then changing to a 1 hour chart means you lose some of your intra bar calclulations. There are some new features in pine script which might be able to address, this, but I have not had a chance to work on that issue.

BTCUSDTPERP MEGABOT 60min [ALERTS VERSION]BINANCE:BTCUSDTPERP
Hello, this is my alerts version of BTCUSDTPERP MEGABOT 60min
THIS BOT IS ONLY FOR BTCUSDTPERP ON BINANCEFUTURES !!!!!!!!!!!!!!!!!!!!!!!!!!!!!!!!!!!!!!!!!
This configs are only for this pair on this market,
It depends of volume , and others indicator
Bot is making amazing results at configs
TP - 4.5%
SL - 7%
Strategy using 4 indicators :
ADX
RSI
VOLUME
MACD
ADX - makes a solid view to trend without any scam wick :
Long only on green bars
Shorts only on red bars
That's helps my strategy to define a right trend
there is also a orange option for unidentified trends
RSI - value helps strategy to stop trade in right time
When RSI is overbought strategy don't open new longs
also when RSI is oversold strategy don't open new shorts
Volume - volume is the most important indicator for the strategy,
to avoid open trades on flat chart, new trades are open after a strong volume
wicks
MACD - this indicator is for define the trend
So the way this bot is working is simple
when every arguments are confirmed , then strategy open trades
Enjoy !!!

Scalping Trading System bot Crypto and StocksThis is a trend trading strategy scalping bot that can work with any type of market. However I concluded my tests so far with Crypto, Stocks and Forex, and with optimizations always could be found some profitable settings.
Indicators
SImple Moving Average
Exponential Moving Average
Keltner Channels
MACD Histogram
Stochastics
Rules for entry
long= Close of the candle bigger than both moving averages and close of the candle is between the top and bot levels from Keltner. At the same time the macd histogram is negative and stochastic is below 50.
short= Close of the candle smaller than both moving averages and close of the candle is between the top and bot levels from Keltner. At the same time the macd histogram is positive and stochastic is above 50.
Rules for exit
We exit when we meet an opposite reverse order.
This strategy has no risk management inside, so use it with caution !

7-RSI strategyHello, I've only been trying to learn PineScript for two months on my own, here I am posting a version of the strategy for a grid bot with 20 orders, order size 5%, earlier I tried to find something similar, but could not. Perhaps others, those who, like me, are just starting to learn PineScript, will find something useful. In the process of using grid bots, I noticed that the RSI indicator is sufficient, so the strategy uses 7 RSI indicators on different timeframes, but it is not necessary to use all 7, usually 3 is enough, therefore, by default, the RSI values are set to limit so that there is no effect on the settings of others. The step between bot orders is set in the settings. The code can of course be simplified, but it's better for understanding, I think.

Stochastic TrendDear community,
I've made another simple trading bot for you to use. This bot is based on the Stochastic Oscillator. It only produces long trades currently.
I changed the oscillation period to a much longer one, which in turn creates opportunities to trade long term trends.
The bot goes long when the Entry lines is crossed from below and it will close its long position once the Exit line has been crossed from above.

RSI Mean Reversion Bot StrategyI started developing this strategy as a way to plug in and test values before defining them in the bots on 3Commas, Coinrule, and Quadency. None of those bots performed the same way my script did and I kept working on it until the strategy finally yielded the same simulated results when paired with the Tradingview bot on Quadency. I looked at all the different RSI strategies already published and saw what each was missing and changed it in mine to make it better:
1. Backtest an actual timeframe by date and time
2. Define the RSI price source
3. Fully manipulate the RSI length
4. Define a stop loss that works
5. Pick Long or Short, or both, based on market conditions. Or compare side by side to decide which you want.

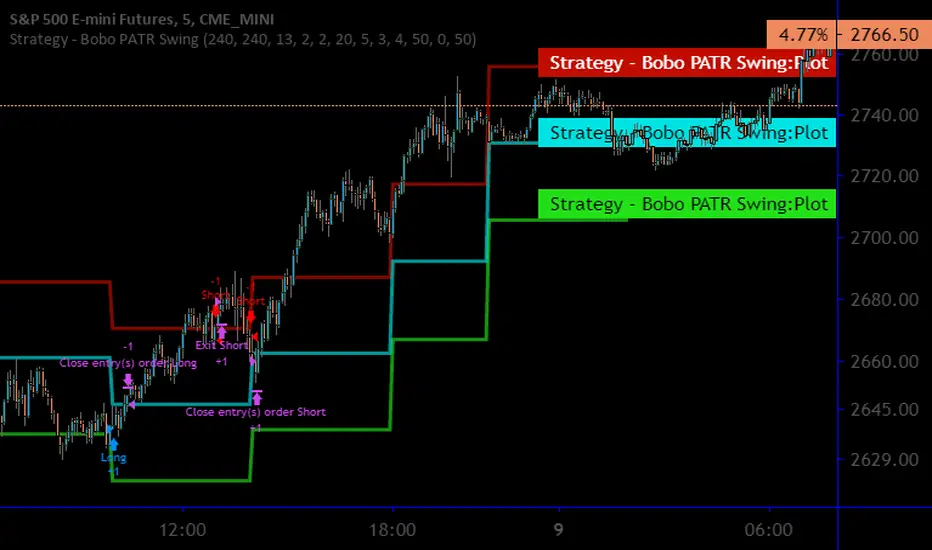
Strategy - Bobo Intraday Swing Bot with filtersThis is an adapted version of my swing bot with additional filters that mean it works quite well on lower timeframes like 1min, 5 mins as long as you adjust the setting accordingly (reduce pivot timescale, band width)
Entry conditions are filtered by an invisible trend calculation running in the background so the bot doesn't repeatedly try and fail to fade a strong trend. It has just about everything you should need for basic use, stop losses and targets, automatically close trade at pivot.
I get good results on rangey instruments like major indices such as SPX / ES that kind of thing. Make sure you understand the minmum tick value of an index so the stop setting on the bot work properly
Hope it's useful!
UT Bot AlertsUT Bot indicator was initially developer by @Yo_adriiiiaan
The idea of original code belongs @HPotter
These are v4 alerts for my previously published strategy:
Original script:

UT Bot Alerts [2026 Elite Edition]🚀 Overview
The UT Bot 2026 Elite Edition is the ultimate evolution of the legendary volatility trading system originally conceptualized by QuantNomad. While the original tool revolutionized trend following, this "Elite Edition" introduces Asymmetric Sensitivity—a professional feature that acknowledges a fundamental market truth: Assets do not fall the same way they rise.
This script allows you to decouple your Long and Short strategies, offering surgical precision for both bull runs and bear crashes, all while monitoring trade health via a new real-time Safety Dashboard.
🧠 The Logic: Why "Elite"?
Most trailing stop systems use a single setting (e.g., Key: 2, ATR: 10) for both buying and selling. This is efficient but often suboptimal.
Bull Markets often grind up slowly (requiring looser stops to avoid shakeouts).
Bear Markets often crash quickly (requiring tighter, faster stops to protect capital).
The Dual-Engine Solution: This script runs two separate calculation engines simultaneously:
The Buy Engine (Ceiling): Calculates the resistance ceiling using its own Sensitivity (Key) and Smoothness (ATR) settings.
The Sell Engine (Floor): Calculates the support floor using entirely different settings.
This means you can have a "Slow & Steady" settings for buying Bitcoin, but a "Fast & Aggressive" setting for shorting it, all within the same indicator.
✨ Key Features
1. Asymmetric "Dual-Key" Sensitivity
Buy Key & ATR: Tune your entry sensitivity for long positions.
Sell Key & ATR: Tune your short parameters independently.
Why this matters: You can now set a wide stop for trending up, but a tight stop for trending down to capture profit instantly when momentum breaks.
2. The Safety Dashboard (HUD) A professional Heads-Up Display (HUD) located in the top-right corner. It provides critical "Flight Data" that simple buy/sell labels hide:
Status: Instantly see if you are net Long or Short.
Stop Price (The Kill Level): The exact price where the trend will flip. Use this for your hard Stop Loss orders.
Active ATR: Displays the current volatility width. High ATR = High Volatility (Wide Stops). Low ATR = Consolidation (Tight Stops).
3. Heikin Ashi Smoothing
Includes a built-in toggle to calculate signals based on Heikin Ashi candles while viewing standard candles. This filters out "noise" and wicks, often keeping you in a trend longer.
4. Pine Script v6 Optimization
Refactored for the latest Pine Script v6 standards, ensuring faster execution and compatibility with the latest TradingView features.
🛠️ How to Use (Best Practices)
For Scalping (1m - 5m Timeframes):
Suggestion: Set Sell Key lower (e.g., 1.5) and Sell ATR lower (e.g., 5) to react quickly to drops. Keep Buy Key higher to avoid choppy fake-outs. I personally use the default settings on the 3M time frame with Gold and NQ with a high rate of success.
For Swing Trading (4h - Daily):
Suggestion: Increase Buy ATR (e.g., 30-100) to smooth out the noise of daily fluctuations.
The Dashboard:
Always check the Stop Price on the dashboard before entering. If the Stop Price is too far away from the current price, your risk might be too high for the trade size.
🙏 Credits & Appreciation
This script stands on the shoulders of giants.
Original Logic: Huge props and credit to QuantNomad for the original UT Bot strategy. His work laid the foundation for volatility-based trailing stops on TradingView.
Concept: Based on the "Ceiling/Floor" volatility theory.
Development: Enhanced and refactored by for the 2026 market environment.
Disclaimer: This tool is for information purposes only. Past performance does not guarantee future results.

4 EMA + VWAP + UT Bot + SuperTrend + Daily Pivot Checklist📌 Description
This indicator is a multi-indicator trend confirmation checklist designed to simplify decision-making by combining several widely used technical tools into one clean on-chart dashboard.
The goal of this script is clarity, not complexity — helping traders quickly see market bias, trend strength, and trade direction without switching between multiple indicators.
🔹 Indicators Included
EMA 10 / 20 / 50 / 200
VWAP
UT Bot (ATR-based trailing stop with BUY / SELL signals)
SuperTrend (correct trend color logic)
Daily Pivot Point (today only)
All conditions are displayed in a YES / NO + BUY / SELL checklist panel for fast confirmation.
🔹 How to Use
Follow UT Bot BUY / SELL as the primary direction
Use EMA 200 & SuperTrend for overall trend bias
VWAP and Daily Pivot act as intraday filters
Stronger setups occur when most checklist conditions align
This indicator works best when combined with proper risk management and price action.
👥 Credits / Author Note
This script was conceptualized, tested, and refined by the publisher based on real trading use cases.
The development, logic structuring, and UI optimization were done collaboratively with AI-assisted scripting support to ensure clean code, clarity, and non-repainting behavior.
Final responsibility for trading decisions always remains with the user.
⚠️ Disclaimer
This indicator is provided for educational and informational purposes only.
It does not guarantee profits and should not be considered financial advice.
Always trade responsibly.

CODY BOT – Breakout SignalsCODY BOT is a minimalist, high-probability breakout indicator designed to keep your chart clean while highlighting actionable trading opportunities.
Unlike traditional indicators that generate too many signals, CODY BOT only alerts you to strong directional moves following consolidation, helping you focus on high-quality entries.
Key Features:
Detects breakouts above recent highs and below recent lows.
Filters weak moves using minimum candle body size.
Includes a cooldown period to prevent signal spam.
Clean and intuitive visual signals with large arrows for easy interpretation.
Optional customization for consolidation lookback bars, minimum candle size, and arrow visibility.
Alerts built-in for server-side and mobile notifications.
How to Use:
Look for BUY arrows when price breaks above consolidation highs.
Look for SELL arrows when price breaks below consolidation lows.
Combine with your preferred risk management and trend confirmation strategies.

SA_EMA Combo + UT BotEMA Combo + UT Bot is an indicator designed to make it easier to track trend direction and momentum reversals on the same chart.
The indicator combines multiple EMA lines (50/100/150/200) with a short- and medium-term EMA cloud. This cloud visually shows whether the market is in a bullish or bearish trend through color changes.
In addition, it uses the UT Bot algorithm to generate buy and sell signals adapted to market volatility. These signals are triggered when the price crosses the ATR-based trailing stop level.
Users can choose to use Heikin Ashi candles and adjust signal sensitivity via the Key Value parameter. This allows traders to follow overall trends and potential reversal zones using a single tool.
Disclaimer: This indicator is for technical analysis purposes only and should not be considered financial advice.
Developed for Future Alpha Club.
AMOGH smc bo/bd - Delta Bot IntegrationAMOGH SMC BO/BD – Delta Bot Integration ek advanced Pine Script indicator hai jo CHoCH ke baad breakout/breakdown (BO/BD) entries detect karta hai. Ye structure flip, SL, aur smart alerts ke sath auto-trading bots ke liye optimized hai. Entry precision aur exit logic strategy-grade hai.

HF Crypto Scalping BotHigh-Frequency Crypto Scalping Bot for ETHUSDT
This bot is designed for scalping ETHUSDT on a 1-minute chart using a blend of technical indicators and market structure logic.
🔍 Strategy Highlights:
Range Mode: Uses RSI and MFI to identify overbought/oversold zones near support/resistance.
Trend Mode: Detects MACD momentum combined with confirmed S/R breakouts.
Smart Risk Management: Dynamic stop loss and take profit based on risk:reward ratio.
Adaptive Market Logic: Automatically switches between trend and range conditions.
Real-Time Table: Displays RSI, MFI, MACD trend, market mode, entry/exit prices, and stop/target levels.
Visual Cues: Buy/Sell/Exit signals plotted directly on the chart with color-coded levels.
Alerts: Integrated long/short entry and exit alerts with live price and indicator values.
Customize the input parameters to fit your risk profile and asset volatility. Ideal for fast-paced scalping with dynamic conditions.

UT Bot + Cooldown + Visual FVGSynopsis – UT Bot + Cooldown + Visual FVG
This TradingView script combines:
✅ UT Bot Reversal Signals
Based on ATR and volatility logic
BUY when trend flips from bearish to bullish
SELL when trend flips from bullish to bearish
✅ Cooldown Filter
Limits signals to 1 per X bars (default 30)
Prevents overtrading during choppy price action
✅ Optional FVG Markers (Fair Value Gaps)
Visually shows bullish or bearish imbalances (3-bar gaps)
Does not affect signal generation — only for confluence
🔍 Ideal for traders who want clean, time-filtered signals with visual price-action context. Suitable for futures, crypto, or forex on intraday charts.
