Squeeze & Breakout Confirmation StrategyThis strategy focuses on identifying periods of low volatility (Bollinger Band Squeeze) and then confirming the direction of the subsequent breakout with momentum, volume, and candle strength.
Concepts Applied: Bollinger Bands (Squeeze), RSI (Momentum), Market Volume (Conviction), Candle Size (Strength)
Buy Signal:
Bollinger Band Squeeze: Look for a period where the Bollinger Bands contract significantly, indicating low volatility and consolidation. The bands should be very close to the price action.
RSI Breakout: After the squeeze, wait for the price to break decisively above the upper Bollinger Band. Simultaneously, the RSI should break above 60 (or even 70), indicating strong bullish momentum.
Volume Surge: The breakout candle should be accompanied by a significant increase in trading volume, ideally above its recent average, confirming strong buying interest.
Strong Bullish Candle: The breakout candle itself should be a large, bullish candle (e.g., a strong green candle with a small upper wick or a bullish engulfing pattern), demonstrating buyer conviction.
Sell Signal (Short):
Bollinger Band Squeeze: Look for a period where the Bollinger Bands contract significantly.
RSI Breakdown: After the squeeze, wait for the price to break decisively below the lower Bollinger Band. Simultaneously, the RSI should break below 40 (or even 30), indicating strong bearish momentum.
Volume Surge: The breakdown candle should be accompanied by a significant increase in trading volume, ideally above its recent average, confirming strong selling interest.
Strong Bearish Candle: The breakdown candle itself should be a large, bearish candle (e.g., a strong red candle with a small lower wick or a bearish engulfing pattern), demonstrating seller conviction.
Cari dalam skrip untuk "break"

Smart FlexRange Breakout [The_lurker]The Smart FlexRange Breakout tool aims to identify trading opportunities based on price breakouts of dynamic levels (CALL, PUT) with a dotted centerline and the ability to select the applicable market. The tool relies on candlestick analysis over a specific time period (such as 3 hours). Candle data (searchHours) is collected to identify the most significant candle based on candlestick patterns and trading volume during the selected timeframe. Breakout levels and take-profit (TP) targets are then plotted, along with buy and sell signals, breakout notifications, and up/down trend lines based on Pivot Points.
The tool is run according to the selected timeframe.
Practical Use
1- Setup: Adjust the market, timeframe, number of hours, and time zone to suit the trader's needs.
2- Trading: Monitor signals (BUY/SELL) and TP levels to determine entry and exit points.
3- Trend Lines: Use them to understand the overall trend and confirm signals.
---
1. Objective: Identify trading opportunities based on price breakouts
- Trading opportunities: The indicator is designed to help traders identify moments when significant price movements are likely, allowing them to enter buy or sell trades based on market changes.
- Price breakouts: The indicator focuses on moments when prices break through key levels (resistance or support). A breakout occurs when the price exceeds a resistance level (up) or breaks a support level (down), indicating a potential continuation of the movement in the same direction.
- Dynamic: Resistance and support levels are not static; rather, they are calculated based on candlestick analysis over a specific period of time, making them adaptive to current market conditions.
---
2. Dynamic levels (resistance and support levels)
- Resistance levels: These represent prices that the price is difficult to break above, defined here as the high of the most significant candle during the specified period.
- Support levels: These represent prices below which the price is difficult to fall, defined as the low of the most significant candle.
- Dynamic: These levels are recalculated every new search period (searchHours), meaning they change based on the latest market data, unlike traditional static levels.
---
3. Adding a Dotted Center Line
- Center Line: A horizontal dotted line is drawn at the midpoint between the high and low of the most significant candle.
- Purpose:
- Provides a visual reference point for determining the current price position relative to support and resistance levels.
- Helps assess whether the price is moving toward a breakout (near resistance) or a breakout (near support).
- Dotted: The dotted pattern distinguishes it from the solid upper and lower lines, making it easier to distinguish visually.
---
4. Relying on candlestick analysis over a specific time period (searchHours)
- Candlestick Analysis: The indicator examines candlesticks to determine which ones have the most influence on price movement.
- Timeframe (searchHours):
- The user specifies the number of hours (1-6) for candle analysis, which determines the range of data the indicator relies on.
- Example: If searchHours = 3 and timeframe = 30 minutes, 6 candles are analyzed (3 hours ÷ 30 minutes).
- Flexibility: This period can be adjusted to suit different markets (such as volatile cryptocurrencies or more stable Forex).
---
5. Determining the Most Important Candle Based on Candle Patterns and Volume
- The most important candle: is the candle believed to have the greatest impact on price movement based on specific criteria.
- Candle Patterns:
- Candles are analyzed using a candlestick pattern library (such as Engulfing, Hammer, Doji).
- Reversal patterns (such as Morning Star, Shooting Star) are given a high importance score (100 points) because they indicate potential trend changes.
- Trading Volume:
- The trading volume of each candle is measured and compared to the maximum and minimum during the period.
- Volume is calculated as a percentage (0-100) and added to the pattern score to determine the most significant candle.
- Result: The candle with the highest score (patterns + volume) is used to determine support and resistance levels.
---
6. Timeframe
- Time interval: The user selects a time frame for the candles (15, 30, or 60 minutes).
- Importance:
- Determines the number of candles analyzed during the searchHours period.
- Affects the accuracy and speed of the signals (shorter timeframe = faster but less reliable signals; longer timeframe = slower but more reliable signals).
- Example: If the timeframe is 60 minutes and searchHours is 3, only 3 candles are analyzed.
---
7. Drawing Breakout Levels and Take Profit Targets (TP)
- Breakout Levels:
- Upper line (resistance): Drawn at the highest price of the most significant candle and is labeled "CALL".
- Lower line (support): Drawn at the lowest price of the most important candle and is called "PUT."
- These lines represent levels where a breakout is expected to lead to a strong price movement.
- Take Profit Targets (TP):
- Up to 8 bullish (above the upper line) and bearish (below the lower line) TP levels are calculated.
- They are calculated based on a percentage (tpPercentage) added or subtracted from the base lines.
- Example: If tpPercentage = 0.6% and the high price = 100, then bullish TP1 = 100.6, TP2 = 101.2, etc.
- Labels: Labels are drawn for each TP level indicating the value and level (TP1, TP2, etc.).
---
8. Buy and Sell Signals
- Buy (BUY) signal:
- Generated when the price breaks the upper line (ta.crossover).
- The "BUY" label is drawn with the redrawing of the TP levels.
- Sell signal (SELL):
- Generated when the price breaks the lower line (ta.crossunder).
- The "SELL" label is drawn with the redrawing of the TP levels.
- Purpose: To provide clear signals to the trader for making trade entry decisions.
=========================================================================
Thank you, n00btraders.
For using the import library: n00btraders/Timezone/1
For using the import library: The_lurker/AllCandlestickPatternsLibrary/1
========================================================================
Disclaimer:
The information and publications are not intended to be, nor do they constitute, financial, investment, trading, or other types of advice or recommendations provided or endorsed by TradingView.
تهدف أداة Smart FlexRange Breakout إلى تحديد فرص التداول بناءً على اختراقات الأسعار للمستويات الديناميكية (CALL، PUT) مع خط مركزي منقط، مع إمكانية اختيار السوق المناسب. تعتمد الأداة على تحليل الشموع اليابانية على مدى فترة زمنية محددة (مثل 3 ساعات). تُجمع بيانات الشموع (searchHours) لتحديد أهم شمعة بناءً على أنماط الشموع وحجم التداول خلال الإطار الزمني المحدد. ثم تُرسم مستويات الاختراق وأهداف جني الأرباح (TP)، بالإضافة إلى إشارات البيع والشراء، وإشعارات الاختراق، وخطوط الاتجاه الصعودي/الهبوطي بناءً على نقاط المحور.
يتم تشغيل الاداه حسب الفاصل المختار timeframe
الاستخدام العملي
1- الإعداد: اضبط السوق، والإطار الزمني، وعدد الساعات، والمنطقة الزمنية لتناسب احتياجات المتداول.
2- التداول: راقب إشارات (الشراء/البيع) ومستويات جني الأرباح لتحديد نقاط الدخول والخروج.
3- خطوط الاتجاه: استخدمها لفهم الاتجاه العام وتأكيد الإشارات.
1. الهدف: تحديد فرص التداول بناءً على اختراقات الأسعار
- فرص التداول: صُمم هذا المؤشر لمساعدة المتداولين على تحديد اللحظات التي يُحتمل فيها حدوث تحركات سعرية كبيرة، مما يسمح لهم بالدخول في صفقات شراء أو بيع بناءً على تغيرات السوق.
- اختراقات الأسعار: يُركز المؤشر على اللحظات التي تخترق فيها الأسعار مستويات رئيسية (مقاومة أو دعم). يحدث الاختراق عندما يتجاوز السعر مستوى مقاومة (صعودًا) أو يخترق مستوى دعم (هبوطًا)، مما يُشير إلى احتمال استمرار الحركة في نفس الاتجاه.
- ديناميكي: مستويات المقاومة والدعم ليست ثابتة؛ بل تُحسب بناءً على تحليل الشموع اليابانية على مدى فترة زمنية محددة، مما يجعلها مُكيفة مع ظروف السوق الحالية.
2. المستويات الديناميكية (مستويات المقاومة والدعم)
- مستويات المقاومة: تُمثل هذه الأسعار التي يصعب على السعر تجاوزها، وتُعرف هنا بأنها ارتفاع الشمعة الأكثر أهمية خلال الفترة المحددة.
- مستويات الدعم: تُمثل هذه الأسعار التي يصعب على السعر الانخفاض دونها، وتُعرف بأنها أدنى مستوى للشمعة الأكثر أهمية.
- ديناميكي: تُعاد حساب هذه المستويات مع كل فترة بحث جديدة (ساعات البحث)، مما يعني أنها تتغير بناءً على أحدث بيانات السوق، على عكس المستويات الثابتة التقليدية.
3. إضافة خط مركزي منقط
- خط المركز: يُرسم خط أفقي منقط عند نقطة المنتصف بين أعلى وأدنى شمعة ذات أهمية.
- الغرض:
- يوفر نقطة مرجعية بصرية لتحديد وضع السعر الحالي بالنسبة لمستويات الدعم والمقاومة.
- يساعد في تقييم ما إذا كان السعر يتحرك نحو اختراق (بالقرب من المقاومة) أو اختراق (بالقرب من الدعم).
- منقط: يُميزه النمط المنقط عن الخطوط العلوية والسفلية المتصلة، مما يُسهّل تمييزه بصريًا.
4. الاعتماد على تحليل الشموع اليابانية على مدى فترة زمنية محددة (ساعات البحث)
- تحليل الشموع اليابانية: يفحص المؤشر الشموع اليابانية لتحديد أيها الأكثر تأثيرًا على حركة السعر.
- الإطار الزمني (ساعات البحث):
- يُحدد المستخدم عدد الساعات (من 1 إلى 6) لتحليل الشموع، والذي يُحدد نطاق البيانات التي يعتمد عليها المؤشر.
- مثال: إذا كانت ساعات البحث = 3 والإطار الزمني = 30 دقيقة، فسيتم تحليل 6 شموع (3 ساعات ÷ 30 دقيقة).
- المرونة: يُمكن تعديل هذه الفترة لتناسب الأسواق المختلفة (مثل العملات المشفرة المتقلبة أو سوق الفوركس الأكثر استقرارًا).
5. تحديد الشمعة الأكثر أهمية بناءً على أنماط الشموع وحجم التداول
- الشمعة الأكثر أهمية: هي الشمعة التي يُعتقد أن لها التأثير الأكبر على حركة السعر بناءً على معايير محددة.
- أنماط الشموع:
- يتم تحليل الشموع باستخدام مكتبة أنماط الشموع (مثل شمعة الابتلاع، وشمعة المطرقة، وشمعة الدوجي).
- تُمنح أنماط الانعكاس (مثل نجمة الصباح، ونجم الشهاب) درجة أهمية عالية (100 نقطة) لأنها تُشير إلى تغيرات محتملة في الاتجاه.
- حجم التداول:
- يُقاس حجم تداول كل شمعة ويُقارن بالحد الأقصى والأدنى خلال الفترة.
- يُحسب الحجم كنسبة مئوية (0-100) ويُضاف إلى درجة النمط لتحديد الشمعة الأكثر أهمية.
- النتيجة: تُستخدم الشمعة ذات أعلى درجة (الأنماط + الحجم) لتحديد مستويات الدعم والمقاومة.
٦. الإطار الزمني
- الفاصل الزمني: يختار المستخدم إطارًا زمنيًا للشموع (١٥، ٣٠، أو ٦٠ دقيقة).
- الأهمية:
- يحدد عدد الشموع المُحللة خلال فترة ساعات البحث.
- يؤثر على دقة وسرعة الإشارات (الإطار الزمني الأقصر = إشارات أسرع ولكن أقل موثوقية؛ الإطار الزمني الأطول = إشارات أبطأ ولكن أكثر موثوقية).
- مثال: إذا كان الإطار الزمني ٦٠ دقيقة وساعات البحث ٣، فسيتم تحليل ٣ شموع فقط.
---
٧. رسم مستويات الاختراق وأهداف جني الأرباح (TP)
- مستويات الاختراق:
- الخط العلوي (المقاومة): يُرسم عند أعلى سعر للشمعة الأكثر أهمية ويُسمى "CALL".
- الخط السفلي (الدعم): يُرسم عند أدنى سعر للشمعة الأكثر أهمية ويُسمى "PUT".
- تمثل هذه الخطوط المستويات التي يُتوقع أن يؤدي فيها الاختراق إلى حركة سعرية قوية.
- أهداف جني الأرباح (TP):
- يتم حساب ما يصل إلى 8 مستويات جني أرباح صعودية (فوق الخط العلوي) وهبوطية (تحت الخط السفلي).
- يتم حسابها بناءً على نسبة مئوية (tpPercentage) تُضاف أو تُطرح من خطوط الأساس.
- مثال: إذا كانت نسبة جني الأرباح = 0.6% وكان أعلى سعر = 100، فإن هدف الربح الصعودي الأول = 100.6، وهدف الربح الثاني = 101.2، وهكذا.
- العلامات: تُرسم علامات لكل مستوى جني أرباح تشير إلى القيمة والمستوى (TP1، TP2، وهكذا).
---
8. إشارات الشراء والبيع
- إشارة الشراء (BUY):
- تُولّد عند اختراق السعر للخط العلوي (ta.crossover).
- تُرسم علامة "الشراء" مع إعادة رسم مستويات جني الأرباح.
- إشارة البيع (SELL):
- تُولّد عند اختراق السعر للخط السفلي (ta.crossunder). - يُرسم مؤشر "بيع" مع إعادة رسم مستويات جني الأرباح.
- الغرض: توفير إشارات واضحة للمتداول لاتخاذ قرارات دخول الصفقة.
==========================================================================
شكرًا لكم، أيها المتداولون الجدد.
لاستخدام مكتبة الاستيراد: n00btraders/Timezone/1
لاستخدام مكتبة الاستيراد: The_lurker/AllCandlestickPatternsLibrary/1
==============================================================================
إخلاء مسؤولية:
لا يُقصد بهذه المعلومات والمنشورات أن تكون، ولا تُشكل، نصائح أو توصيات مالية أو استثمارية أو تجارية أو أي نوع آخر من النصائح أو التوصيات المُقدمة من TradingView أو المُعتمدة منها.

RSI Strength & Consolidation Zones (Zeiierman)█ Overview
RSI Strength & Consolidation Zones (Zeiierman) is a hybrid momentum and volatility visualization tool that blends enhanced RSI interpretation with ADX-driven consolidation detection. This indicator doesn't just show where RSI is trending — it interprets how strong that trend is, when that strength changes, and where the market may be consolidating in anticipation of breakout movement.
Using a combination of Kalman-filtered RSI, custom-built DMI/ADX, and low-volatility zone recognition, it gives traders a dynamic RSI with strength-based coloring, while also highlighting consolidation zones to spot breakout opportunities.
█ Its uniqueness
Traditional RSI indicators lack context. They may show you when the market is overbought or oversold, but they won’t tell you how strong that condition is, or whether it’s likely to result in continuation or consolidation.
This tool aims to solve that by introducing adaptive strength metrics and structural compression zones, allowing traders to anticipate when the market is likely preparing for a move.
█ How It Works
⚪ Enhanced RSI
Combines traditional RSI and a custom RSI implementation
Smooths both through a Kalman filter for trend direction
Final RSI line reflects smoothed consensus between manual and built-in RSI
Adds an RSI + Strength overlay to show when the directional conviction is increasing
⚪ ADX-Driven Strength Layer
Directional Movement Index (DMI) is calculated both manually and with built-in smoothing
The average ADX value is used to calculate a strength modifier
When ADX exceeds 20, RSI is dynamically enhanced or dampened to reflect directional force
Resulting visual: RSI appears stronger or weaker based on confirmed trend conditions
⚪ Consolidation Zone Detection
When ADX falls below 20, the indicator enters a consolidation zone state
Boxes are drawn dynamically to contain the price within these low-volatility structures
Once the price breaks out of the zone, the indicator plots a breakout signal (▲ or ▼)
⚪ Breakouts
Breakout markers are placed at the first close outside the consolidation box
These signals serve as early indicators for potential trend continuation or reversal
█ How to Use
⚪ Confirm Momentum Strength
Use the RSI + Strength line to determine whether current momentum is backed by trend conviction. If strength expands alongside rising RSI, the move has confirmation.
⚪ Consolidations Zones
When RSI is around the midline, and a consolidation box appears, expect lower volatility and a range-bound market, followed by a breakout.
⚪ Use Breakout Signals for Entry
Look for ▲ or ▼ markers as early triggers. These often coincide with volume expansions or structural breaks.
█ Settings Explained
RSI Length – Number of bars used for RSI. Shorter = more sensitive.
DMI Length – Used in both custom and built-in ADX/DI calculations.
ADX Smoothing – Smooths the trend strength signal. Higher values = smoother strength detection.
Trend Confirmation (Filter Strength) – Adjusts the responsiveness of the Kalman filter.
-----------------
Disclaimer
The content provided in my scripts, indicators, ideas, algorithms, and systems is for educational and informational purposes only. It does not constitute financial advice, investment recommendations, or a solicitation to buy or sell any financial instruments. I will not accept liability for any loss or damage, including without limitation any loss of profit, which may arise directly or indirectly from the use of or reliance on such information.
All investments involve risk, and the past performance of a security, industry, sector, market, financial product, trading strategy, backtest, or individual's trading does not guarantee future results or returns. Investors are fully responsible for any investment decisions they make. Such decisions should be based solely on an evaluation of their financial circumstances, investment objectives, risk tolerance, and liquidity needs.

Smarter Money Concepts - OBs [PhenLabs]📊 Smarter Money Concepts - OBs
Version: PineScript™ v6
📌 Description
Smarter Money Concepts - OBs (Order Blocks) is an advanced technical analysis tool designed to identify and visualize institutional order zones on your charts. Order blocks represent significant areas of liquidity where smart money has entered positions before major moves. By tracking these zones, traders can anticipate potential reversals, continuations, and key reaction points in price action.
This indicator incorporates volume filtering technology to identify only the most significant order blocks, eliminating low-quality signals and focusing on areas where institutional participation is likely present. The combination of price structure analysis and volume confirmation provides traders with high-probability zones that may attract future price action for tests, rejections, or breakouts.
🚀 Points of Innovation
Volume-Filtered Block Detection : Identifies only order blocks formed with significant volume, focusing on areas with institutional participation
Advanced Break of Structure Logic : Uses sophisticated price action analysis to detect legitimate market structure breaks preceding order blocks
Dynamic Block Management : Intelligently tracks, extends, and removes order blocks based on price interaction and time-based expiration
Structure Recognition System : Employs technical analysis algorithms to find significant swing points for accurate order block identification
Dual Directional Tracking : Simultaneously monitors both bullish and bearish order blocks for comprehensive market structure analysis
🔧 Core Components
Order Block Detection : Identifies institutional entry zones by analyzing price action before significant breaks of structure, capturing where smart money has likely positioned before moves.
Volume Filtering Algorithm : Calculates relative volume compared to a moving average to qualify only order blocks formed with significant market participation, eliminating noise.
Structure Break Recognition : Uses price action analysis to detect legitimate breaks of market structure, ensuring order blocks are identified only at significant market turning points.
Dynamic Block Management : Continuously monitors price interaction with existing blocks, extending, maintaining, or removing them based on current market behavior.
🔥 Key Features
Volume-Based Filtering : Filter out insignificant blocks by requiring a minimum volume threshold, focusing only on zones with likely institutional activity
Visual Block Highlighting : Color-coded boxes clearly mark bullish and bearish order blocks with customizable appearance
Flexible Mitigation Options : Choose between “Wick” or “Close” methods for determining when a block has been tested or mitigated
Scan Range Adjustment : Customize how far back the indicator looks for structure points to adapt to different market conditions and timeframes
Break Source Selection : Configure which price component (close, open, high, low) is used to determine structure breaks for precise block identification
🎨 Visualization
Bullish Order Blocks : Blue-colored rectangles highlighting zones where bullish institutional orders were likely placed before upward moves, representing potential support areas.
Bearish Order Blocks : Red-colored rectangles highlighting zones where bearish institutional orders were likely placed before downward moves, representing potential resistance areas.
Block Extension : Order blocks extend to the right of the chart, providing clear visualization of these significant zones as price continues to develop.
📖 Usage Guidelines
Order Block Settings
Scan Range : Default: 25. Defines how many bars the indicator scans to determine significant structure points for order block identification.
Bull Break Price Source : Default: Close. Determines which price component is used to detect bullish breaks of structure.
Bear Break Price Source : Default: Close. Determines which price component is used to detect bearish breaks of structure.
Visual Settings
Bullish Blocks Color : Default: Blue with 85% transparency. Controls the appearance of bullish order blocks.
Bearish Blocks Color : Default: Red with 85% transparency. Controls the appearance of bearish order blocks.
General Options
Block Mitigation Method : Default: Wick, Options: Wick, Close. Determines how block mitigation is calculated - “Wick” uses high/low values while “Close” uses close values for more conservative mitigation criteria.
Remove Filled Blocks : Default: Disabled. When enabled, order blocks are removed once they’ve been mitigated by price action.
Volume Filter
Volume Filter Enabled : Default: Enabled. When activated, only shows order blocks formed with significant volume relative to recent average.
Volume SMA Period : Default: 15, Range: 1-50. Number of periods used to calculate the average volume baseline.
Min. Volume Ratio : Default: 1.5, Range: 0.5-10.0. Minimum volume ratio compared to average required to display an order block; higher values filter out more blocks.
✅ Best Use Cases
Identifying high-probability support and resistance zones for trade entries and exits
Finding optimal stop-loss placement behind significant order blocks
Detecting potential reversal areas where price may react after extended moves
Confirming breakout trades when price clears major order blocks
Building a comprehensive market structure map for medium to long-term trading decisions
Pinpointing areas where smart money may have positioned before major market moves
⚠️ Limitations
Most effective on higher timeframes (1H and above) where institutional activity is more clearly defined
Can generate multiple signals in choppy market conditions, requiring additional filtering
Volume filtering relies on accurate volume data, which may be less reliable for some securities
Recent market structure changes may invalidate older order blocks not yet automatically removed
Block identification is based on historical price action and may not predict future behavior with certainty
💡 What Makes This Unique
Volume Intelligence : Unlike basic order block indicators, this script incorporates volume analysis to identify only the most significant institutional zones, focusing on quality over quantity.
Structural Precision : Uses sophisticated break of structure algorithms to identify true market turning points, going beyond simple price pattern recognition.
Dynamic Block Management : Implements automatic block tracking, extension, and cleanup to maintain a clean and relevant chart display without manual intervention.
Institutional Focus : Designed specifically to highlight areas where smart money has likely positioned, helping retail traders align with institutional perspectives rather than retail noise.
🔬 How It Works
1. Structure Identification Process :
The indicator continuously scans price action to identify significant swing points and structure levels within the specified range, establishing a foundation for order block recognition.
2. Break Detection :
When price breaks an established structure level (crossing below a significant low for bearish breaks or above a significant high for bullish breaks), the indicator marks this as a potential zone for order block formation.
3. Volume Qualification :
For each potential order block, the algorithm calculates the relative volume compared to the configured period average. Only blocks formed with volume exceeding the minimum ratio threshold are displayed.
4. Block Creation and Management :
Valid order blocks are created, tracked, and managed as price continues to develop. Blocks extend to the right of the chart until they are either mitigated by price action or expire after the designated timeframe.
5. Continuous Monitoring :
The indicator constantly evaluates price interaction with existing blocks, determining when blocks have been tested, mitigated, or invalidated, and updates the visual representation accordingly.
💡 Note:
Order Blocks represent areas where institutional traders have likely established positions and may defend these zones during future price visits. For optimal results, use this indicator in conjunction with other confluent factors such as key support/resistance levels, trendlines, or additional confirmation indicators. The most reliable signals typically occur on higher timeframes where institutional activity is most prominent. Start with the default settings and adjust parameters gradually to match your specific trading instrument and style.

BB Breakout + Momentum Squeeze [Strategy]This Strategy is Based on 3 free indicators
- Bollinger Bands Breakout Oscillator: Link
- TTM Squeeze Pro: Link
- Rolling ATR Bands: Link
Bollinger Bands Breakout Oscillator - This tool shows how strong a market trend is by measuring how often prices move outside their normal Bollinger bands range. It helps you see whether prices are strongly moving in one direction or just moving sideways. By looking at how much and how frequently prices push beyond their typical boundaries, you can identify which direction the market is heading over your selected time period.
TM Squeeze Pro - This is a custom version of the TTM Squeeze indicator.
It's designed to help traders spot consolidation phases in the market (when price is coiling or "squeezing") and to catch breakouts early when volatility returns. The logic is based on the relationship between Bollinger Bands and Keltner Channels, combined with a momentum oscillator to show direction and strength.
Rolling ATR Bands - This indicator combines volatility bands (ATR) with momentum and trend signals to show where the market might be breaking out, retesting, or trending. It's highly visual and helpful for traders looking to time entries/exits during trending or volatile moves.
Logic Of the Strategy:
We are going to use the Bollinger Bands Breakout to determine the direction of the market. Than check the Volatility of the price by looking at the TTM Squeeze indicator. And use the ATR Bands to determine dynamic Stop Losses and based on the calculate the Take Profit targets and quantity for each position dynamically.
For the Long Setup:
1. We need to see the that Bull Power (Green line of the Bollinger Bands Breakout Oscilator) is crossing the level of 50.
2. Check the presence of volatility (Green dot based on the TTM Squeeze indicator)
For the Short Setup:
1. We need to see the that Bear Power (Red line of the Bollinger Bands Breakout Oscilator) is crossing the level of 50.
2. Check the presence of volatility (Green dot based on the TTM Squeeze indicator)
Stop Loss is determined by the Lower ATR Band (for the Long entry) and Upper ATR Band (For the Short entry)
Take Profit is 1:1.5 risk reward ration, which means if the Stop loss is 1% the TP target will be 1.5%
Move stop Loss to Breakeven: If the price will go in the direction of the trade for at least half of the Risk Reward target then the stop will automatically be adjusted to the entry price. For Example: the Stop Loss is 1%, the price has move at least 0.5% in the direction of your trade and that will move the Stop Loss level to the Entry point.
You can Adjust the parameters for each indicator used in that script and also adjust the Risk and Money management block to see how the PnL will change.

Premarket High/Low Breakout AlertsPremarket High/Low Breakout Alerts
Description: This custom TradingView indicator helps you track premarket breakouts and breakdowns for a list of selected stocks. The indicator monitors the premarket session and sends an alert every time the stock's price breaks above the premarket high or below the premarket low.
Key Features:
Track Multiple Stocks: Easily monitor multiple stocks (e.g., AAPL, TSLA, NVDA, etc.) and get alerts when they break premarket levels.
Premarket Session Monitoring: The indicator checks for price movements during the premarket session (4:00 AM to 9:30 AM EST).
Customizable Ticker List: Modify the list of tickers directly from the TradingView settings to suit your daily trading needs.
Breakout and Breakdown Alerts: Receive instant alerts for both breakout (above premarket high) and breakdown (below premarket low) conditions.
Plot Premarket Levels: The premarket high and low levels are plotted on the chart for easy reference.
How to Use:
Add this indicator to your chart.
Go to the indicator settings and input your desired stock tickers (e.g., AAPL, TSLA, MSFT).
The indicator will automatically track the premarket levels and send alerts when those levels are broken.
Customize the tickers daily if needed.
Ideal For:
Day Traders who want to track premarket movements.
Swing Traders looking for strong breakouts from premarket levels.
Scalpers who need quick alerts to catch price action early.

FVG Breakout/BreakdownThe FVG Breakout/Breakdown indicator is designed to identify potential breakout and breakdown opportunities in the market, based on the concept of Fair Value Gaps (FVGs). FVGs are areas where price moves too quickly, leaving behind gaps between candlesticks, often seen as areas of inefficiency or imbalance that the market tends to revisit.
Key Concepts:
Fair Value Gaps (FVG):
FVG occurs when a price gap is created between candlesticks, typically when the high of one candle is lower than the low of the previous candle (for a bearish FVG) or the low of one candle is higher than the high of the previous candle (for a bullish FVG).
These gaps represent an imbalance between buying and selling pressure, and the market often revisits them, making them valuable for identifying potential entry points.
Bullish FVG: This occurs when the low of the current candle is higher than the high of the previous candle.
Condition: low > high
Bearish FVG: This occurs when the high of the current candle is lower than the low of the previous candle.
Condition: high < low
Breakout/Breakdown Signals:
Breakout: A bullish breakout signal occurs when the price breaks above a defined resistance level after an FVG gap. This suggests that the market may continue moving higher.
Breakdown: A bearish breakdown signal occurs when the price breaks below a defined support level after an FVG gap. This suggests that the market may continue moving lower.
NWOG (New Week Opening Gap):
The NWOG can be used as an additional factor to confirm the FVG signal. The gap between Friday's close and Monday's open is a crucial level for identifying the start of a new move for the week.
NWOG helps to further refine the timing of breakout or breakdown signals, only triggering them when price moves relative to the Monday Open and shows a new direction.
Stochastic Trendlines with Breakouts [Jamshid] - EnhancedStochastic Trendlines with Breakouts - Enhanced Version
This advanced Stochastic Trendlines with Breakouts script combines several powerful features to provide enhanced breakout detection based on the Stochastic Oscillator and additional confirmation signals. This script is designed to help traders identify key trend reversals, breakout points, and pivot levels with more accuracy by integrating advanced filters such as RSI confirmation, moving average trend filtering, volatility filtering, divergence detection, and multi-timeframe analysis.
Key Features:
Stochastic Oscillator-Based Breakouts:
Automatically detects breakouts based on the smoothed Stochastic Oscillator values (%K and %D), providing insights into overbought and oversold conditions.
Customizable overbought and oversold levels, with a mid-level (50) line for additional reference.
Trendlines on Pivot Points:
Automatically plots dynamic trendlines based on pivot highs and lows of the smoothed Stochastic %K, helping to visualize potential reversal points.
RSI Confirmation (Optional):
Filters breakout signals using the Relative Strength Index (RSI) to confirm breakouts only when the RSI is below 50 for downtrend breakouts and above 50 for uptrend breakouts.
Visual confirmation with a green "RSI Conf." label displayed on the chart when the RSI condition is met.
Moving Average Filter (Optional):
Confirms breakout signals in the direction of a user-defined Moving Average (MA) to trade in the overall market trend direction.
MA length is fully customizable.
Stochastic Divergence Filter (Optional):
Detects bullish or bearish divergence between the price and Stochastic Oscillator values, adding an extra layer of confirmation.
Multi-Timeframe Confirmation (Optional):
Confirms breakouts by checking the Stochastic %K and %D values from a higher timeframe. This helps in avoiding false signals by aligning with the broader market trend.
The higher timeframe can be customized to any timeframe (e.g., daily, weekly, etc.).
Volatility Filter (Optional):
Uses the ATR (Average True Range) to filter out breakouts during periods of low volatility, ensuring signals are only triggered when there is sufficient price movement.
ATR length and multiplier are fully customizable.
Custom Alerts:
Alerts are available for new trendline detections (both pivot high and pivot low) and for confirmed breakout signals. These alerts help traders stay informed in real-time without needing to monitor the chart continuously.
How to Use:
Customize the Stochastic Oscillator settings, such as %K smoothing and %D line parameters, to fit your trading strategy.
Enable or disable additional filtering features (RSI, MA, divergence, MTF, volatility) as needed.
Set up alerts for specific breakout conditions directly in TradingView to stay notified when breakout signals are triggered.
This script is designed for traders who are looking for precision breakout signals with added layers of confirmation to avoid false breakouts and enhance trading accuracy.

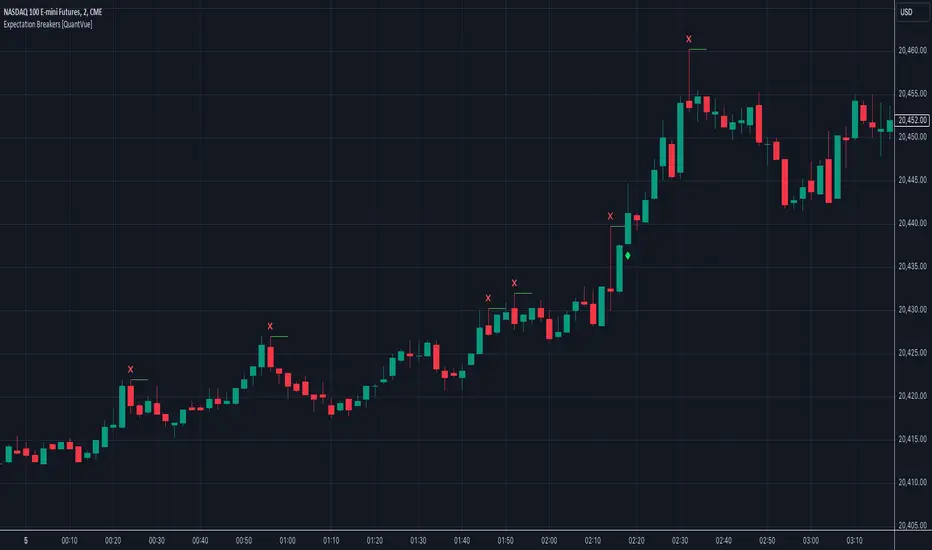
Expectation Breakers [QuantVue]In technical analysis, an "Expectation Breaker" refers to a market event where price action defies typical patterns and anticipated movements, signaling potential shifts in market sentiment and direction.
This indicator looks to take advantage of these opportunities by identifying 2 types of Expectation Breakers: Downside Reversal Buybacks and Upside Reversal Sellbacks.
Downside Reversal
A downside reversals occur when a stock reaches a new high for the user defined lookback period (65 bars by default), and then experiences a larger-than-average drop and closes near its lows. This usually indicates that the market has overextended itself. The expectation is that there will be 2-3 bars of significant selling, following the downside reversal.
However, a notable sign of strength is if the stock rebounds and closes above the downside reversal bar's high within 1-3 bars. This is known as a Downside Reversal Buyback. A rapid recovery following a downside reversal is a powerful bullish indicator, breaking the expectation of lower prices. The quicker price recovers from a downside reversal, the more meaningful it is. Such a swift rebound suggests that the market's strength was underestimated, as downside reversals typically signal a short-term decline.
Upside Reversal
An upside reversal occurs when a stock reaches a new low for the user-defined lookback period (65 bars by default), and then experiences a larger-than-average rise and closes near its highs. This usually indicates that the market has overextended itself to the downside. The expectation is that there will be 2-3 bars of significant buying, following the upside reversal.
However, a notable sign of weakness is if the stock falls back and closes below the upside reversal bar's low within 1-3 bars. This is known as a Upside Reversal Sellback. A rapid fallback following an upside reversal is a powerful bearish indicator, breaking the expectation of higher prices. The quicker price falls back from an upside reversal, the more meaningful it is. Such a swift fallback suggests that the market's weakness was underestimated, as upside reversals typically signal a short-term rally.
The Expectation Breakers indicator identifies these opportunities by first identifying new highs and lows within a defined lookback period. It then compares the true range (TR), average true range (ATR), and closing range to confirm the significance of these reversals. The use of TR and ATR ensures that the reversals are substantial enough to indicate a genuine shift in market sentiment, helping to identify when price action breaks expectations.
Give this indicator a BOOST and COMMENT your thoughts below!
We hope you enjoy.
Cheers!
ORB Heikin Ashi SPY 5min Correlation StrategyOverview:
The ORB (Opening Range Breakout) strategy combined with Heikin Ashi candles and Relative Volume (RVOL) indicator aims to capitalize on significant price movements that occur shortly after the market opens. This strategy identifies breakouts above or below the opening range, using Heikin Ashi candles for smoother price visualization and RVOL to gauge the strength of the breakout.
Components:
Opening Range Breakout (ORB): The strategy starts by defining the opening range, typically the first few minutes of the trading session. It then identifies breakouts above the high or below the low of this range as potential entry points.
Heikin Ashi Candles: Heikin Ashi candles are used to provide a smoother representation of price movements compared to traditional candlesticks. By averaging open, close, high, and low prices of the previous candle, Heikin Ashi candles reduce noise and highlight trends more effectively.
Relative Volume (RVOL): RVOL compares the current volume of a stock to its average volume over a specified period. It helps traders identify abnormal trading activity, which can signal potential price movements.
Candle for correlation : In this case we are using SPY candles. It can also use different asset
Strategy Execution:
Initialization: The strategy initializes by setting up variables and parameters, including the ORB period, session timings, and Heikin Ashi candle settings.
ORB Calculation: It calculates the opening range by identifying the high and low prices during the specified session time. These values serve as the initial reference points for potential breakouts. For this we are looking for the first 30 min of the US opening session.
After that we are going to use the next 2 hours to check for breakout opportunities.
Heikin Ashi Transformation: Optionally, the strategy transforms traditional candlestick data into Heikin Ashi format for smoother visualization and trend identification.
Breakout Identification: It continuously monitors price movements within the session and checks if the current high breaches the ORB high or if the current low breaches the ORB low. These events trigger potential long or short entry signals, respectively.
RVOL Analysis: Simultaneously, the strategy evaluates the relative volume of the asset to gauge the strength of the breakout. A surge in volume accompanying the breakout confirms the validity of the signal. In this case we are looking for at least a 1 value of the division between currentVolume and pastVolume
Entry and Exit Conditions: When a breakout occurs and is confirmed by RVOL and is within our session time, the strategy enters a long or short position accordingly. It does not have a stop loss or a takie profit level, instead it will always exit at the end of the trading session, 5 minutes before
Position Sizing and Commissions: For the purpose of this backtest, the strategy allocated 10% of the capital for each trade and assumes a trading commission of 0.01$ per share ( twice the IBKR broker values)
Session End: At the end of the trading session, the strategy closes all open positions to avoid overnight exposure.
Conclusion:
The combination of ORB breakout strategy, Heikin Ashi candles, and RVOL provides traders with a robust framework for identifying and capitalizing on early trends in the market. By leveraging these technical indicators together, traders can make more informed decisions and improve the overall performance of their trading strategies. However, like any trading strategy, it's essential to backtest thoroughly and adapt the strategy to different market conditions to ensure its effectiveness over time.

Donchian Quest Research// =================================
Trend following strategy.
// =================================
Strategy uses two channels. One channel - for opening trades. Second channel - for closing.
Channel is similar to Donchian channel, but uses Close prices (not High/Low). That helps don't react to wicks of volatile candles (“stop hunting”). In most cases openings occur earlier than in Donchian channel. Closings occur only for real breakout.
// =================================
Strategy waits for beginning of trend - when price breakout of channel. Default length of both channels = 50 candles.
Conditions of trading:
- Open Long: If last Close = max Close for 50 closes.
- Close Long: If last Close = min Close for 50 closes.
- Open Short: If last Close = min Close for 50 closes.
- Close Short: If last Close = max Close for 50 closes.
// =================================
Color of lines:
- black - channel for opening trade.
- red - channel for closing trade.
- yellow - entry price.
- fuchsia - stoploss and breakeven.
- vertical green - go Long.
- vertical red - go Short.
- vertical gray - close in end, don't trade anymore.
// =================================
Order size calculated with ATR and volatility.
You can't trade 1 contract in BTC and 1 contract in XRP - for example. They have different price and volatility, so 1 contract BTC not equal 1 contract XRP.
Script uses universal calculation for every market. It is based on:
- Risk - USD sum you ready to loss in one trade. It calculated as percent of Equity.
- ATR indicator - measurement of volatility.
With default setting your stoploss = 0.5 percent of equity:
- If initial capital is 1000 USD and used parameter "Permit stop" - loss will be 5 USD (0.5 % of equity).
- If your Equity rises to 2000 USD and used parameter "Permit stop"- loss will be 10 USD (0.5 % of Equity).
// =================================
This Risk works only if you enable “Permit stop” parameter in Settings.
If this parameter disabled - strategy works as reversal strategy:
⁃ If close Long - channel border works as stoploss and momentarily go Short.
⁃ If close Short - channel border works as stoploss and momentarily go Long.
Channel borders changed dynamically. So sometime your loss will be greater than ‘Risk %’. Sometime - less than ‘Risk %’.
If this parameter enabled - maximum loss always equal to 'Risk %'. This parameter also include breakeven: if profit % = Risk %, then move stoploss to entry price.
// =================================
Like all trend following strategies - it works only in trend conditions. If no trend - slowly bleeding. There is no special additional indicator to filter trend/notrend. You need to trade every signal of strategy.
Strategy gives many losses:
⁃ 30 % of trades will close with profit.
⁃ 70 % of trades will close with loss.
⁃ But profit from 30% will be much greater than loss from 70 %.
Your task - patiently wait for it and don't use risky setting for position sizing.
// =================================
Recommended timeframe - Daily.
// =================================
Trend can vary in lengths. Selecting length of channels determine which trend you will be hunting:
⁃ 20/10 - from several days to several weeks.
⁃ 20/20 or 50/20 - from several weeks to several months.
⁃ 50/50 or 100/50 or 100/100 - from several months to several years.
// =================================
Inputs (Settings):
- Length: length of channel for trade opening/closing. You can choose 20/10, 20/20, 50/20, 50/50, 100/50, 100/100. Default value: 50/50.
- Permit Long / Permit short: Longs are most profitable for this strategy. You can disable Shorts and enable Longs only. Default value: permit all directions.
- Risk % of Equity: for position sizing used Equity percent. Don't use values greater than 5 % - it's risky. Default value: 0.5%.
⁃ ATR multiplier: this multiplier moves stoploss up or down. Big multiplier = small size of order, small profit, stoploss far from entry, low chance of stoploss. Small multiplier = big size of order, big profit, stop near entry, high chance of stoploss. Default value: 2.
- ATR length: number of candles to calculate ATR indicator. It used for order size and stoploss. Default value: 20.
- Close in end - to close active trade in the end (and don't trade anymore) or leave it open. You can see difference in Strategy Tester. Default value: don’t close.
- Permit stop: use stop or go reversal. Default value: without stop, reversal strategy.
// =================================
Properties (Settings):
- Initial capital - 1000 USD.
- Script don't uses 'Order size' - you need to change 'Risk %' in Inputs instead.
- Script don't uses 'Pyramiding'.
- 'Commission' 0.055 % and 'Slippage' 0 - this parameters are for crypto exchanges with perpetual contracts (for example Bybit). If use on other markets - set it accordingly to your exchange parameters.
// =================================
Big dataset used for chart - 'BITCOIN ALL TIME HISTORY INDEX'. It gives enough trades to understand logic of script. It have several good trends.
// =================================

TMA Bands with Break Arrow @ClearTradingMind
The "TMA Bands with Break Arrow" indicator, developed by ClearTradingMind, is designed to provide traders with insights into potential trend reversals based on the movement of price within a channel defined by the Triangular Moving Average (TMA) and its bands. The TMA is a smoothed moving average, and this indicator adds upper and lower bands to visualize potential breakouts.
Key Components:
1. TMA Bands: The indicator plots the upper and lower bands of the TMA channel. These bands represent potential overbought (upper band) and oversold (lower band) conditions.
2. Break Arrows: The indicator generates buy (green triangle up) and sell (red triangle down) arrows when the closing price breaks above the upper band or below the lower band, indicating a potential trend reversal.
3. Background Color: The background color dynamically changes based on the last generated signal. A blue background suggests a recent buy signal, while a red background indicates a recent sell signal. This provides a quick visual reference for the prevailing market sentiment.
Usage:
1. Trend Reversals: Traders can use the buy and sell arrows as signals for potential trend reversals. A buy signal suggests a possible upward trend, while a sell signal suggests a potential downward trend.
2. Channel Breakouts: Watch for price breaking above the upper band (buy signal) or below the lower band (sell signal). These breakouts may indicate the start of a new trend.
3. Volatility Analysis: The width of the TMA channel represents volatility. A widening channel suggests increased volatility, while a narrowing channel suggests decreasing volatility.
4. Background Color: The background color provides additional context. A blue background indicates recent bullish sentiment, while a red background suggests recent bearish sentiment.
Parameters:
- TMA Period: The number of bars used to calculate the Triangular Moving Average.
- ATR Period: The number of bars used to calculate the Average True Range (ATR) for determining the width of the TMA channel.
- ATR Multiplier: A multiplier applied to the ATR to determine the width of the TMA channel.
Note: This indicator is a tool to assist traders in their analysis, and it is recommended to use it in conjunction with other technical and fundamental analysis methods for more comprehensive decision-making.
Disclaimer: Trading involves risk, and this indicator does not guarantee profit. Users should conduct thorough analysis and risk management before making trading decisions.

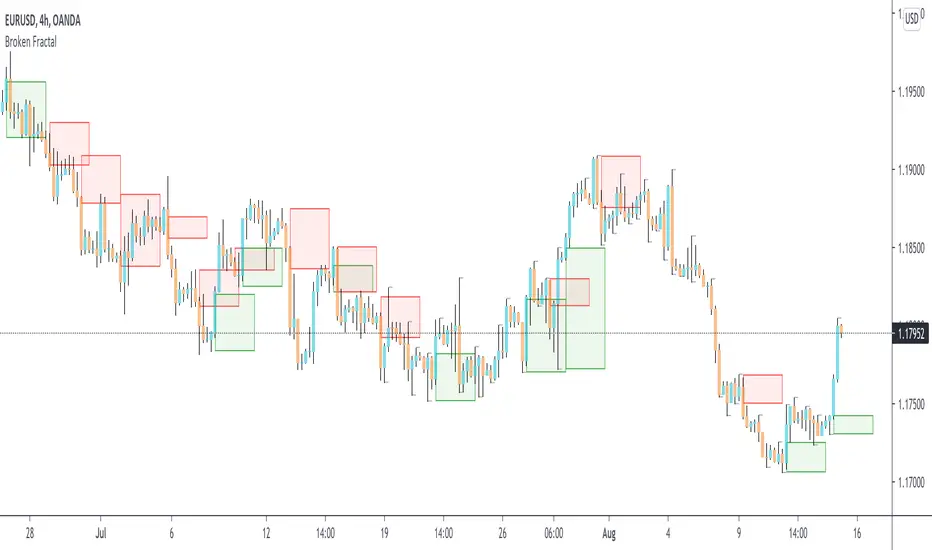
Broken Fractal : Someone's broken dream is your profit!Idea
The idea is simple : when market turns around, it traps a bunch of traders off guard. We trade with them, in the same direction of their exit!
Method
We let the market first create a fractal
We then let the market create an opposite fractal
We then let the market break the first fractal it created, thereby trapping lots of trades in the process
We then patiently wait till the market gives these trapped traders a chance to exit - and we trade in the same direction
How to use?
Green boxes are for long entry, red boxes are for short.
Whenever a box appears, that's the risk criteria - setup limit orders and trade along!
Works on all timeframes
If you like this script, please leave a note on how you are using it.
I personally use it with Higher Timeframe bias.
PS1 : some traders call this Break of market structure, some call it Breaker, I just call it "Broken Fractal"
PS2 : Break of a broken fractal is also very potent. Watch out for those!
52 Week High/Low to YesterdayThis script adds the 52 weeks (one year) high/low to the chart but it wouldn't update the value on the current trading day, so that it would remain at the same level for the whole trading day. It can come really handy for day trading the day of the 52 weeks high/low breakout/breakdown.

Super Crooks - Breakers█ OVERVIEW
This indicator plots bullish and bearish breaker formations. When price is moving quickly, it can be difficult to mark out breaker formations across multiple timeframes. This indicator simplifies that process by marking these out automatically -- ultimately making the formations easily visible.
█ CONCEPTS
Adds L, H, LL, HH swing point labels to show bullish breaker formations
Adds H, L, HH, LL swing point labels to show bearish breaker formations
█ HOW TO USE
Add the Super Crooks Breakers indicator to your TradingView charts
Open the indicator's settings and select your preferred configurations
Watch your charts to see the indicator plot breaker formations
█ FEATURES
Visuals are drawn in real time (after candle closure) on your selected timeframe
Breaker formations can be configured to be plotted based on candle wick (high/low) price or candle close price
Configuration options (swing lengths, show/hide setups)

Luminous Market Flux [Pineify]Luminous Market Flux - Dynamic Volatility Channel with Breakout Detection
The Luminous Market Flux indicator is a sophisticated volatility-based trading tool that combines dynamic channel analysis with breakout detection and squeeze identification. This indicator helps traders visualize market conditions by creating an adaptive envelope around price action, highlighting periods of compression (low volatility) and expansion (high volatility) while generating actionable buy and sell signals at key breakout moments.
Key Features
Dynamic volatility channel that adapts to changing market conditions using ATR-based calculations
Visual squeeze detection system that warns traders when volatility is contracting
Automatic breakout signal generation for both bullish and bearish scenarios
Luminous gradient fill that provides instant visual feedback on price position within the channel
Bar coloring feature that highlights strong volatility breakouts
Built-in alert conditions for automated trading notifications
How It Works
The indicator operates on three core calculation layers:
1. Baseline Calculation (Central Tendency)
The foundation uses a Running Moving Average (RMA) of the closing price over the specified Flux Length period. RMA was specifically chosen over SMA or EMA because it provides smoother trend detection similar to how RSI and ATR calculations work, reducing noise while maintaining responsiveness to genuine price movements.
2. Volatility Measurement
The channel width is determined by the Average True Range (ATR) multiplied by the Flux Expansion Factor. ATR captures the true volatility of the market by accounting for gaps and limit moves, making the channel responsive to actual market conditions rather than just closing price variations.
3. Squeeze Detection Logic
The indicator compares the current channel width against a 100-period simple moving average of historical channel widths. When the current range falls below 80% of this average, a squeeze condition is identified, signaling that volatility is compressing and a significant move may be imminent.
Trading Ideas and Insights
Breakout Trading: Enter long positions when price breaks above the upper flux channel with a BUY signal, and short positions when price breaks below the lower channel with a SELL signal. These breakouts indicate strong momentum in the direction of the move.
Squeeze Anticipation: When squeeze circles appear at the top of the chart, prepare for a potential explosive move. Squeezes often precede significant breakouts as the market coils before releasing energy in one direction.
Trend Confirmation: Use the bar coloring feature to confirm trend strength. Colored bars indicate that price is trading outside the volatility envelope, suggesting strong directional momentum.
Mean Reversion: When price is within the channel (no bar coloring), the gradient fill helps identify whether price is closer to the upper or lower boundary, potentially useful for mean-reversion strategies.
How Multiple Indicators Work Together
This indicator integrates several technical concepts into a cohesive system:
The RMA baseline provides the trend anchor, while the ATR-based envelope adapts to volatility conditions. These two components work together to create a channel that expands during volatile periods and contracts during quiet markets. The squeeze detection layer adds a third dimension by comparing current volatility to historical norms, alerting traders when the market is unusually quiet.
The visual elements reinforce this analysis: the gradient fill shows price position within the channel at a glance, bar coloring confirms breakout strength, and shape markers provide discrete entry signals. This multi-layered approach ensures traders receive consistent information across different visualization methods.
Unique Aspects
The "Luminous" visual design uses color gradients that dynamically shift based on price position, creating an intuitive heat-map effect within the channel
Unlike traditional Bollinger Bands that use standard deviation, this indicator uses ATR for volatility measurement, making it more responsive to actual price range movements
The squeeze detection compares current volatility to a longer-term average (100 periods), providing context-aware compression signals rather than arbitrary thresholds
Signal generation uses proper state tracking to ensure breakout signals only fire on the initial breakout, not on every bar during an extended move
How to Use
Add the indicator to your chart. It will overlay directly on price with the volatility channel visible.
Watch for BUY labels appearing below bars when price breaks above the upper channel - these indicate bullish breakout opportunities.
Watch for SELL labels appearing above bars when price breaks below the lower channel - these indicate bearish breakout opportunities.
Monitor for small circles at the top of the chart indicating squeeze conditions - prepare for potential breakouts when these appear.
Use the colored bars as confirmation of breakout strength - green bars confirm bullish momentum, red bars confirm bearish momentum.
Set up alerts using the built-in alert conditions to receive notifications for buy signals, sell signals, and squeeze warnings.
Customization
Flux Length (default: 20): Controls the lookback period for both the baseline and ATR calculations. Lower values create more responsive but noisier channels; higher values create smoother but slower-reacting channels.
Flux Expansion Factor (default: 2.0): Multiplier for the ATR value that determines channel width. Higher values create wider channels with fewer signals; lower values create tighter channels with more frequent signals.
Smooth Signal : Toggle for signal smoothing preference.
Bullish Energy : Customize the color for bullish breakouts and upper channel highlights.
Bearish Energy : Customize the color for bearish breakouts and lower channel highlights.
Compression/Neutral : Customize the color for squeeze indicators and neutral channel states.
Conclusion
The Luminous Market Flux indicator provides traders with a comprehensive volatility analysis tool that combines channel-based trend detection, squeeze identification, and breakout signaling into a single, visually intuitive package. By using ATR-based volatility measurement and RMA smoothing, the indicator adapts to changing market conditions while filtering out noise. Whether you are a breakout trader looking for momentum entries or a swing trader waiting for volatility expansion after compression periods, this indicator offers the visual clarity and signal precision needed to make informed trading decisions.

Malama's Pre-Market BoxThis script is a comprehensive Pre-Market range visualizer designed to replace older, single-candle analysis tools. It automatically highlights the full pre-market session (04:00–09:30 EST) and extends key support/resistance levels into the regular trading day.
Why this script was created (Evolution from previous versions): This is a complete architectural rewrite of the older "Malama's KAYCAP Pre-Market Box."
Old Logic: The previous version focused on isolating a single, specific 1-minute candle (e.g., exactly 4:00 AM) to determine levels.
New Logic: This version tracks the entire pre-market session range. It dynamically updates the True High and True Low as the pre-market develops, providing a much more accurate support/resistance zone for the open.
Visual Overhaul: Instead of static plots, this version uses Pine Script v6 box and line objects to draw a clean, shading-customizable range that automatically extends rightward until the trading session ends.
How it works:
Session Tracking: The script monitors the user-defined session (default 04:00-09:30).
Dynamic Box: As price moves during pre-market, a box is drawn covering the highest high and lowest low of that period.
Level Extension: At 09:30 (Market Open), the script locks the High and Low values. It then projects two horizontal lines (Resistance and Support) across the chart for the rest of the day.
Breakout Detection: If the price closes outside these levels during regular hours, the script can optionally trigger Alerts and plot "BREAK" labels on the chart.
Settings:
Time Settings: Customizable session string (default captures standard US Pre-Market).
Visuals: Fully adjustable box colors, border transparency, and line width.
Signals: Toggle breakout labels on/off.
Alerts Included:
Bullish Breakout: Triggers when price crosses and closes above the Pre-Market High.
Bearish Breakdown: Triggers when price crosses and closes below the Pre-Market Low.

FCPO MASTER v6 – Sideway + Breakout + OB + FVG (TUPLE SAFE)TL;DR cepat
1. Gunakan M5 untuk entry & OB/FVG confirmation.
2. Gunakan M15 untuk confirm trend/false breakout.
3. Gunakan H1 untuk bias arah (overall market).
4. Entry hanya bila signal + OB/FVG/candle rejection (script buatkan).
5. SL 5–8 tick, TP 10–25 tick ikut setup (sideway vs breakout).
6. Follow checklist setiap trade — jangan lompat.
________________________________________
Setup awal (1–2 min)
1. Pasang script FCPO Sideway MASTER – OB + Imbalance + Confirmation di TradingView.
2. Timeframes: buka M5, M15, H1 (susun 3 chart atau 1 chart multi-timeframe).
3. Input default: ATR14, Breakout Buffer 5 tick, RangeLen 20, ADX14, TP12, SL8. (Kau boleh tweak nanti).
4. Aktifkan alerts pada BUY Confirm / SELL Confirm / Sideway Buy / Sideway Sell.
________________________________________
Step-by-step trading process
1) Mulakan dengan H1 — tentukan bias HTF
• Lihat H1 untuk jawapan: Trend Up / Down / Sideway.
• Rule ringkas:
o ADX H1 > 20 + price above H1 EMA → bias Bull
o ADX H1 > 20 + price below H1 EMA → bias Bear
o ADX H1 < 20 → market HTF sideway (no strong bias)
Kenapa: H1 bagi kau idea “kalau breakout pada M5, patut follow atau tolak”.
________________________________________
2) Pergi ke M15 — confirm trend & valid breakout
• M15 kena setuju dengan idea breakout.
o Untuk strong breakout: M15 kena tunjuk candle close di atas/bawah range + volume naik.
o Kalau M5 breakout tapi M15 tak setuju (M15 masih sideway) → treat as fakeout. Jangan masuk.
________________________________________
3) M5 — cari entry & confirmation (OB/FVG + candle)
• M5 adalah tempat kau buat keputusan masuk.
• Tunggu script keluarkan Sideway Buy/Sell atau Breakout Buy/Sell.
• CONFIRM entry mesti ada sekurang-kurangnya 1 dari:
o Bull/Bear Order Block searah signal (script detect).
o FVG / Imbalance zone dipenuhi & price retest.
o Candle rejection (pinbar / bearish/bullish engulfing) pada zone.
Jika tiada confirmation → no trade.
________________________________________
4) Checklist sebelum tekan Buy/Sell (MUST)
• H1 bias tidak melawan trade (prefer sama arah).
• M15 confirm breakout / trend or neutral.
• Script keluarkan signal (sideway or breakout).
• OB or FVG atau candle rejection ada.
• ATR kenaikan jika breakout (untuk breakout trade).
• Volume spike jika breakout.
• Risk:SL <= 2% akaun (position sizing).
Kalau semua ticked → boleh entry.
________________________________________
5) Setting SL / TP & position sizing
• Sideway (scalp): SL = 5–8 tick, TP = 8–12 tick.
• Breakout (trend): SL = 8–12 tick, TP = 15–25+ tick (trail later).
• Position sizing: Risk per trade 1–2%.
o Lot size = (Account Risk RM × 1 tick value) / (SL ticks × tickValue) — (kalau kau gunakan fixed tick value, adjust ikut lot).
(Script tunjuk SL & TP label — follow itu.)
________________________________________
6) Entry types
• A. Sideway Reversal (M5)
o Signal: Sideway Buy / Sideway Sell
o Confirm: OB/FVG or rejection candle at range bottom/top
o Trade: scalp target 8–12 tick, tight SL 5–8 tick
• B. Breakout (M5 entry, M15 confirm)
o Signal: Breakout Buy/Sell (Strong)
o Confirm: ATR expanding + volume spike + M15 alignment
o Trade: trend follow, TP 15–25 tick, trailing stop active
• C. Retest Entry
o Breakout happens, price returns to retest range / OB / FVG → wait for rejection candle then enter. Safer.
________________________________________
7) Trailing & exit rules
• Jika useTrail = true script plots trailing stop (ATR × multiplier).
• Exit rules:
1. Hit TP → close.
2. Hit SL → close.
3. If trailing stop hit → close.
4. If opposing confirmed signal muncul (e.g., SELL confirm while long) → consider close early.
5. If H1 bias flips strongly vs trade → tighten stop or close.
________________________________________
8) Multiple signals & scaling
• Never add to losing position (no averaging down).
• If want scale-in on confirmed trend: add 1 partial size after price moves +10–12 tick in favor and shows continuation candle + no bearish OB/FVG.
• Keep aggregated risk within your max (2–3%).
________________________________________
9) Example trade walkthrough (concrete)
• RangeHigh = 4065, RangeLow = 4035 (contoh).
• Market sideway M5.
Case A — Sideway Sell:
1. Price touches 4064–4065, script shows sidewaySell.
2. Lihat OB: ada bear OB zone di 4062–4066 → confirm.
3. Candle rejection (bearish pinbar) muncul → enter SELL M5.
4. Set SL = 5 tick above rangeHigh = 4070, TP = 10 tick → 4055.
5. Trail jika price turun > 8 tick: aktifkan trailing.
6. Close at TP or trail/SL.
Case B — Breakout Buy:
1. Price closes above 4065 + 5 tick buffer = 4070 on M5. Script shows trueBreakUp.
2. M15 shows candle close above M15 resistance + volume spike → confirm.
3. Enter BUY, SL = 8 tick below entry, TP initial 20 tick, trail with ATR×1.5.
4. Move stop to breakeven after +10 tick, scale out half at +12 tick, leave rest to trail.
________________________________________
10) Journal & review
• Semua trade: record entry time, TF, reason (which confirmations), SL/TP, result, lesson.
• Weekly review: check which confirmation worked best (OB vs FVG vs candle) and tweak settings.
________________________________________
11) Tweaks / optimisations cepat
• Jika terlalu banyak false sideway signals → kurangkan touchDist ke 2 tick.
• Kalau fakeout breakout banyak → tambah tickBuf ke 6–8.
• Nak lebih konservatif → cuma trade breakout yang juga setuju M15.
________________________________________
12) Alerts & execution (practical)
• Pasang alert pada BUY Confirm / SELL Confirm (script).
• Kalau kau guna broker yang support one-click order, siap sediakan template order (SL/TP default).
• Kalau manual, bila alert masuk: buka M5, cepat confirm OB/FVG & candle rejection → entry.
________________________________________
Quick reference table (handy)
• TF utama entry: M5
• Confirm mid-TF: M15
• Bias HTF: H1
• Sideway SL/TP: SL 5–8, TP 8–12
• Breakout SL/TP: SL 8–12, TP 15–25+
• Mandatory confirmation: (Script signal) + (OB or FVG or candle)

Qullamagi EMA Breakout Autotrade (Crypto Futures L+S)Title: Qullamagi EMA Breakout – Crypto Autotrade
Overview
A crypto-focused, Qullamagi-style EMA breakout strategy built for autotrading on futures and perpetual swaps.
It combines a 5-MA trend stack (EMA 10/20, SMA 50/100/200), volatility contraction boxes, volume spikes and an optional higher-timeframe 200-MA filter. The script supports both long and short trades, partial take profit, trailing MA exits and percent-of-equity position sizing for automated crypto futures trading.
Key Features (Crypto)
Qullamagi MA Breakout Engine – trades only when price is aligned with a strong EMA/SMA trend and breaks out of a tight consolidation range. Longs use: Close > EMA10 > EMA20 > SMA50 > SMA100 > SMA200. Shorts are the mirror condition with all MAs sloping in the trend direction.
Strict vs Loose Modes – Strict (Daily) is designed for cleaner swing trades on 1H–4H (full MA stack, box+ATR and volume filters, optional HTF filter). Loose (Intraday) focuses on 10/20/50 alignment with relaxed filters for more frequent 15m–30m signals.
Volatility & Volume Filters for Crypto – ATR-based box height limit to detect volatility contraction, wide-candle filter to avoid chasing exhausted breakouts, and a volume spike condition requiring current volume to exceed an SMA of volume.
Higher-Timeframe Trend Filter (Optional) – uses a 200-period SMA on a higher timeframe (default: 1D). Longs only when HTF close is above the HTF 200-SMA, shorts only when it is below, helping avoid trading against dominant crypto trends.
Autotrade-Oriented Trade Management – position size as % of equity, initial stop anchored to a chosen MA (EMA10 / EMA20 / SMA50) with optional buffer, partial take profit at a configurable R-multiple, trailing MA exit for the remainder, and an optional cooldown after a full exit.
Markets & Timeframes
Best suited for BTC, ETH and major altcoin futures/perpetuals (Binance, Bybit, OKX, etc.).
Strict preset: 1H–4H charts for classic Qullamagi-style trend structure and fewer fake breakouts.
Loose preset: 15m–30m charts for higher trade frequency and more active intraday trading.
Always retune ATR length, box length, volume multiplier and position size for each symbol and exchange.
Strategy Logic (Quick Summary)
Long (Strict): MA stack in bullish alignment with all MAs sloping up → tight volatility box (ATR-based) → volume spike above SMA(volume) × multiplier → breakout above box high (close or intrabar) → optional HTF close above 200-SMA.
Short: Mirror logic: bearish MA stack, tight box, volume spike and breakdown below box low with optional HTF downtrend.
Best Practices for Crypto
Backtest on each symbol and timeframe you plan to autotrade, including commissions and slippage.
Start on higher timeframes (1H/4H) to learn the behavior, then move to 15m–30m if you want more signals.
Use the higher-timeframe filter when markets are strongly trending to reduce counter-trend trades.
Keep position-size percentage conservative until you fully understand the drawdowns.
Forward-test / paper trade before connecting to live futures accounts.
Webhook / Autotrade Integration
Designed to work with TradingView webhooks and external crypto trading bots.
Alert messages include structured fields such as: EVENT=ENTRY / SCALE_OUT / EXIT, SIDE=LONG / SHORT, STRATEGY=Qullamagi_MA.
Map each EVENT + SIDE combination to your bot logic (open long/short, partial close, full close, etc.) on your preferred exchange.
Important Notes & Disclaimer
Crypto markets are highly volatile and can change regime quickly. Backtest and forward-test thoroughly before using real capital. Higher timeframes generally produce cleaner MA structures and fewer fake breakouts.
This strategy is for educational and informational purposes only and does not constitute financial advice. Trading leveraged crypto products involves substantial risk of loss. Always do your own research, manage risk carefully, and never trade with money you cannot afford to lose.

ALN Sessions Box Breakout — Auto- DSTDevoleper: Sheikh Rakib
What it does
This indicator draws session range boxes for Asia (Dhaka), London, and New York using each market’s own local time (DST-aware). After a session closes, it watches for the first close above the session high or below the session low and then marks that breakout once per session with clear chart markers and optional alerts.
Key features
Auto-DST, per-city timezones
London session uses Europe/London
New York session uses America/New_York
Asia session uses Asia/Dhaka
Your chart timezone doesn’t matter—the sessions track real local hours.
Clean range boxes with adjustable opacity and optional outlines.
Session labels that auto-center at the end of each session.
One-shot breakout signals per session:
Triangle up when price closes above the session high.
Triangle down when price closes below the session low.
Built-in alerts for: session starts and each breakout direction.
Inputs
London / New York / Asia (Dhaka)
Show Session: toggle each session on/off
Time Range: default London 08:00–17:00 (local), New York 08:00–17:00 (local), Asia 06:00–15:00 (Dhaka)
Colour: box color for each session
Settings
Show Session Labels
Show Range Outline
Opacity Preset: Dark / Medium / Light
(UTC Offset input is kept for display, not used in session detection.)
Visuals & alerts
Boxes extend from session open to close, continually updating the high/low.
When the session ends, the final high/low are locked in, the label is centered, and the indicator begins monitoring for a breakout.
Alerts
Session start: Asia/London/New York
Breakouts: “High Breakout” (close > high) and “Low Breakout” (close < low) for each session
Create alerts from the TradingView alert dialog and choose the desired alertcondition.
Logic notes (how signals fire)
While a session is open, its box grows to contain all highs/lows.
On the first bar after close, the script starts listening for a breakout:
Close > session high → one up signal (fires once)
Close < session low → one down signal (fires once)
When the next same session begins, internal flags reset and a new box starts—so signals are inherently scoped to the period between that session’s close and its next open.
Tips
Use on intraday timeframes (e.g., 1m–30m) for clearer box structure.
If you only want specific markets, toggle others off for a cleaner chart.
For systematic entries, combine with your trend/volatility filters and use the breakout alerts as triggers or confirmations—this script doesn’t place trades.
Disclaimer: Market timing and risk management are your responsibility. Past session behavior does not guarantee future performance.

Multi Pivot Trend [BigBeluga]🔵 OVERVIEW
The Multi Pivot Trend is an advanced market-structure-driven trend engine that evaluates trend strength by scanning multiple pivot breakouts simultaneously.
Instead of relying on a single swing length, it tracks breakouts across ten increasing pivot lengths — then averages their behavior to produce a smooth, reliable trend reading.
Mitigation logic (close, wick, or HL2 touches) controls how breakouts are confirmed, giving traders institutional-style flexibility similar to BOS/CHoCH validation rules.
This indicator not only colors candles based on trend strength, but also extends trend strength and volatility-scaled projection candles to show where trend pressure may expand next.
Pivot breakout lines and labels mark key changes, making the trend transitions extremely clear.
🔵 CONCEPTS
Market trend strength is reflected by multiple pivot breakouts, not just one.
The indicator analyzes ten pivot structures from smaller to larger swings.
Each bullish or bearish pivot breakout contributes to trend score.
Mitigation options (close / wick / HL2) imitate smart-money breakout confirmation logic.
Trend score is averaged and translated into colors and extension bars.
Neutral regime ≈ weak trend or transition zone (trend compression).
🔵 FEATURES
Multi-Pivot Engine — tracks 10 pivot-based trend signals simultaneously.
Mitigation Modes :
• Close — breakout requires candle close beyond pivot
• Wicks — breakout requires wick violation
• HL2 — breakout confirmed when average (H+L)/2 crosses level
Dynamic Color System :
• Blue → confirmed bullish rotation
• Red → confirmed bearish rotation
• Orange → neutral / transition state
Breakout Visualization — draws pivot breakout lines in real-time.
Trend Labels — prints trend %.
Trend Volatility-Scaled Extension Candles — ATR/trend strength based candle projections show momentum continuation strength.
Gradient Pivot Encoding — higher pivot lengths = deeper structure considered.
🔵 HOW TO USE
Use strong blue/red periods to follow dominant structural trend.
Watch for color transition into orange — possible trend change or consolidation.
Pivot breakout lines help validate structure shifts without clutter.
Wick mitigation catches aggressive liquidity-sweep based breaks.
Close/HL2 mitigation catches cleaner market structure rotations.
Extension bars visualize trend pressure — large extensions = strong push.
Best paired with volume or volatility confirmation tools.
🔵 CONCLUSION
The Multi Pivot Trend is a structural trend recognition system that blends multiple pivot breakouts into one clean trend score — with institutional-style mitigation logic and volatility-projected trend extensions.
It gives traders a powerful, visually intuitive way to track momentum, spot trend rotations early, and understand true structural flow beyond simple MA-based approaches.
Use it to stay aligned with the dominant swing direction while avoiding noise and false flips.

Momentum Breakout Filter + ATR ZonesMomentum Breakout Filter + ATR Zones - User Guide
What This Indicator Does
This indicator helps you with your MACD + volume momentum strategy by:
Filtering out fake breakouts - Shows ⚠️ warnings when breakouts lack confirmation
Showing clear entry signals - 🚀 LONG and 🔻 SHORT labels when all conditions align
Automatic stop loss & profit targets - Based on ATR (Average True Range)
Visual trend confirmation - Background color + EMA alignment
Signal Types
🚀 LONG Entry Signal (Green Label)
Appears when ALL conditions met:
✅ MACD crosses above signal line
✅ Volume > 1.5× average
✅ Price > EMA 9 > EMA 21 > EMA 200 (bullish trend)
✅ Price closes above recent 20-bar high
🔻 SHORT Entry Signal (Red Label)
Appears when ALL conditions met:
✅ MACD crosses below signal line
✅ Volume > 1.5× average
✅ Price < EMA 9 < EMA 21 < EMA 200 (bearish trend)
✅ Price closes below recent 20-bar low
⚠️ FAKE Breakout Warning (Orange Label)
Appears when price breaks high/low BUT lacks confirmation:
❌ Low volume (below 1.5× average), OR
❌ Wick break only (didn't close through level), OR
❌ MACD not aligned with direction
Hover over the warning label to see what's missing!
ATR Stop Loss & Targets
When you get a signal, colored lines automatically appear:
Long Position
Red solid line = Stop Loss (Entry - 1.5×ATR)
Green dashed lines = Profit Targets:
Target 1: Entry + 2×ATR
Target 2: Entry + 3×ATR
Target 3: Entry + 4×ATR
Short Position
Red solid line = Stop Loss (Entry + 1.5×ATR)
Green dashed lines = Profit Targets:
Target 1: Entry - 2×ATR
Target 2: Entry - 3×ATR
Target 3: Entry - 4×ATR
The lines move with each bar until you exit the position.
Chart Elements
Moving Averages
Blue line = EMA 9 (fast)
Orange line = EMA 21 (medium)
White line = EMA 200 (trend filter)
Volume
Yellow bars = High volume (above threshold)
Gray bars = Normal volume
Background Color
Light green = Bullish trend (all EMAs aligned up)
Light red = Bearish trend (all EMAs aligned down)
No color = Neutral/mixed
MACD (Bottom Pane)
Green/Red columns = MACD Histogram
Blue line = MACD Line
Orange line = Signal Line
Info Dashboard (Bottom Right)
ItemWhat It ShowsVolumeCurrent volume vs average (✓ HIGH or ✗ Low)MACDDirection (BULLISH or BEARISH)TrendEMA alignment (BULL, BEAR, or NEUTRAL)ATRCurrent ATR value in dollarsPositionCurrent position (LONG, SHORT, or NONE)R:RRisk-to-Reward ratio (shows when in position)
How To Use It
Basic Workflow
Wait for setup
Watch for MACD to approach signal line
Volume should be building
Price should be near EMA structure
Get confirmation
Wait for 🚀 LONG or 🔻 SHORT label
Check dashboard shows "✓ HIGH" volume
Verify trend is aligned (green or red background)
Enter the trade
Enter when signal appears
Note your stop loss (red line)
Note your targets (green dashed lines)
Manage the trade
Exit at first target for partial profit
Move stop to breakeven
Trail remaining position
What To Avoid
❌ Don't trade when you see:
⚠️ FAKE labels (wait for confirmation)
Neutral background (no clear trend)
"✗ Low" volume in dashboard
MACD and Trend not aligned
Settings You Can Adjust
Volume Sensitivity
High Volume Threshold: Default 1.5×
Increase to 2.0× for cleaner signals (fewer trades)
Decrease to 1.2× for more signals (more trades)
Fake Breakout Filters
You can toggle these ON/OFF:
Volume Confirmation: Requires high volume
Close Through: Requires candle close, not just wick
MACD Alignment: Requires MACD direction match
Tip: Turn all three ON for highest quality signals
ATR Stop/Target Multipliers
Default settings (conservative):
Stop Loss: 1.5×ATR
Target 1: 2×ATR (1.33:1 R:R)
Target 2: 3×ATR (2:1 R:R)
Target 3: 4×ATR (2.67:1 R:R)
Aggressive traders might use:
Stop Loss: 1.0×ATR
Target 1: 2×ATR (2:1 R:R)
Target 2: 4×ATR (4:1 R:R)
Conservative traders might use:
Stop Loss: 2.0×ATR
Target 1: 3×ATR (1.5:1 R:R)
Target 2: 5×ATR (2.5:1 R:R)
Example Trade Scenarios
Scenario 1: Perfect Long Setup ✅
Stock consolidating near EMA 21
MACD curling up toward signal line
Volume bar turns yellow (high volume)
🚀 LONG label appears
Red stop line and green target lines appear
Result: High probability trade
Scenario 2: Fake Breakout Avoided ✅
Price breaks above resistance
Volume is normal (gray bar)
⚠️ FAKE label appears (hover shows "Low volume")
No entry signal
Price falls back below breakout level
Result: Avoided losing trade
Scenario 3: Premature Entry ❌
MACD crosses up
Volume is high
BUT trend is NEUTRAL (no background color)
No signal appears (trend filter blocks it)
Result: Avoided choppy/sideways market
Quick Reference
Entry Checklist
🚀 or 🔻 label on chart
Dashboard shows "✓ HIGH" volume
Dashboard shows aligned MACD + Trend
Colored background (green or red)
ATR lines visible
No ⚠️ FAKE warning
Exit Strategy
Target 1 (2×ATR): Take 50% profit, move stop to breakeven
Target 2 (3×ATR): Take 25% profit, trail stop
Target 3 (4×ATR): Take remaining profit or trail aggressively
Stop Loss: Exit entire position if hit
Alerts
Set up these alerts:
Long Entry: Fires when 🚀 LONG signal appears
Short Entry: Fires when 🔻 SHORT signal appears
Fake Breakout Warning: Fires when ⚠️ appears (optional)
Tips for Success
Use on 5-minute charts for day trading momentum plays
Only trade high volume stocks ($5-20 range works best)
Wait for full confirmation - don't jump early
Respect the stop loss - it's calculated based on volatility
Scale out at targets - don't hold for home runs
Avoid trading first 15 minutes - let market settle
Best during 10am-11am and 2pm-3pm - peak momentum times
Common Questions
Q: Why didn't I get a signal even though MACD crossed?
A: All conditions must be met - check dashboard for what's missing (likely volume or trend alignment)
Q: Can I use this on any timeframe?
A: Yes, but it's designed for 5-15 minute charts. On daily charts, adjust ATR multipliers higher.
Q: The stop loss seems too tight, can I widen it?
A: Yes, increase "Stop Loss (×ATR)" from 1.5 to 2.0 or 2.5 in settings.
Q: I keep seeing FAKE warnings but price keeps going - what gives?
A: The filter is conservative. You can disable some filters in settings, but expect more false signals.
Q: Can I use this for swing trading?
A: Yes, but use larger timeframes (1H or 4H) and adjust ATR multipliers up (3× for stops, 6-9× for targets).

HTF Control Shift + Prev Candle Break Sequence 🧭 HTF Control Shift + Previous Candle Break Sequence
Overview
The HTF Control Shift + Previous Candle Break Sequence indicator identifies high-probability shift candles that suggest a potential change in market control — from sellers to buyers or vice versa — and then tracks whether price confirms that shift by breaking the previous candle’s high or low.
This tool is designed to help traders detect institutional control shifts and confirm them with price structure breaks, providing a framework for spotting early trend reversals or strong continuation moves.
How It Works
Control Shift Candle Detection
A Bullish Control Shift occurs when a candle shows:
A long lower wick (≥ Wick % Threshold of total range).
A close near the high (within Body % Threshold of the top).
A Bearish Control Shift occurs when a candle shows:
A long upper wick (≥ Wick % Threshold of total range).
A close near the low (within Body % Threshold of the bottom).
These candles are highlighted in green (bullish) or red (bearish), and optionally labeled on the chart.
Previous Candle High/Low Tracking
The script automatically plots horizontal lines at the previous candle’s high (green) and low (red).
These act as key reference levels for breakout confirmation.
Breakout Confirmation Sequence
A Bullish Sequence triggers when a Bullish Control Shift candle is followed by a break above the previous candle’s high.
A Bearish Sequence triggers when a Bearish Control Shift candle is followed by a break below the previous candle’s low.
When either sequence completes, the indicator can send a TradingView alert confirming the directional breakout.
How to Use
Timeframe:
Optimized for higher timeframes (1H, 4H, Daily) to filter out intraday noise and identify structural market shifts.
Trend Reversal Identification:
Watch for Control Shift candles at major highs/lows, order blocks, or liquidity zones — a confirmed breakout often signals a trend reversal or new directional push.
Continuation Confirmation:
In trending markets, a Control Shift candle that breaks in the direction of trend can validate a strong continuation setup.
Alert Usage:
Set alerts for:
Bullish Control Shift Confirmed Breakout
Bearish Control Shift Confirmed Breakdown
Optional: raw Control Shift or Break alerts.
Customization
Wick % Threshold: Adjusts the required wick size to define a control shift.
Body % Threshold: Controls how close the close must be to the high/low for confirmation.
Label Toggle: Optionally display labels only on control shift candles.
Best Practices
Combine with higher-timeframe trend filters.
Avoid using it alone in tight consolidation zones.
Strongest signals occur when:
Control Shift appears at key structure levels.
The breakout bar closes firmly beyond the previous high/low.
Volume supports the breakout.
Summary
✅ Detects when market control flips (buyers ↔ sellers).
✅ Confirms shift with breakout above/below previous candle.
✅ Ideal for 1H–4H swing or position trading.
✅ Provides visual, structural, and alert-based confirmation.
