Ichimoku all signalsIchimoku Cloud All Signals!
This indicator shows all Ichimoku Cloud signals for (entering/exiting/confirming/or even staying) in a position.
you can choose a signal related to your strategy and use it.
you can choose which signals to be shown on the chart by changing the settings.
here are some examples of signals that you can get from this indicator:
Crossover/under conversion line & base line
Crossover/under lead line1 & lead line2
Crossover/under conversion line & lead line1
Crossover/under base line & lead line1
Crossover/under conversion line & lead line2
Crossover/under base line & lead line2
Crossover/under close & base line
Cloud Breakouts in both directions!
and 74 signals more !!!!
Cari dalam skrip untuk "breakout"

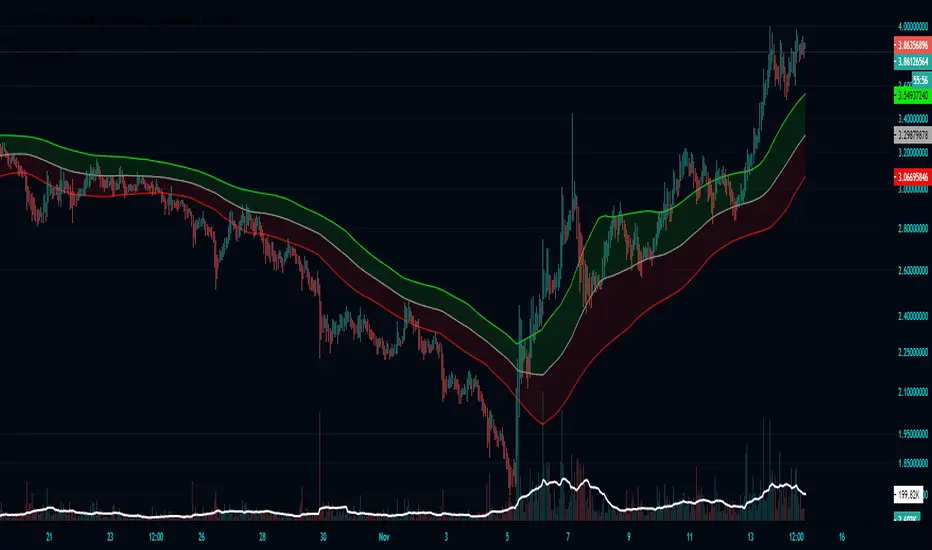
Finnie's HL BREAKOUTFirst the indicators takes a range, by default it is 22 candles, then finds the highest and lowest points of said range. At this point your left with lines that follow your support and resistance in the given range (take a look by change the 100 ema in settings to 1). To take things a step further I took a 100 candle ema of the highest highest and lowest lows to not only smooth things out, but also to provide visual ques for breakouts, when closing price is above the top band the asset is considered to be breaking out.
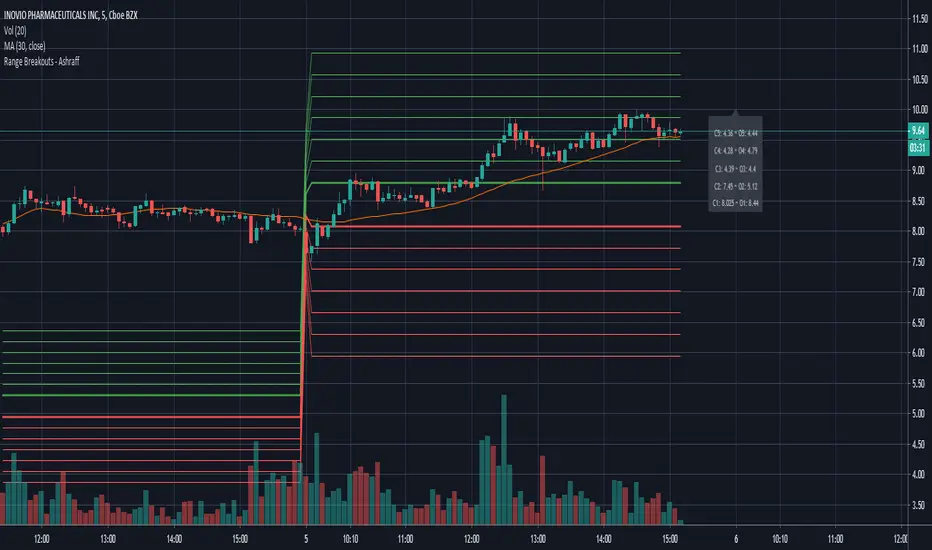
Range Breakouts - AshraffThis computes the Range Breakout strategy based on the last five days of stock data.
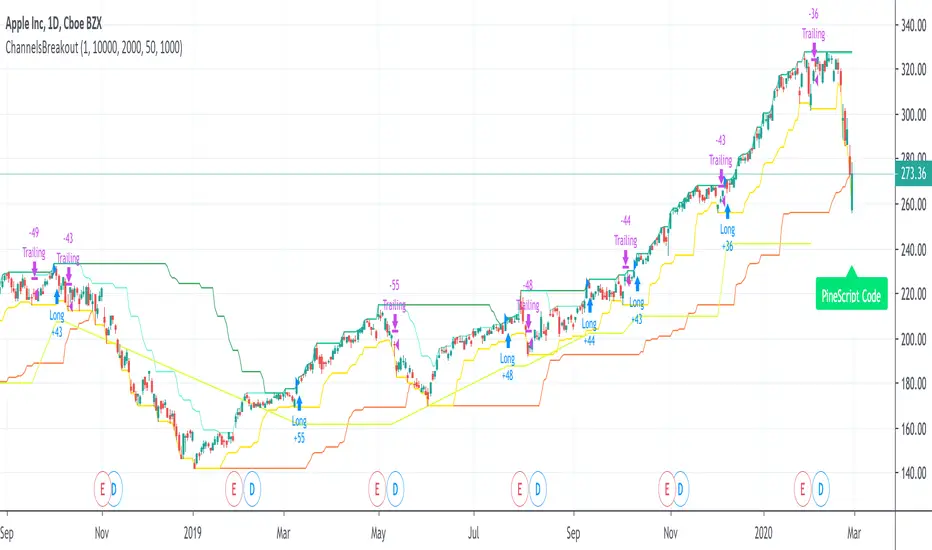
ChannelsBreakoutThis script allows you to intercept price channel breakouts (Donchian channel) in a bullish perspective. Applicable both on Equities/ETFs and on Futures (Index Futures).
We open a position when closes crosses the upper channel. The trade ends with a trailing associated with a fast lower Donchian or a monetary stop loss.
It is an educational code and does not constitute a solicitation for public savings.

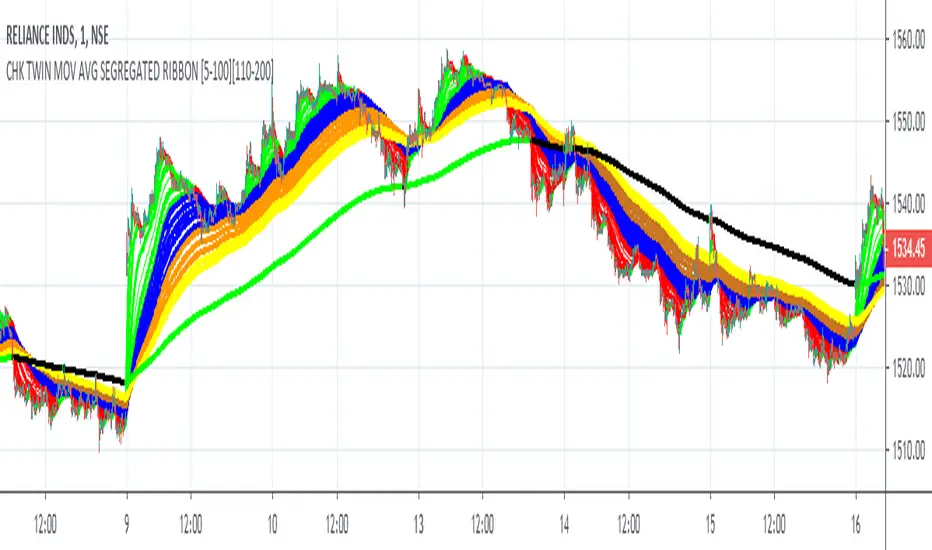
FALSE BREAKOUT NO PROBLEM !! CHK TWIN MOV AVG SEGREGATED RIBBON PROBLEM DEFINITION 1 : To Avoid False Breakouts
PROBLEM DEFINITION 2 : To Ascertain if the trend has changed when a Stock opens with a Gap up or Gap Down
## PROBABLE SOLUTION : Use a Moving Average with lot of latency
## PROBLEM WITH ABOVE SOLUTION : Misses on lot of trades, Late exits leads to drain on winning trades
S O L U T I O N
An Indicator which plots two different types of Moving Averages at the same time
For the MA length 5-100 a fast plot of choice
For the MA Length 110-200 a plot with a lag to ascertain the trend
And then ONE LAST MAN STANDING with even bigger MA length for a lagging indicator to save the day
This indicator gives one 9X9 = 81 Permutation Combinations to look at the markets
One can devise strategies basis if one particular MA Type has crossed another MA Type
Feel free to post the strategies you have come out with!
//// CREDITS AND ACKNOWLEDGEMENTS //////////////////////////////////////////////////////////////////
Following contributors helped the author ::
Credits to Neobutane for his Multiple Type Mov. Avg. Guppy at ......
hxxps://www.tradingview.c0m/script/UQAv1U0c-MA-Study-Different-Types-and-More-NeoButane/
Credits to Jose5770 for sharing Jurik MA code at .....
hxxps://www.tradingview.c0m/script/uqYvkHna-Trend-Direction-Force-Index/
Appreciate and Thank You for sharing your work.
//////////////////////////////////////////////////////////////////////////////////////////////////////
P.S You might notice in the code that the few plots are skipped. It is done to fasten the indicator without compromising
on the functionality
ATR-ranged Donch on 15min// This is a simple Mean Reversion & Breakout Indicator.
// A Donchian Channel is plotted. A threshold equal to 0.25 of Daily ATR.
// If price reverses from this threshold, then it can be taken as possible Mean Reversion.
// If price crosses the previous Donchian levels, it can be taken as a possible breakout.
// Typical of such strategy is the whipsaw effect when price movement is just flat.
// I have marked the region where the lower and higher thresholds are closer to be an indicative of whipsaw.
// But it is not really effective to avoid whipsaw.

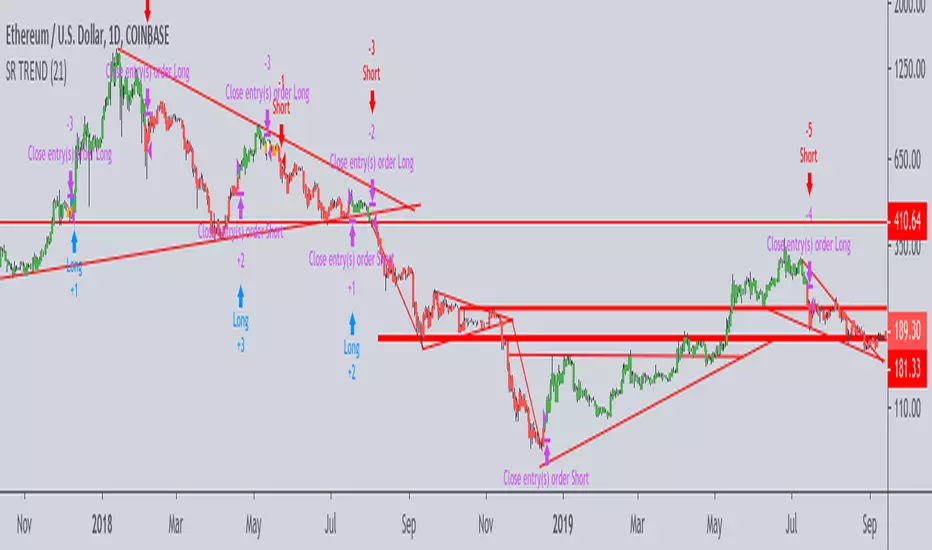
Support-Resistance breakoutStrategy based on longing resistance breakout and shorting support breakout.
It defines highs and lows using fractal with 2 bars for confirming high/lows. So it has 2 bars lag.
It calculates the difference between sma with defined length (21 by default) of highs and of lows and uses it as alt SR level. This idea I took from synapticEx's indicator Nebula-Advanced-Dynamic-Support-Resistance.
Position enter is the breakout of SR, defined by fractals.
Position exit is: bar change in opposite to position direction > difference is sma of highs and of lows.
Volume w/ Threshold and Editable MA PeriodJust a simple script that tweaks the original Volume one.
The purpose is creating a threshold which we'll use to put an alert on. This way, we can be notified whether Volume pumps.
Useful for spotting breakouts, breakdowns and pumps.
Threshold is simply a coeff * ma(volume,period). Coeff is editable as well.
Hope this helps!

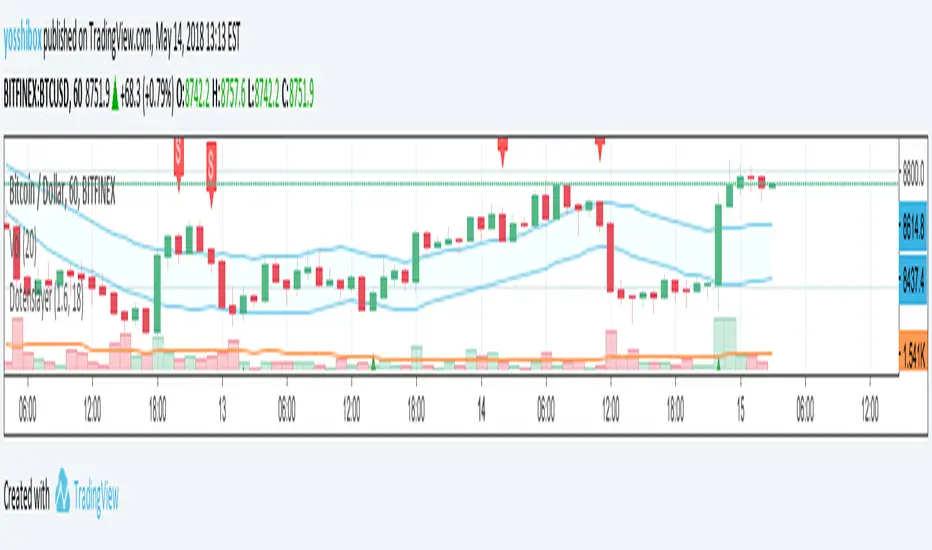
Dotenslayer : An open range breakouts method indicator for botThis script shows the long and short points of certain Japanese bots like 'DotenKun' which use open range breakouts method.
Searching recent 18 bars as default and shows the range calculated with a factor (default k = 1.6). You can edit this condition by yourself.
When filled the long or short conditions, also shows the indicator on the price chart to help your trading on BTC.
Also, this script can make alarm events related to those conditions.
This script only works for BTCUSD, XBTUSD, BTCJPY, FXBTCJPY with 1H time span.
Disclaimer :
I don't own the source code of the certain bots and I didn't directly reference the source code of it.
So which means, I don't guarantee this script works as same as the bots works.
Also, I didn't mean to disturb their trading bot businesses.
Your donations are welcome! :
BTC : 327MqYGfHJFC7LRijGwQZXdTAyFwvYCzyv
ETH : 0x5E270c3667E65ba6158D292a98c5b54F81AfCAf1
Auto AVWAP (Anchored-VWAP) with Breakout Screener_v2Updated indicator for AWAP breakout. The indicator identified the candle that breaks out of AVWAP

Engulfing & Pin Bar Breakout StrategyOverview
This strategy automates a classic, powerful trading methodology based on identifying key candlestick reversal patterns and trading the subsequent price breakout. It is designed to be a complete, "set-and-go" system with built-in risk and position size management.
The core logic operates on the 1-Hour timeframe, scanning for four distinct high-probability reversal signals: two bullish and two bearish. An entry is only triggered when the market confirms the signal by breaking a key price level, aiming to capture momentum following a potential shift in market sentiment.
The Strategy Logic
The system is composed of two distinct modules: Bullish (Long) and Bearish (Short).
🐂 Bullish (Long) Setup
The script initiates a long trade based on the following strict criteria:
Signal: Identifies either a Hammer or a Bullish Engulfing pattern. These patterns often indicate that sellers are losing control and buyers are stepping in.
Confirmation: Waits for the very next candle after the signal.
Entry Trigger: A long position is automatically opened as soon as the price breaks above the high of the signal candle.
Stop Loss: Immediately set just below the low of the signal candle.
Take Profit: A fixed target is placed at a 1:5 Risk/Reward Ratio.
🐻 Bearish (Short) Setup
The script initiates a short trade based on the following strict criteria:
Signal: Identifies either a Shooting Star or a Bearish Engulfing pattern. These patterns suggest buying pressure is fading and sellers are taking over.
Confirmation: Waits for the very next candle after the signal.
Entry Trigger: A short position is automatically opened as soon as the price breaks below the low of the signal candle.
Stop Loss: Immediately set just above the high of the signal candle.
Take Profit: A fixed target is placed at a 1:4 Risk/Reward Ratio.
Key Feature: Automated Risk Management
This strategy is designed for disciplined trading. You do not need to calculate position sizes manually.
Fixed Risk: The script automatically calculates the correct position size to risk exactly 2% of your total account equity on every single trade.
Dynamic Sizing: The position size will adjust based on the distance between your entry price and your stop loss for each specific setup, ensuring a consistent risk profile.
How To Use
Apply the script to your chosen chart (e.g., BTC/USD).
Crucially, set your chart's timeframe to 1-Hour (H1). The strategy is specifically calibrated for this interval.
Navigate to the "Strategy Tester" tab below your chart to view backtest results, including net profit, win rate, and individual trades.
Disclaimer: This script is provided for educational and informational purposes only. It is not financial advice. All trading involves substantial risk, and past performance is not indicative of future results. Please use this tool responsibly and at your own risk.

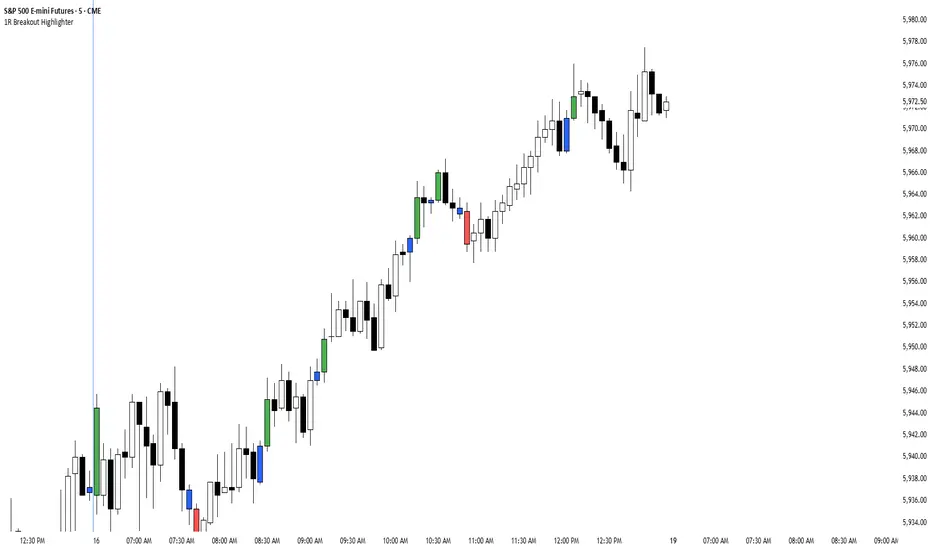
1R Breakout Highlighter1R Breakout. This indicator measures every bar and highlights any bar that is greater than the previous bar by more than 1R.
Chews Opening Range Breakout - FibonacciVisual tool for taking a Fibonacci retracement-backed opening range breakout.
How it works:
Short a first red candle. Long a first green candle.
You decide which Fibonacci % you prefer your stop loss to be, the plot and label will represent your decision.
Fibonacci logic is close --> open.
Recommendations:
Use a lower time frame interval like 3m.
Extra Notes:
On higher priced stocks, you may see some discrepancy (~$0.1!) when plotting a Fibonacci Retracement compared to the suggested stop loss.
Since this discrepancy happens on inherently more volatile stocks, I have chosen to neglect the discrepancy instead of going for point perfect stop loss exits.
Realistically, it won't matter unless you get very unlucky.
Fibonacci drawing is not a feature of what this indicator plots. It's there for reference, but I can add if requested.
I drafted this simple code to help me visualize automating this strategy.
"That's spoicy!"
ToDo: Add an optional two-sided ORB. Higher chance of success since it is meant for reversals.

Pivot-Based Channels & Bands [Misu]█ This Indicator is based on Pivot detection to show bands and channels.
The pivot price is similar to a resistance or support level. If the pivot level is breached, the price should continue in that direction. Or the price could reverse at or near this level.
█ Usages:
Use channels as a support & resistance zone.
Use bands as a support & resistance zone. It is also very powerfull to use it as a breakout.
Use mid bands & mid channels as a trend direction or trade filter as a more usual moving average.
█ Parameters:
Show Pivot Bands: show bands.
Show Pivot Mid Band: show mid bands.
Show Pivot Channels: show channels.
Show Pivot Mid Channel: show mid channels.
Deviation: deviation used to calculate pivot points.
Depth: depth used to calculate pivot points.

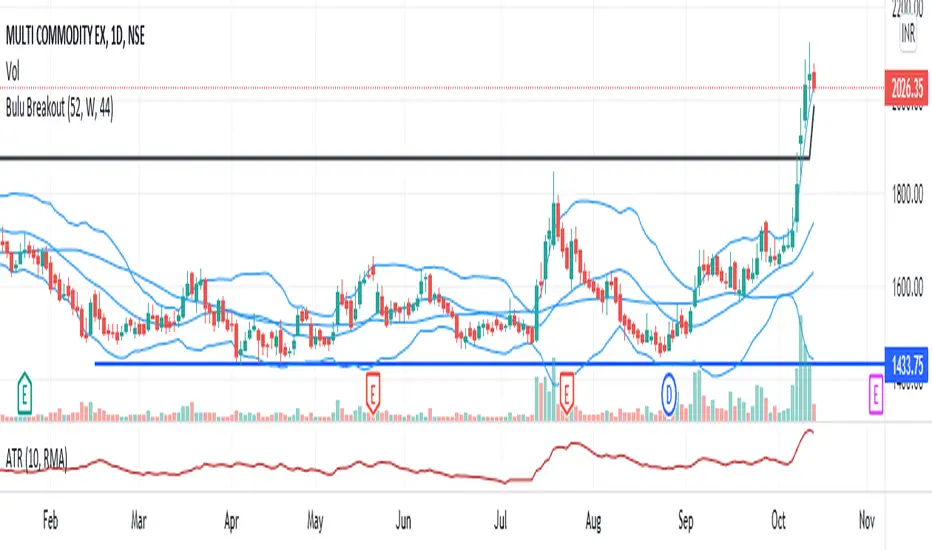
Bulu BreakoutI designed this indicator to trade 52 weeks high breakout. It tests three conditions 1)close above 52weeks high 2)close above upper Bollinger band 3) adx <30. any candle that satisfies all these condition will change its color to black. i also added 44sma to this script to find high probable trade. if the black candle is near 44 sma it is more reliable.
[KL] Double Bollinger Bands Strategy (for Crypto/FOREX)This strategy uses a setup consisting of two Bollinger Bands based on the 20 period 20-SMA +/-
(a) upper/lower bands of two standard deviations apart, and
(b) upper/lower bands of one standard deviation apart.
We consider price at +/- one standard deviation apart from 20-SMA as the "Neutral Zone".
If price closes above Neutral Zone after a period of consolidation, then it's an opportunity for entry. Strategy will long, anticipating for breakout.
The illustration below shows price closing above the Neutral Zone after a period of consolidation.
a.c-dn.net
Position is exited when prices closes at Neutral Zone (being lower than prior bars)

Cup & Handle (Zeiierman)█ Overview
Cup & Handle (Zeiierman) is a classic continuation-pattern scanner that detects both bullish Cup+Handle and bearish Inverted Cup+Handle structures using a compact pivot stream. It’s designed to highlight rounded reversals back to a “rim” level, followed by a smaller pullback (“handle”) before a potential continuation move.
⚪ What It Detects
A Cup & Handle (Bull) forms when price makes a rounded decline from a left rim, bottoms, then climbs back to a similar right rim. After returning to the rim, price forms a handle (a smaller pullback) that stays within an allowed retracement range. This pattern often precedes a bullish continuation attempt.
An Inverted Cup & Handle (Bear) is the mirrored version. Price makes a rounded rise to a left rim, tops, then declines back to a similar right rim. After returning to that rim, price forms a handle (a smaller bounce) that stays within the allowed retracement range. This pattern often precedes a bearish continuation attempt.
█ How It Works
⚪ 1) Pivot Extraction (Swing Compression)
The script first converts raw candles into a small set of meaningful swing pivots using ta.pivothigh() and ta.pivotlow() with Pivot span. A pivot is accepted only after it is confirmed by the lookback window, which helps reduce noise.
Key effect:
Higher Pivot span = fewer, stronger pivots (cleaner patterns)
Lower Pivot span = more pivots (more patterns, more noise)
⚪ 2) Pattern Framing (4-Point Structure)
When at least four pivots exist, the script maps them into a fixed sequence:
For a bull Cup+Handle sequence: High → Low → High → Low
These are treated as:
L = left rim pivot
B = cup bottom pivot
R = right rim pivot
H = handle pivot
For a bear inverted Cup+Handle sequence: Low → High → Low → High
Mapped similarly, but inverted.
This “4-pivot” structure is the minimum shape needed to define a cup and a handle without overfitting.
⚪ 3) Rim Similarity Filter (Cup Quality Control)
The script checks if the left rim and right rim are close enough to be considered a proper cup rim:
Rim similarity tolerance (%) controls this.
Lower tolerance = only very clean symmetric rims
Higher tolerance = allows uneven rims (more detections)
⚪ 4) Handle Depth Filter (Reject Weak or Messy Handles)
The handle is validated by measuring how deep it retraces relative to the cup depth:
Handle Retraction = |rim − handle| / |rim − bottom|
The handle must fall between:
Handle retrace min
Handle retrace max
This prevents:
tiny “non-handle” wiggles (too shallow)
deep pullbacks that break the structure (too deep)
█ How to Use
⚪ Interpreting a Bull Cup & Handle
Treat it like a continuation setup built around a key breakout level:
Cup forms
Handle forms
Breakout happens above this level
Once price returns to this breakout zone and the handle stays controlled, the structure may attempt to continue upward.
Common behaviors after a clean signal:
Push above the breakout level
Brief retest/acceptance near the breakout zone
Continuation toward the projected target if momentum holds
⚪ Interpreting a Bear Inverted Cup & Handle
Treat it like a bearish continuation/rollover setup built around the same breakout concept:
Cup forms (inverted)
Handle forms
Breakout happens below this level
Once price returns to this breakout zone and the handle stays controlled, the structure may attempt to continue downward.
Common behaviors after a clean signal:
Drop below the breakout level
Retest from underneath
Continuation toward the projected target if selling pressure persists
█ Settings
Pivot span – pivot sensitivity. Higher = smoother pivots, fewer signals. Lower = more pivots, more signals/noise.
Rim similarity tolerance (%) – rim quality filter. Lower = stricter symmetry, higher = more permissive detection.
Handle retrace min – minimum handle depth (filters weak handles).
Handle retrace max – maximum handle depth (filters messy/deep handles).
Invalidation (handle max retrace %) – “maximum tolerated damage” for handle move before the structure is considered broken.
Require breakout confirmation – only trigger when price closes beyond the rim in the expected direction.
Target multiplier (× cup depth) – scales how far the projection target is. Lower = closer targets; 1.0 = classic depth target.
-----------------
Disclaimer
The content provided in my scripts, indicators, ideas, algorithms, and systems is for educational and informational purposes only. It does not constitute financial advice, investment recommendations, or a solicitation to buy or sell any financial instruments. I will not accept liability for any loss or damage, including without limitation any loss of profit, which may arise directly or indirectly from the use of or reliance on such information.
All investments involve risk, and the past performance of a security, industry, sector, market, financial product, trading strategy, backtest, or individual's trading does not guarantee future results or returns. Investors are fully responsible for any investment decisions they make. Such decisions should be based solely on an evaluation of their financial circumstances, investment objectives, risk tolerance, and liquidity needs.

ORB 369 - Opening Range Breakout The ORB 369 is a professional-grade momentum indicator designed to capture the volatility of the New York market open. While many Opening Range Breakout (ORB) scripts simply draw lines, this script integrates time-segmented price action with Supply and Demand (S/D) theory to filter out "fakeouts" and identify high-probability institutional entries.
💡 The Core Concept: Why 3-6-9?
The strategy is rooted in the "Market Open Volatility" principle. The first 15 minutes (9:30–9:45 AM EST) represent the period where institutional orders are processed and "price discovery" is most aggressive.
The Range: We define the 15-minute high and low as the "Battlefield."
The 369 Logic: This script focuses on the 3rd 5-minute candle of the session (completing the 15m range) and monitors the subsequent 5m and 15m cycles for a definitive trend shift.
🛠️ How It Works
The script utilizes Pine Script v6 high-precision time-tracking and state-handling to ensure accuracy even on historical data.
1. Dynamic Session Anchoring
Unlike static indicators, this script uses America/New_York timezone anchoring. It identifies the Opening Range (OR) regardless of your local time, ensuring you are aligned with the NYSE floor traders.
2. Supply & Demand Detection
The script doesn't just look at the high/low; it analyzes the micro-structure within that 15-minute window.
It identifies unmitigated zones (areas where price moved so fast it left "imbalances").
If a breakout occurs but price immediately hits an internal S/D zone, it warns the trader of a potential "Look Above and Fail" scenario.
3. Breakout Confirmation (5m Logic)
A common mistake is entering on a "wick." This script uses Closing Logic:
Bullish Signal: A 5-minute candle must close entirely above the 15m High.
Bearish Signal: A 5-minute candle must close entirely below the 15m Low.
The script then repaints the candle body (defaulting to Blue/Red) to provide an instant visual cue that the "Breakout is Confirmed."
📈 How to Use It
Wait for the Box: At 9:45 AM EST, the script will automatically lock in the High, Low, and Midpoint (Mean) of the range.
Monitor the Midpoint: The Midpoint acts as the "Line in the Sand." If a breakout occurs but price stays near the Midpoint, the trend is weak. If price stays in the upper half of the range, the Bullish bias is stronger.
The Entry: Wait for the Candle Color Change. A blue candle above the range suggests a long entry; a red candle below suggests a short.
Supply/Demand Zones: If the script highlights a "Demand Zone" at the bottom of the range and price bounces off it before breaking the top, this provides a "double-confluence" setup.
⚙️ Technical Features
Customizable Aesthetics: Use the Settings menu to change the breakout colors (Green/Blue/Red) to match your personal chart theme.
Smart Tooltips: Hover over the inputs in the settings to see detailed explanations of what each parameter does.
Alert Ready: Built-in alerts for "Bullish Breakout" and "Bearish Breakout" that can be sent directly to your phone or desktop via TradingView.

Scalp Breakout Predictor Pro - by Herman Sangivera (Papua)Scalp Breakout Predictor Pro by Herman Sangivera ( Papuan Trader )
Overview
The Scalp Breakout Predictor Pro is a high-performance technical indicator designed for scalpers and day traders who thrive on market volatility. This tool specializes in identifying "Squeeze" phases—periods where the market is consolidating sideways—and predicts the likely direction of the upcoming breakout using underlying momentum accumulation.
How It Works
The indicator combines three core mathematical concepts to ensure "Safe but Fast" entries:
Squeeze Detection (BB vs. KC): It monitors the relationship between Bollinger Bands and Keltner Channels. When Bollinger Bands contract inside the Keltner Channels, the market is in a "Squeeze" (represented by the gray background). This indicates that energy is being coiled for a massive move.
Momentum Accumulation (Pre-Signal): While the price is still moving sideways, the script analyzes linear regression momentum.
PRE-BULL: Momentum is building upwards despite price being flat.
PRE-BEAR: Momentum is fading downwards despite price being flat.
Breakout Confirmation: An entry signal is only triggered when the Squeeze "fires" (the price breaks out of the bands), ensuring you don't get stuck in a dead market for too long.
Key Features
Real-time Prediction Labels: Get early warnings (PRE-BULL / PRE-BEAR) to prepare for the trade before it happens.
Dynamic TP/SL Lines: Automatically calculates Take Profit and Stop Loss levels based on the Average True Range (ATR), adapting to the current market's "breath."
On-Screen Dashboard: A sleek table in the top-right corner displays the current market phase (Squeeze vs. Volatile), the predicted next move, and the current ATR value.
Pine Script V6 Optimized: Built using the latest version of TradingView’s coding language for maximum speed and compatibility.
Trading Rules
Preparation: When you see a Gray Background, the market is sideways. Watch the Dashboard for the "Potential" direction.
Anticipation: If a PRE-BULL or PRE-BEAR label appears, get ready to enter.
Execution: Enter the trade when the ENTRY BUY (Lime Triangle) or ENTRY SELL (Red Triangle) signal appears.
Exit: Follow the Green Line for Take Profit and the Red Line for Stop Loss.
Technical Settings
HMA Length: Adjusts the sensitivity of the trend filter (Hull Moving Average).
TP/SL Multipliers: Allows you to customize your Risk:Reward ratio based on ATR volatility.
Squeeze Length: Determines the lookback period for consolidation detection.
Disclaimer: Scalping involves high risk. Always test this indicator on a demo account before using it with live capital.

FractalMod for TV with breakout alertsFractalsMod (MT4 → Pine) is a TradingView indicator converted from a custom MT4 (MQL4) fractal indicator.
This script replicates the behavior of the original MT4 version as closely as possible, including:
Confirmation-based fractals using left/right bar logic
Persistent horizontal levels derived from confirmed fractals
MT4-style “buffer-like” behavior using segmented horizontal lines
Key Features
MT4-compatible fractal logic
Uses leftbars and rightbars to confirm fractal highs/lows, equivalent to MT4 custom fractal indicators.
Segmented horizontal lines (MT4 buffer style)
Each confirmed fractal starts a new horizontal line segment from the original pivot bar.
When a new fractal is confirmed, the previous segment is stopped at the new pivot point, closely mimicking MT4 indicator buffers.
Latest fractal tracking
The most recently confirmed Up/Down fractal levels are tracked internally and used for breakout detection.
Breakout alerts (not confirmation alerts)
Alerts are triggered when the current price breaks above the latest Up fractal or below the latest Down fractal.
Breakout detection can be configured to use:
Close price only (confirmation-based), or
High/Low including wicks.
Clean visual control
Single arrow per confirmed fractal (no duplicate markers)
Optional display of fractal markers and horizontal lines
Custom colors and line width for Up/Down fractals
Typical Use Cases
Fractal-based support / resistance visualization
Breakout trading using the most recent confirmed fractal levels
MT4 → TradingView workflow migration while preserving indicator behavior
This script is designed for traders familiar with MT4 fractal indicators who want a faithful and practical TradingView equivalent without repainting on confirmed signals.
FractalsMod (MT4 → Pine) は、
MT4(MQL4)で使用されていた カスタム Fractal インジケーターを TradingView(Pine Script)へ移植したものです。
元の MT4 インジケーターの挙動を可能な限り忠実に再現することを目的としており、以下の特徴を持ちます。
主な特徴
MT4互換のフラクタル判定ロジック
leftbars / rightbars を用いたフラクタル確定方式で、
MT4 のカスタム Fractal インジケーターと同等の確定条件を再現しています。
MT4のバッファ挙動を再現した水平ライン
フラクタルが確定すると、その ピボット位置から水平ラインを開始します。
新しいフラクタルが確定した場合、それまでのラインは新しいピボット位置で停止し、
区間ごとのライン構造で MT4 のバッファ表示に近い見た目を実現しています。
最新フラクタル価格の内部保持
直近で確定した Up / Down フラクタル価格を保持し、
ブレイク判定やアラートに利用します。
ブレイク専用アラート(確定時アラートなし)
フラクタル確定時ではなく、
価格が最新の Up フラクタルを上抜けたとき
価格が最新の Down フラクタルを下抜けたとき
にアラートを出す設計です。
ブレイク判定は
終値ベース(ダマシを減らす)
ヒゲ込み(高値 / 安値)
を設定で切り替えられます。
視認性と制御性を重視した設計
フラクタル矢印は 確定時に1本のみ表示(重複なし)
Up / Down で色分けされたラインと矢印
ライン表示・矢印表示の ON / OFF 切り替え可能
想定される用途
フラクタルを用いた サポート / レジスタンスの可視化
直近フラクタルを基準とした ブレイクアウト戦略
MT4 から TradingView への移行時に、
ロジックと見た目をできるだけ変えずに使いたい場合
本スクリプトは、
MT4のフラクタル系インジケーターに慣れたトレーダーが、
TradingViewでも違和感なく使えることを重視して設計されています。

Momentum & Breakout Confirmationwatch momentum build in real time on the current candle so you can confirm weather a breakout is indeed a breakout or will be a fake out. This is what it does
This is a Momentum & Breakout Confirmation (MBC) indicator that analyzes the current candle in real-time to determine if it's a strong continuation move or possible reversal. Here's the breakdown:
What It Measures:
Momentum Strength - How much % the candle moved:
STRONG = >0.5% move
MEDIUM = 0.2-0.5%
WEAK = <0.2%
Direction - Simply bullish (green candle) or bearish (red candle)
Four Confirmation Factors:
Volume Surge - Is volume 1.5x above the 20-period average?
Move Size - Is the candle body larger than 0.5x ATR (significant)?
Body Strength - Is the body >60% of total candle range (strong conviction, minimal wicks)?
Trend Aligned - Does it align with 9/21 MA trend direction?
The Scoring System:
Adds 1 point for each confirmation factor met (max 4 points)
3-4 points = "STRONG CONTINUATION" 🚀
2 points = "LIKELY CONTINUATION"
1 point = "WEAK SIGNAL"
0 points = "POSSIBLE REVERSAL" ⚠️
Key Difference from TPC:
TPC uses multi-timeframe SuperTrend for strategic entries
MBC focuses on the current candle only - it's asking "Is THIS candle showing real momentum or is it weak/fake?"
Practical Use:
Great for confirming if a breakout or move is "real" with strong conviction behind it, or if it's low-volume/weak-bodied and likely to fail. The table updates live so you can watch momentum build during the candle formation.
Hope it helps. if you guys have any ideas for any indicators you want made please feel free to dm me as i like a good challenge lol ill sit here and try to code anything now im not saying i will be 100 percent successful but i will try for you, thanks for all the support from all you guys i def do appreciate it.
