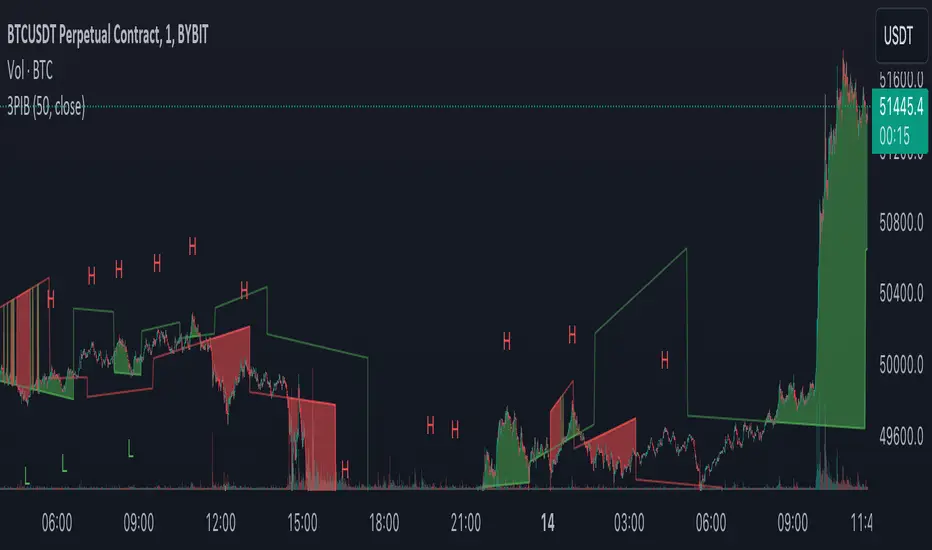
3 Pivots Interpolation BreakoutsI designed the '3 Pivots Interpolation Breakouts' indicator to intuitively identify breakout opportunities using pivot points. This tool stems from my need to anticipate market direction and capitalize on breakouts. It uses a line interpolated from three pivot highs or lows to forecast upcoming breakouts. This offers a straightforward way to visualize potential bullish and bearish breakouts with color-coded extrapolations. The aim is to simplify breakout detection, enhancing your trading strategy with precise, actionable insights.
Cari dalam skrip untuk "breakout"
Range Breakout Statistics [Honestcowboy]⯁ Overview
The Range Breakout Statistics uses a very simple system to detect ranges/consolidating markets. The principle is simple, it looks for areas where the slope of a moving average is flat compared to past values. If the moving average is flat for X amount of bars that's a range and it will draw a box.
The statistics part of the script is a bit more complicated. The aim of this script is to expand analysis of trading signals in a different way than a regular backtest. It also highlights the polyline tool, one of my favorite drawing tools on the tradingview platform.
⯁ Statistics Methods
The script has 2 different modes of analyzing a trading signals strength/robustness. It will do that for 2 signals native to the script.
Upper breakout: first price breakout at top of box, before max bars (100 bars by default)
Lower breakout: first price breakout at bottom of box, before max bars
The analysis methods themselves are straightforward and it should be possible for tradingview community to expand this type of analysis to other trading signals. This script is a demo for this analysis, yet some might still find the native signals helpful in their trading, that's why the script includes alerts for the 2 native signals. I've also added a setting to disable any data gathering, which makes script run faster if you want to automate it.
For both of the analysis methods it uses the same data, just with different calculations and drawing methods. The data set is all past price action reactions to the signals saved in a matrix. Below a chart for explaining this visually.
⯁ Method 1: Averages Projection
The idea behind this is that just showing all price action that happened after signal does not give actionable insights. It's more a spaghetti jumble mess of price action lines. So instead the script averages the data out using 3 different approaches, all selectable in the settings menu.
Geometric Average: useful as it accurately reflects compound returns over time, smoothing out the impact of large gains or losses. Accounts for volatility drift.
Arithmetic Average: a standard average calculation, can be misleading in trading due to volatility drift. It is the most basic form of averaging so I included it.
Median: useful as any big volatility huge moves after a signal does not really impact the mean as it's just the middle value of all values.
These averages are the 2 lines you will find in the middle of the projection. Having a clear difference between a lower break average and upper break average price reaction can signal significance of the trading signal instead of pure chaos.
Outside of this I also included calculations for the maximum and minimum values in the dataset. This is useful for seeing price reactions range to the signal, showing extreme losses or wins are possible. For this range I also included 2 matrices of highs and lows data. This makes it possible to draw a band between the range based on closing price and the one using high/low data.
Below is a visualisation of how the averages data is shown on chart.
⯁ Method 2: Equity Simulation
This method will feel closer to home for traders as it more closely resembles a backtest. It does not include any commissions however and also is just a visualisation of price reaction to a signal. This method will simulate what would happen if you would buy at the breakout point and hold the trade for X amount of bars. With 0 being sell at same bar close. To test robustness I've given the option to visualise Equity simulation not just for 1 simulation but a bunch of simulations.
On default settings it will draw the simulations for 0 bars holding all the way to 10 bars holding. The idea behind it is to check how stable the effect is, to have further confirmation of the significance of the signal. If price simulation line moves up on average for 0 bars all the way to 10 bars holding time that means the signal is steady.
Below is a visualisation of the Equity Simulation.
⯁ Signal filtering
For the boxes themselves where breakouts come from I've included a simple filter based on the size of the box in ATR or %. This will filter out all the boxes that are larger top to bottom than the ATR or % value you setup.
⯁ Coloring of Script
The script includes 5 color themes. There are no color settings or other visual settings in the script, the script themes are simple and always have colors that work well together. Equity simulation uses a gradient based on lightness to color the different lines so it's easier to differentiate them while still upper breaks having a different color than lower breaks.
This script is not created to be used in conjunction with other scripts, it will force you into a background color that matches the theme. It's purpose is a research tool for systematic trading, to analyse signals in more depth.
Metaverse color theme:
⯁ Conclusion
I hope this script will help traders get a deeper understanding of how different assets react to their assets. It should be possible to convert this script into other signals if you know how to code on the platform. It is my intention to make more publications that include this type of analysis. It is especially useful when dealing with signals that do not happen often enough, so a regular backtest is not enough to test their significance.

Breakout Support & Resistance SwiftEdgeBreakout Support & Resistance
The Breakout is a technical analysis tool designed to identify breakout opportunities in the market by detecting price movements through support and resistance levels. It plots potential entry points, stop-loss (SL), and take-profit (TP) levels based on user-defined percentages, helping traders visualize breakout setups on their charts.
How It Works
Support and Resistance Detection: The indicator uses pivot points to identify support and resistance levels over a user-defined lookback period.
Breakout Identification: A breakout is confirmed when the price crosses above a resistance level (bullish) or below a support level (bearish) and remains there for a specified number of bars.
Entry, SL, and TP Levels: Upon a confirmed breakout, the indicator sets an entry point at the closing price and calculates SL, TP1, and TP2 levels based on user-defined percentages.
Directional Filtering: To avoid conflicting signals, the indicator filters breakouts based on the current trade direction. A new entry in the opposite direction is only set if the price moves a user-defined percentage away from the previous entry or if the previous trade hits its SL, TP1, or TP2.
Visuals: The indicator plots support and resistance lines, breakout labels, and entry/SL/TP levels on the chart. Users can choose to display only the latest entry or up to 5 recent entries.
Features
Customizable Settings: Adjust the lookback period for pivot points, breakout confirmation bars, SL/TP percentages, and more.
Directional Change Control: A direction change is indicated when the price moves significantly in the opposite direction, helping to manage trend reversals.
Multiple Entry Display: Option to show up to 5 recent entries for tracking multiple breakouts.
Alerts: Receive alerts when a breakout is confirmed, including entry, SL, TP1, and TP2 levels.
Settings
Pivot Lookback Length: Number of bars to look back for identifying support and resistance levels (default: 5).
Breakout Confirmation Bars: Number of bars the price must stay above/below the level to confirm a breakout (default: 2).
Take Profit 1 (%): First take-profit level as a percentage above/below the entry (default: 2.0%).
Take Profit 2 (%): Second take-profit level as a percentage above/below the entry (default: 4.0%).
Stop Loss (%): Stop-loss level as a percentage below/above the entry (default: 1.0%).
Show Multiple Entries: Toggle to display up to 5 recent entries or only the latest (default: false).
Direction Change Threshold (%): Percentage the price must move away from the entry to allow a direction change (default: 2.0%).
How to Use
Add the Breakout Scanner to your chart.
Adjust the settings to match your trading style (e.g., tweak the pivot lookback or SL/TP percentages).
Watch for breakout labels ("Breakout") on the chart, indicating a confirmed breakout.
Use the plotted entry, SL, TP1, and TP2 levels to plan your trades.
Enable alerts to be notified of new breakouts in real-time.
Notes
This indicator is designed to assist with identifying breakout opportunities and does not guarantee specific results. Always combine it with other analysis and risk management techniques.
The direction change feature helps filter breakouts in the opposite direction, but significant price movements may still trigger a new entry in the opposite direction.
For best results, test the indicator on a demo account to understand its behavior in your preferred market and timeframe.

Smart Money Breakout Signals [AlgoAlpha]Introducing the Smart Money Breakout Signals, a cutting-edge trading indicator designed to identify key structural shifts and breakout opportunities in the market. This tool leverages a blend of smart money concepts like Break of Structure (BOS) and Change of Character (CHoCH) to provide traders with actionable insights into market direction and potential entry or exit points.
Key Features :
✨ Market Structure Analysis : Automatically detects and labels BOS and CHoCH for trend confirmation and reversals.
🎨 Customizable Visualization : Tailor bullish and bearish colors for breakout lines and signals to suit your preferences.
📊 Dynamic Take-Profit Targets : Displays three tiered take-profit levels based on breakout volatility.
🔔 Real-Time Alerts : Stay ahead of the game with notifications for bullish and bearish breakouts.
📋 Performance Dashboard : Monitor signal statistics, including win rates and total signals, directly on your chart.
How to Use :
Add the Indicator : Add the script to your favourites ⭐ and customize settings like market structure horizon and confirmation type.
Monitor Breakouts : Observe BOS and CHoCH labels to identify potential trend shifts. Use the breakout lines and tiered take-profit levels to plan trades effectively.
Set Alerts : Enable alerts for bullish or bearish breakouts to act on opportunities without constant monitoring.
How It Works :
The indicator identifies market structure by analyzing pivot highs and lows over a user-defined time horizon. A breakout is confirmed based on either candle closes or wicks surpassing previous pivot points. Upon detection, the script generates signals with breakout lines and calculates take-profit targets based on the distance from the breakout level. A built-in dashboard tracks performance metrics like total signals and win rates, giving traders real-time feedback on strategy effectiveness.

Reversal and Breakout Signals [AlgoAlpha]🚀🌟 Introducing the Reversal and Breakout Signals by AlgoAlpha 🌟🚀
This innovative tool is crafted to enhance your chart analysis by identifying potential reversal and breakout opportunities directly on your charts. It's designed with both novice and experienced traders in mind, providing intuitive visual cues for better decision-making. Let's dive into the key features and how it operates:
### Key Features:
🔶 Dynamic Period Settings: Customize the sensitivity of the indicator with user-defined periods for both the indicator and volume strength.
📊 Volume Threshold: Set a threshold to define what constitutes strong volume, enabling the identification of significant market movements.
💡 Trend Coloring: Option to color candles during trends, making it easier to visualize bullish and bearish market conditions.
🌈 Customizable Visuals: Choose your preferred colors for bullish, bearish, and breakout signals, personalizing the chart to your liking.
🚨 Advanced Alert System: Configure alerts for reversal and breakout signals, ensuring you never miss a potential trading opportunity.
### How to Use:
To maximize the effectiveness of the Reversal and Breakout Signals tool, follow these steps:
1. 🔧 Set Up Your Preferences:
- Adjust the Indicator Period and Volume Strength Period to match the timeframe of your trading strategy. This fine-tuning allows the indicator to better align with your specific market analysis needs.
- Define the Strong Volume Threshold to distinguish between ordinary and significant volume movements. This helps in identifying breakout or reversal signals with higher confidence.
2. 🎨 Customize Visuals:
- Choose colors for Bullish , Bearish , and Breakout Signals to visually differentiate between different types of market activities. This customization facilitates quicker decision-making while scanning charts.
3. 🔍 Reversal Signals:
- Bullish Reversal : Look for a triangle below the bar indicating a potential upward movement. It's identified when the price dips below the lower level but closes above it, suggesting a rejection of lower prices.
- Bearish Reversal : A triangle above the bar signals a potential downward movement. This occurs when the price spikes above the upper level but closes below, indicating a rejection of higher prices.
4. 📈 Trend and Breakout Signals:
- Diamonds represent breakout signals. A bullish breakout is marked below the bar when the price closes above the upper level, suggesting strong buying pressure. Conversely, a bearish breakout above the bar indicates strong selling pressure as the price closes below the lower level.
- The tool also features a Trend Tracker that highlights the current market trend using the Hull Moving Average (HMA). This can help you stay aligned with the overall market direction for your trades.
By integrating these steps into your trading strategy, the Reversal and Breakout Signals tool can provide actionable insights to help identify potential entry and exit points, enhancing your trading decisions with visual cues and alerts for market reversals and breakouts.
### How It Works:
The core logic revolves around calculating weighted moving averages of high and low prices over a user-defined period, identifying the highest and lowest points within this period to establish potential breakout or breakdown levels while reducing the amount of noise, hence the use of moving averages.
1. Weighted Moving Averages Calculation:
sh = ta.wma(high, len)
sl = ta.wma(low, len)
h = ta.highest(sh, len)
l = ta.lowest(sl, len)
2. Breakout and Reversal Detection:
The script then employs logic to detect bullish and bearish breakouts and reversals based on the closing price's position relative to these levels, combined with volume analysis to confirm the strength of the move.
if not (h < h or h > h )
hstore := h
if not (l < l or l > l )
lstore := l
bullishbreakout := (breakout or ((breakout or breakout or breakout or breakout ) and candledir == 1)) and strongvol and not (bullishbreakout or bullishbreakout or bullishbreakout )
bearishbreakout := (breakdown or ((breakdown or breakdown or breakdown or breakdown ) and candledir == -1)) and strongvol and not (bearishbreakout or bearishbreakout or bearishbreakout )
3. Visual Indicators and Alerts:
Visual cues such as triangle shapes for reversals and diamonds for breakouts, along with colored bars, make it easy to spot these opportunities. Additionally, alerts can be set up for these events, ensuring traders can react promptly to potential trading setups.
plotshape(bullishrej and not (state ==- 1) ? low * 0.9995 : na, " Bullish Reversal ", shape.triangleup, location.belowbar, color.new(green, 0), size = size.tiny, text = "𝓡", textcolor = color.gray)
plotshape(bearishrej and not (state == 1) ? high * 1.0005 : na, " Bearish Reversal ", shape.triangledown, location.abovebar, color.new(red, 0), size = size.tiny, text = "𝓡", textcolor = color.gray)
plotshape(bullishbreakout ? low * 0.999 : na, " Bullish Breakout ", shape.diamond, location.belowbar, color.new(yellow, 0), size = size.tiny, text = "𝓑", textcolor = color.gray)
plotshape(bearishbreakout ? high * 1.001 : na, " Bearish Breakout ", shape.diamond, location.abovebar, color.new(yellow, 0), size = size.tiny, text = "𝓑", textcolor = color.gray)
This script is a versatile tool designed to aid in the identification of key reversal and breakout points, helping traders to make informed decisions based on technical analysis. Its customization options allow for a tailored analysis experience, fitting the unique needs and strategies of each trader.

London BreakOut ClassicHey there, this is my first time publishing a strategy. The strategy is based on the London Breakout Idea, an incredibly popular concept with abundant information available online.
Let me summarize the London Breakout Strategy in a nutshell: It involves identifying key price levels based on the Tokyo Session before the London Session starts. Typically, these key levels are the high and low of the previous Tokyo session. If a breakout occurs during the London session, you simply follow the trend.
The purpose of this code
After conducting my research, I came across numerous posts, videos, and articles discussing the London Breakout Strategy. I aimed to automatically test it myself to verify whether the claims made by these so-called trading gurus are accurate or not. Consequently, I wrote this script to gain an understanding of how this strategy would perform if I were to follow its basic settings blindly.
Explanation of drawings on the chart:
Red or Green Box: A box is drawn on our chart displaying the exact range of the Tokyo trading session. This box is colored red if the trend during the session was downward and green if it was upward. The box is always drawn between the high and the low between 0:00 AM and 7:00 AM UTC. You can change the settings via the Inputs "Session time Tokyo" & "Session time zone".
Green Background: The green background represents the London trading session. My code allows us to make entries only during this time. If we haven't entered a trade, any pending orders are canceled. I've also programmed a timeout at 11 pm to ensure every trade is closed before the new Tokyo session begins.
Red Line: The red line is automatically placed in the middle of our previous Tokyo range. This line acts as our stop loss. If we cross this line after entering a trade but before reaching our take profit, we'll be stopped out.
When do we enter a trade?
We wait for a candle body to close outside of the previous Tokyo range to enter a trade with the opening of the next candle. We only enter one trade per day.
Where do we put our Take Profit?
The code calculates the exact distance between our entry point and the stop loss. We are trading a risk-reward ratio of 1:1 by default, meaning our take profit is always the same number of pips away from our entry as the stop loss. The Stop Loss is always defined by the red line on the chart. You can change the risk-reward ratio via the inputs setting "CRV", to see how the result changes.
What is the purpose of this script?
I wanted to backtest the London breakout strategy to see how it actually works. Therefore, I wrote this code so that everybody can test it for themselves. You can change the settings and see how the result changes. Typically, you should test this strategy on forex markets and on either 1Min, 5 Min, or 15 Min timeframe.
What are the results?
Over the last 3-6 months (over 100 trades), trading the strategy with my default settings hasn't proven to be very successful. Consequently, I do not recommend trading this strategy blindly. The purpose of this code is to provide you with a foundation for the London Breakout Strategy, allowing you to modify and enhance it according to your preferences. If you're contemplating whether to give it a try, you can assess the results from the past months by using this code as a starting point.

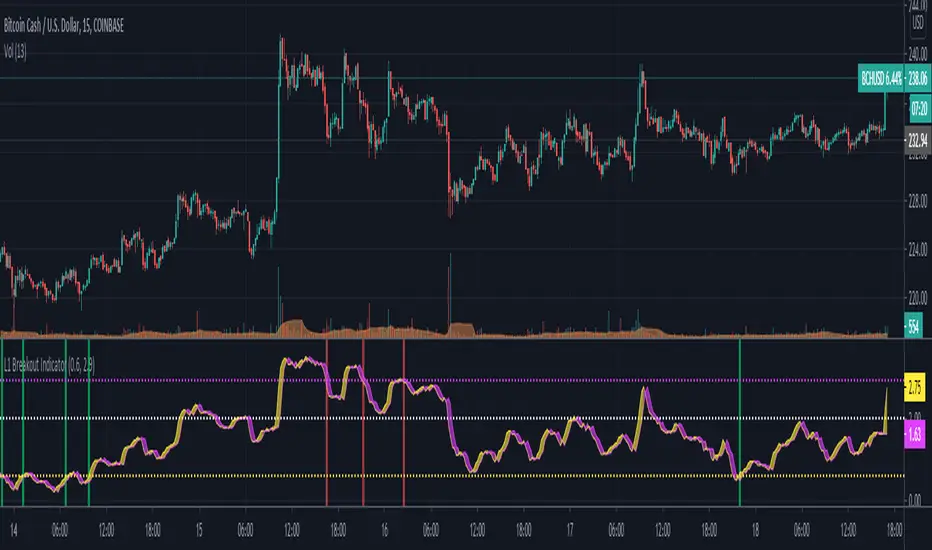
Banded Chikou Breakout — Quantifying Ichimoku MomentumTitle: Banded Chikou Breakout — Quantifying Ichimoku Momentum
Overview:
Banded Chikou Breakout (BCB) is a unique, algorithmic script designed to augment the capabilities of traders seeking substantial breakout opportunities. Constructed on the robust principles of the Ichimoku trading strategy, BCB is designed to quantify and filter the Chikou Span's significant breakouts above or below the price action. This script does not aim to replace the Ichimoku system; instead, it enhances it, providing an optimized tool for momentum trading.
Rationale:
Ichimoku traders often scrutinize the Chikou Span's position relative to price action to identify market trends. However, determining whether the Chikou Span is above or below due to a genuine trend or mere market noise can be challenging in choppy markets. BCB resolves this predicament by offering a unique way to interpret the Chikou Span's movement. It does so by quantifying the Chikou Span's momentum and utilizing Bollinger Bands to determine its significance. By effectively differentiating substantial movements from the insignificant, BCB can help traders better navigate the market and increase their potential for profitable trades.
How it Works:
BCB combines three key elements: a Momentum Script (simulating Chikou Span), a Bollinger Band Script, and a Timeframe Switcher, all working together to provide a refined trading perspective.
Momentum Script: Calculates the price difference between the current price and the price 'n' periods ago, transforming the Chikou Span into a quantifiable momentum value that signifies the strength and speed of a market move.
Bollinger Band Script: Computes a Simple Moving Average (SMA) around the momentum, plotting two 'bands' at a specified standard deviation from this SMA. This functionality allows traders to discern when the Chikou Span's momentum is abnormally high or low, signifying a potential significant breakout.
Timeframe Switcher: This feature lets traders apply the BCB script to a different timeframe from the one they are currently viewing. This capability can help traders identify higher timeframe breakouts and trade them with precision on the lower timeframe.
How to Use:
BCB is designed to complement the Ichimoku strategy for effective breakout identification.
Add the BCB script to your trading chart. It plots the momentum (yellow line) and Bollinger Bands (green lines) with the area between the bands shaded blue.
Utilize the Ichimoku strategy to identify larger and smaller timeframe trends.
Optional: Leverage the timeframe switcher to synchronize your trades with higher timeframe trends while operating on lower timeframes.
If the BCB momentum line crosses the upper Bollinger Band while the Ichimoku indicates a bullish trend, it signifies a potential significant upward breakout. Similarly, a cross below the lower band during a bearish trend could denote a significant downward breakout.
Remember, without the context provided by the Ichimoku system's trend analysis, BCB can yield false breakouts. It is, therefore, crucial to use these tools in tandem. I like to check for an Ichimoku trend on the 4H and 1H charts, and then use BCB on charts <60 minutes to capture trends with precision.

Breakout LevelsBreakout Levels - User Guide
Overview
The Breakout Levels indicator automatically detects and displays significant breakout candles across multiple timeframes. A breakout occurs when price makes a strong, decisive move - identified by candles with unusually large bodies relative to average volatility.
These breakout levels often act as future support/resistance zones, making them valuable reference points for trading decisions.
What is a Breakout?
A breakout is detected when a candle's body size (the distance between open and close) is significantly larger than normal. By default, the script looks for candles that are 2x the ATR (Average True Range) or larger.
Example:
If the 14-period ATR is $5, a candle with a $10+ body would qualify as a breakout
These represent strong, committed moves by the market
The script marks the high of bullish breakouts and the low of bearish breakouts
Settings Guide
Timeframes
Toggle which timeframes to monitor for breakouts:
Show Daily Breakouts - Green/Red levels from daily chart breakouts
Show 4H Breakouts - 4-hour timeframe breakouts
Show 1H Breakouts - 1-hour timeframe breakouts
Show 15M Breakouts - 15-minute timeframe breakouts
Tip: When running on a 15-minute chart, you can see breakouts from all higher timeframes simultaneously.
Lookback (How Far Back to Display)
Controls how many bars back to show levels for each timeframe:
TimeframeDefaultWhat it Means15M50 bars~12.5 hours of breakout history1H200 bars~8 days of breakout history4H250 bars~42 days of breakout historyDaily300 bars~300 days (nearly 1 year)
Why adjust this?
Increase to see more historical levels (may clutter chart)
Decrease to focus only on recent breakouts
Older levels are still stored, just not displayed
Detection Settings
Breakout Candle Size (x ATR)
Default: 2.0
Range: 1.0 to 5.0
What it does: Multiplier for what qualifies as a "big" candle
SettingSensitivityUse Case1.0-1.5Very sensitiveCatches more breakouts, but may include false moves2.0Balanced (default)Good mix of quality and quantity3.0-5.0Very selectiveOnly the most explosive moves
Recommendation: Start with 2.0 and adjust based on your market and trading style.
Visual Settings
Bullish Breakout Color
Default: Green with 60% transparency
Marks levels where price broke upward strongly
Bearish Breakout Color
Default: Red with 60% transparency
Marks levels where price broke downward strongly
Show Labels
Toggle labels on/off
Labels display: BO
Example: "4H BO 150.25"
Turn OFF for cleaner charts when you just want the lines
How to Use This Indicator
1. Identify Key Breakout Zones
Breakout levels often become magnets where price returns later:
Former resistance (where price broke up) becomes future support
Former support (where price broke down) becomes future resistance
2. Look for Confluence
When multiple timeframe breakouts cluster near the same price:
15M + 1H + 4H breakouts all near $150 = strong level
More confluence = more significant level
3. Watch for Retests
After a breakout, price often returns to test that level:
Bullish breakout retest from above = potential long entry
Bearish breakout retest from below = potential short entry
4. Combine with Other Analysis
Use breakout levels alongside:
Your own support/resistance analysis
Volume profiles
Fibonacci levels
Candlestick patterns at these levels
Practical Examples
Example 1: Clean Breakout and Retest
Daily candle closes up with a huge body (2.5x ATR)
Green line drawn at the high of that candle
Price pulls back 3 days later and bounces exactly off that green line
Trade opportunity: Long entry at the retest with stop below
Example 2: Failed Breakout
4H bearish breakout draws a red line at the low
Price immediately reverses back above the level
Signal: The breakout was false - consider this a stop hunt zone
Example 3: Multi-Timeframe Confluence
Daily breakout at $100
4H breakout at $100.50
1H breakout at $99.80
Strong cluster zone: $99.80-$100.50 becomes a major decision point
Best Practices
DO:
✅ Start with default settings (2.0x ATR, default lookbacks)
✅ Use on a 15-minute chart to see all timeframes
✅ Look for price reactions at these levels before trading
✅ Combine with volume - breakouts with high volume are more reliable
✅ Turn off labels when chart gets too busy
DON'T:
❌ Treat every line as guaranteed support/resistance
❌ Set breakout multiplier too low (<1.5) - creates noise
❌ Ignore the context - check what's happening in the broader market
❌ Trade blindly at these levels without confirmation
Troubleshooting
"Too many lines on my chart"
Reduce the lookback settings
Turn off some timeframes (maybe just show Daily + 4H)
Increase the breakout multiplier to 2.5 or 3.0
"Not showing any levels"
Lower the breakout multiplier to 1.5
Increase lookback settings
Check that at least one timeframe toggle is ON
Verify the market had actual volatility during the period
"Labels are cluttering the chart"
Turn off "Show Labels" in settings
Lines will remain, labels disappear
Technical Notes
ATR Period: 14 (industry standard, not adjustable in this version)
Max Lines: 500 (Pine Script limitation)
Duplicate Filter: Levels within 0.3% of ATR are considered duplicates and filtered
Chart Type: Works on any chart timeframe, optimized for 15-minute
Asset Type: Works on stocks, forex, crypto, futures
Summary
The Breakout Levels indicator gives you a systematic way to identify where strong, committed market moves occurred. These levels often act as future decision points. Use them as reference zones to watch for price reactions, not as automatic trade signals.
Quick Start:
Add indicator to a 15-minute chart
Leave default settings (2.0x ATR)
Watch how price interacts with the levels over the next few days
Adjust sensitivity based on your observations
Happy trading! 📈

Tristan's Box: Pre-Market Range Breakout + RetestMarket Context:
This is designed for U.S. stocks, focusing on pre-market price action (4:00–9:30 AM ET) to identify key support/resistance levels before the regular session opens.
Built for 1 min and 5 min timelines, and is intended for day trading / scalping.
Core Idea:
Pre-market range (high/low) often acts as a magnet for price during regular hours.
The first breakout outside this range signals potential strong momentum in that direction.
Retest of the breakout level confirms whether the breakout is valid, avoiding false moves.
Step-by-Step Logic:
Pre-Market Range Identification:
Track high and low from 4:00–9:30 AM ET.
Draw a box spanning this range for visual reference and calculation.
Breakout Detection:
When the first candle closes above the pre-market high → long breakout.
When the first candle closes below the pre-market low → short breakout.
The first breakout candle is highlighted with a “YOLO” label for visual confirmation.
Retest Confirmation:
Identify the first candle whose wick touches the pre-market box (high touches top for short, low touches bottom for long).
Wait for the next candle: if it closes outside the box, it confirms the breakout.
Entry Execution:
Long entry: on the confirming candle after a wick-touch above the pre-market high.
Short entry: on the confirming candle after a wick-touch below the pre-market low.
Only the first valid entry per direction per day is taken.
Visuals & Alerts:
Box represents pre-market high/low.
Top/bottom box border lines show the pre-market high / low levels cleanly.
BUY/SELL markers are pinned to the confirming candle.
Added a "YOLO" marker on breakout candle.
Alert conditions trigger when a breakout is confirmed by the retest.
Strategy Type:
Momentum breakout strategy with confirmation retest.
Combines pre-market structure and risk-managed entries.
Designed to filter false breakouts by requiring confirmation on the candle after the wick-touch.
In short, it’s a pre-market breakout momentum strategy: it uses the pre-market high/low as reference, waits for a breakout, and then enters only after a confirmation retest, reducing the chance of entering on a false spike.
Always use good risk management.

NR4 & NR7 with Breakouts [LuxAlgo]NR4 & NR7 with Breakouts is a simple indicator that utilizes the NR4 and NR7 candle patterns to display candle ranges and signals from range breakouts.
🔶 USAGE
The Narrow Range Patterns are candle formations determined by the last candle having a narrower (high-low) range than the previous number. This indicator showcases the 2 most recognized Narrow Range Patterns, which are the 4 and 7 bar variants (NR4 and NR7).
These patterns, introduced by Toby Crabel, are thought to provide insight for potential market breakouts by identifying periods of low volatility indicated by a candle with a small range. This is due to the idea that markets often move from periods of low volatility (contraction) to high volatility (expansion), and the NR4 and NR7 patterns help spot these transitions.
By utilizing these patterns, traders are better able to anticipate and respond to market shifts for better decision-making and risk management.
NOTE: These patterns have traditionally been studied on the Daily Timeframe Chart. This indicator allows the user to select a timeframe to generate these patterns from. It is suggested to be mindful of this when considering these patterns.
In this indicator, on the bar after the pattern is detected, the Narrow Range Bar will be highlighted with a zone, and lines displaying the range will extend from it. These ranges are helpful for providing levels to set limit orders and for managing risk.
Users are able to adjust which pattern they want visualized on their chart, please note;
All NR7s are NR4s but not all NR4s are NR7s.
Because of this, you will notice that when selecting "NR4" to display, the colors will change, but the detected ranges will not change.
🔹 Signals
When a Narrow Range Bar is detected, the script will wait for the price to close outside of the Range, then a signal will fire indicating the direction of exit. The signals are produced from the last NR4 or NR7 and will have the potential to fire from that range until a new NR4 or NR7 is detected.
After a signal fires, the logic goes into a "reset" period where it will wait for the price to reach the Range Mean before firing another signal.
These signals can be anticipated by considering the underlying logic and watching price approach the range extremities, and can be improved by utilizing other market information for confluence.
🔶 SETTINGS
Timeframe: Choose which timeframe to identify the NR4 and NR7 Pattern on. This must be Higher than the chart timeframe.
Pattern Type: Choose which (or all) patterns to display.

ORB - Futures and Stocks (Breakouts + Alerts + ORB Selector)This indicator shows the Opening Range Breakout (ORB) based on the time range you choose.
Important:
It only works for intraday trading on time frames less than 1 day (like 1-minute, 5-minute, or hourly charts).
You can use it with any stock or futures, such as US500, NAS100, or GER40.
Inputs:
ORB Range - Your preference.
Session Start
Time Zone Offset
Examples:
for EU Frankfurt, DAX (GER40):
Set your ORB range
Session Start 0900
Time Zone Offset +1
For US Stock Market and US500, NAS100:
Set your ORB range
Session Start 0930
Time Zone Offset -5
Created using ChatGPT

Range Breakout Signals [AlgoAlpha]OVERVIEW
This script detects range-bound market conditions and breakout signals using a combination of volatility compression and volume imbalance analysis. It identifies zones where price consolidates within a defined range and highlights potential breakout points with visual markers. Traders can use this to spot market transitions from ranging to trending phases, aiding in decision-making for breakout strategies.
CONCEPTS
The script measures volatility by comparing the ratio of the simple moving average (SMA) of price movements to their median value. When volatility drops below a threshold, the script assumes a range-bound market. It then tracks the cumulative volume of buying and selling pressure to assess breakout strength. The approach is based on the idea that market consolidation often precedes strong moves, and volume distribution can provide clues on the breakout direction.
FEATURES
Range Detection : Uses a volatility filter to identify low-volatility zones and marks them on the chart with shaded boxes.
Volume Imbalance Analysis : Evaluates cumulative up and down volume over a confirmation period to assess directional bias.
Breakout Signals : When price exits a detected range, the script plots breakout markers. A ▲ symbol indicates a bullish breakout, and a ▼ symbol indicates a bearish breakout. Additional "+" markers indicate strong volume imbalance favoring the breakout direction.
Adaptive Timeframe Volume Analysis : The script dynamically adjusts its volume calculation based on the chart’s timeframe, ensuring reliable signal generation across different trading conditions.
Alerts : Notifies traders when a new range is detected or when a breakout occurs, allowing for automated monitoring.
USAGE
Traders can use this script to identify potential trade setups by entering positions when price breaks out of a detected range. For breakout confirmation, traders can look at volume imbalance cues—bullish breakouts with strong buying volume may indicate sustained moves, while weak volume breakouts may lead to false signals. This script is particularly useful for breakout traders, range traders seeking to fade breakouts, and those looking to automate trade alerts in volatile markets.

Volatility Compression BreakoutThe Volatility Compression Breakout indicator is designed to identify periods of low volatility followed by potential breakout opportunities in the market. It aims to capture moments when the price consolidates within a narrow range, indicating a decrease in volatility, and anticipates a subsequent expansion in price movement. This indicator can be applied to any financial instrument and timeframe.
When the close price is above both the Keltner Middle line and the Exponential Moving Average (EMA), the bars are colored lime green, indicating a potential bullish market sentiment. When the close price is positioned above the Keltner Middle but below the EMA, or below the Keltner Middle but above the EMA, the bars are colored yellow, signifying a neutral or indecisive market condition. Conversely, when the close price falls below both the Keltner Middle and the EMA, the bars are colored fuchsia, suggesting a potential bearish market sentiment.
Additionally, the coloration of the Keltner Middle line and the EMA provides further visual cues for assessing the trend. When the close price is above the Keltner Middle, the line is colored lime green, indicating a bullish trend. Conversely, when the close price is below the Keltner Middle, the line is colored fuchsia, highlighting a bearish trend. Similarly, the EMA line is colored lime green when the close price is above it, representing a bullish trend, and fuchsia when the close price is below it, indicating a bearish trend.
Parameters
-- Compression Period : This parameter determines the lookback period used to calculate the volatility compression. A larger value will consider a longer historical period for volatility analysis, potentially capturing broader market conditions. Conversely, a smaller value focuses on more recent price action, providing a more responsive signal to current market conditions.
-- Compression Multiplier : The compression multiplier is a factor applied to the Average True Range (ATR) to determine the width of the Keltner Channels. Increasing the multiplier expands the width of the channels, allowing for a larger price range before a breakout is triggered. Decreasing the multiplier tightens the channels and requires a narrower price range for a breakout signal.
-- EMA Period : This parameter sets the period for the Exponential Moving Average (EMA), which acts as a trend filter. The EMA helps identify the overall market trend and provides additional confirmation for potential breakouts. Adjusting the period allows you to capture shorter or longer-term trends, depending on your trading preferences.
How Changing Parameters Can Be Beneficial
Modifying the parameters allows you to adapt the indicator to different market conditions and trading styles. Increasing the compression period can help identify broader volatility patterns and major market shifts. On the other hand, decreasing the compression period provides more precise and timely signals for short-term traders.
Adjusting the compression multiplier affects the width of the Keltner Channels. Higher multipliers increase the breakout threshold, filtering out smaller price movements and providing more reliable signals during significant market shifts. Lower multipliers make the indicator more sensitive to smaller price ranges, generating more frequent but potentially less reliable signals.
The EMA period in the trend filter helps you align your trades with the prevailing market direction. Increasing the EMA period smoothes out the trend, filtering out shorter-term fluctuations and focusing on more sustained moves. Decreasing the EMA period allows for quicker responses to changes in trend, capturing shorter-term price swings.
Potential Downsides
While the Volatility Compression Breakout indicator can provide valuable insights into potential breakouts, it's important to note that no indicator guarantees accuracy or eliminates risk. False breakouts and whipsaw movements can occur, especially in volatile or choppy market conditions. It is recommended to combine this indicator with other technical analysis tools and consider fundamental factors to validate potential trade opportunities.
Making It Work for You
To maximize the effectiveness of the Volatility Compression Breakout indicator, consider the following:
-- Combine it with other indicators : Use complementary indicators such as trend lines, oscillators, or support and resistance levels to confirm signals and increase the probability of successful trades.
-- Practice risk management : Set appropriate stop-loss levels to protect your capital in case of false breakouts or adverse price movements. Consider implementing trailing stops or adjusting stop-loss levels as the trade progresses.
-- Validate with price action : Analyze the price action within the compression phase and look for signs of building momentum or weakening trends. Support your decisions by observing candlestick patterns and volume behavior during the breakout.
-- Backtest and optimize : Test the indicator's performance across different timeframes and market conditions. Optimize the parameters based on historical data to find the most suitable settings for your trading strategy.
Remember, no single indicator can guarantee consistent profitability, and it's essential to use the Volatility Compression Breakout indicator as part of a comprehensive trading plan. Regularly review and adapt your strategy based on market conditions and your trading experience. Monitor the indicator's performance and make necessary adjustments to parameter values if the market dynamics change.
By adjusting the parameters and incorporating additional analysis techniques, you can customize the indicator to suit your trading style and preferences. However, it is crucial to exercise caution, conduct thorough analysis, and practice proper risk management to increase the likelihood of successful trades. Remember that no indicator can guarantee profits, and continuous learning and adaptation are key to long-term trading success.

Advanced Breakout System v2.0Advanced Breakout System v2.0
Developed by: Mohammed Bedaiwi
This script hunts for high-probability breakouts by combining price consolidation zones, volume spikes vs. average volume, smart money flow (OBV), and a Momentum Override for explosive moves that skip consolidation. Additionally, it automatically identifies and plots Support and Resistance levels with price labels to help you visualize market structure.
The system follows a "Watch & Confirm" logic: it first prints a WATCH setup, then a BUY only if price confirms strength.
💡 JUSTIFICATION OF CONCEPTS (MASHUP & ORIGINALITY)
This script is an original mashup combining several analytical concepts to address common breakout failures:
Volatility Compression Engine: Uses built-in functions like ta.highest() and ta.lowest() to mathematically define the setup phase where price volatility is compressed below a user-defined threshold.
Volume Spike Confirmation: The breakout must be confirmed by a volume increase greater than a moving average of volume, signaling strong market interest.
Smart Volume Filter (OBV): This is the key component. By checking if ta.obv is above its own Moving Average, we confirm that accumulation has been occurring during the consolidation period, suggesting institutional positioning before the price break.
Multi-Exit Risk System: Employs dynamic exits (EMA cross, volume dump, bearish pattern) instead of static stop-losses to manage risk adaptively based on real-time market action.
Market Structure Visualization: The script also includes a Support & Resistance engine to plot key swing pivots and price labels for visual context.
✅ STRATEGY RESULTS & POLICY COMPLIANCE
To ensure non-misleading and transparent backtesting results, this strategy is published with the following fully compliant properties:
Dataset Compliance: The backtest is performed on the CMTL Daily (1D) chart across a long history, generating 201 total trades. This significantly exceeds the minimum requirement of 100 trades, providing a robust test dataset.
Risk Control: The strategy uses a conservative order size set to 2% of equity (default_qty_value=2), strictly adhering to the sustainable risk recommendation of 5-10% of equity per trade.
Transaction Costs: Realistic trading conditions are modeled using 0.07% commission and 3 ticks slippage to prevent the overestimation of profitability.
⚙️ VISUAL GUIDE & SIGNAL LOGIC
Key Color Legend (Visual Guide):
WATCH – Setup (Yellow Arrow Down): Potential breakout setup detected.
BUY – Confirmation (Green Arrow Up): Confirmed breakout, triggered when price trades above the high of the WATCH candle.
SELL – Break (Orange Arrow): Short-term trend weakness, triggered when price closes below the Fast EMA (9).
SELL – Dump (Dark Red Arrow): Distribution / volume dump, triggered by a bearish candle with abnormally high volume.
SELL – Pattern (Purple Arrow): Bearish price-action pattern (such as a bearish engulfing).
Support & Resistance Lines (Red/Green): Small horizontal lines plotted at key swing points with exact price labels.
⌨️ INPUTS (DEFAULT SETTINGS)
Entry settings: Consolidation Lookback (default 20) = bars used to detect consolidation. Consolidation Range % (default 12%) = max allowed range size. Volume Spike Multiplier (default 1.2) = factor above average volume to count as a spike. Force Signal on Big Moves (default ON) = forces a WATCH signal on high-momentum moves.
Exit settings: Enable Fast Exit (EMA 9) toggles the SELL – Break signal. Dump Volume Multiplier defines what counts as “dump” volume.
Support & Resistance: Adjustable Pivot Left/Right bars control the sensitivity of the support and resistance lines.
⚠️ Disclaimer Trading involves significant risk of loss. This script is for educational and informational purposes only and is not financial advice or a recommendation to buy or sell any asset. BUY and SELL signals are rule-based and derived from historical behavior and do not guarantee future performance. Always use your own analysis and risk management. This is an open-source strategy; users are encouraged to test it across different symbols and timeframes.

Volume Sentiment Breakout Channels [AlgoAlpha]🟠 OVERVIEW
This tool visualizes breakout zones based on volume sentiment within dynamic price channels . It identifies high-impact consolidation areas, quantifies buy/sell dominance inside those zones, and then displays real-time shifts in sentiment strength. When the market breaks above or below these sentiment-weighted channels, traders can interpret the event as a change in conviction, not just a technical breakout.
🟠 CONCEPTS
The script builds on two layers of logic:
Channel Detection : A volatility-based algorithm locates price compression areas using normalized highs and lows over a defined lookback. These “boxes” mark accumulation or distribution ranges.
Volume Sentiment Profiling : Each channel is internally divided into small bins, where volume is aggregated and signed by candle direction. This produces a granular sentiment map showing which levels are dominated by buyers or sellers.
When a breakout occurs, the script clears the previous box and forms a new one, letting traders visually track transitions between phases of control. The colored gradients and text updates continuously reflect the internal bias—green for net-buying, red for net-selling—so you can see conviction strength at a glance.
🟠 FEATURES
Volume-weighted sentiment map inside each box, with gradient color intensity proportional to participation.
Dynamic text display of current and overall sentiment within each channel.
Real-time trail lines to show active bullish/bearish trend extensions after breakout.
🟠 USAGE
Setup : Add the script to your chart and enable Strong Closes Only if you prefer cleaner breakouts. Use shorter normalization length (e.g., 50–80) for fast markets; longer (100–200) for smoother transitions.
Read Signals : Transparent boxes mark active sentiment channels. Green gradients show buy-side dominance, red shows sell-side. The middle dashed line is the equilibrium of the channel. “▲” appears when price breaks upward, “▼” when it breaks downward.
Understanding Sentiment : The sentiment profile can be used to show the probability of the price moving up or down at respective price levels.

Smart Money Breakout Channels [AlgoAlpha]🟠 OVERVIEW
This script draws breakout detection zones called “Smart Money Breakout Channels” based on volatility-normalized price movement and visualizes them as dynamic boxes with volume overlays. It identifies temporary accumulation or distribution ranges using a custom normalized volatility metric and tracks when price breaks out of those zones—either upward or downward. Each channel represents a structured range where smart money may be active, helping traders anticipate key breakouts with added context from volume delta, up/down volume, and a visual gradient gauge for momentum bias.
🟠 CONCEPTS
The script calculates normalized price volatility by measuring the standard deviation of price mapped to a scale using the highest and lowest prices over a set lookback period. When normalized volatility reaches a local low and flips upward, a boxed channel is drawn between the highest and lowest prices in that zone. These boxes persist until price breaks out, either with a strong candle close (configurable) or by touching the boundary. Volume analysis enhances interpretation by rendering delta bars inside the box, showing volume distribution during the channel. Additionally, a real-time visual “gauge” shows where volume delta sits within the channel range, helping users spot pressure imbalances.
🟠 FEATURES
Automatic detection and drawing of breakout channels based on volatility-normalized price pivots.
Optional nested channels to allow multiple simultaneous zones or a clean single-zone view.
Gradient-filled volume gauge with dynamic pointer to show current delta pressure within the box.
Three volume visualization modes: raw volume, comparative up/down volume, and delta.
Alerts for new channel creation and confirmed bullish or bearish breakouts.
🟠 USAGE
Apply the indicator to any chart. Wait for a new breakout box to form—this occurs when volatility behavior shifts and a stable range emerges. Once a box appears, monitor price relative to its boundaries. A breakout above suggests bullish continuation, below suggests bearish continuation; signals are stronger when “Strong Closes Only” is enabled.
Watch the internal volume candles to understand where buy/sell pressure is concentrated during the box. Use the gauge on the right to interpret whether net pressure is building upward or downward before breakout to anticipate the direction.
Use alerts to catch breakout events without needing to monitor the chart constantly 🚨.

RedK Chop & Breakout Scout (C&B_Scout)The RedK Chop & Breakout Scout (C&BS or just CBS) is a centered oscillator that helps traders identify when the price is in a chop zone, where it's recommended to avoid trading or exit existing trades - and helps identify (good & tradeable) price breakouts.
i receive many questions asking for simple ways to identify chops .. Here's one way we can do that.
(This is work in progress - i was exploring with the idea, and wasn't sure how interesting other may find it. )
Quick Intro:
==================
Quick techno piece: This concept is similar to a Stochastic Oscillator - with the main difference being that we're utilizing units of ATR (instead of a channel width) to calculate the main indicator line - which will then lead to a non-restricted oscillator (rather than a +/- 100%) - given that ATR changes with the underlying and the timeframe, among other variables.
to make this easy, and avoid a lot of technical speak in the next part, :) i created (on the top price panel) the same setup that the C&B Scout represents as a lower-panel indicator.
So as you read below, please look back and compare what C&BS is doing in its lower panel, with how the price is behaving on the price chart.
how this works
========================
- To identify chops and breakouts, we need to first agree on a definition that we will use for these terms.
- for the sake of this exercise, let's agree that the price is in a chop zone, as long as the price is moving within a certain distance from a "price baseline" of choice ( which we can adjust based on the underlying, the volatility, the timeframe, the trading style..etc)
- when the price moves out of that chop zone, we consider this a breakout
- Now not all breakouts are "good" = they need to at least happen in the direction of the longer term trend. In this case, we can apply a long Moving Average to act as a filter - and consider breakouts to be "good" if they are in the same direction as the filter line
- With the above background in mind, we establish a price baseline (as you see on the top panel, this is based on the midline of a Donchian Channel - but we can use other slow moving averages in future versions)
- we will decide how far above/below that baseline is considered to be "chop zone" - we do this in terms of units of Average True Range (ATR) - using ATR here is valuable for so many reasons, most of all, how it adjusts to timeframe and volatility of underlying.
- The C&B Scout line simply calculates how far the price is above/below the baseline in terms of "ATR units". and shows how that value compares to our own definition of a "chop zone"
- so as long as the price is within the chop zone, the CBS line will be inside the shaded area - and when the price "breaks out" of the chop zone, the CBS line will also breakout (or down) from the chop zone.
- C&B Scout will give a visual clue to help take trades in the direction of the prevailing trend - the chop zone is green when the price is in "long mode", as in, the price is above the filter line - and will be red when we are in "short mode" - so the price is below the filter line. in green mode, we should only consider breakouts to the upside, and ignore breakouts to the downside (or breakdowns) - in red mode, we should only consider breakouts to the downside., and ignore the ones to the upside.
- i added some examples of "key actions" on the chart to help explain the approach here further.
Usage & settings Notes:
========================
- even though for many traders this will be a basic concept/setup, i still highly suggest you spend time getting used to how it works/reacts and adjusting the settings to suit your own trading style, timeframe, tolerance, what you trade....etc
- for example, if i am a conservative trader, i may consider any price movement within 1 x ATR above and below the baseline to be in "chop" (ATR Channel width = 2 x ATR) - and i want to only take trades when the price moves outside of that range *and* in the direction of the prevailing trend
- An aggressive trader may use a smaller ATR-based value, say 0.5 x ATR above/below the baseline, as their chop zone.
- A swing trader may use a shorter filter line and focus on the CBS line crossing the 0 line.
- .... and so on.
- Also note that the "tradeable" signal is when the CBS line "exits" the chop zone (upward on green background, or downward on red background) - however, an aggressive trader may take the crossing of the CBS line with the 0 line as the signal to open a trade.
- As usual please do not use this indicator "in isolation" and ensure you have other confirming signals from your setups before trading.
conclusion
===========
As i mentioned, this is really a simple concept - and i'm a big fan of those :) -- and there's so much that could be done to expand around it (add more visuals/colors, add alerts, add options for ATR calculation, Filter line calculations, baseline..etc) - but with this v1.0, i wanted to share this initially and see how much interest and how valuable fellow traders find it, before playing any further with it. so please be generous with your comments.

Malama's Range BreakoutMalama's Range Breakout is a dynamic indicator designed to automatically detect periods of price consolidation (tight ranges) and generate actionable signals for breakouts or wick-based reversals.
Why It's Useful: Unlike fixed-time tools like Opening Range Breakouts (ORB), this indicator is Adaptive. It uses a volatility-adjusted threshold (ATR multiplier) to determine when a market is truly consolidating. This helps traders avoid false signals in choppy markets and focus on periods where volatility is compressing.
Key Features:
Adaptive Detection: Uses ATR over a user-defined lookback to find tight ranges automatically.
Preset Profiles: Quickly switch between optimized settings for:
Scalping: (Tight Ranges)
Intraday: (Normal Ranges)
Swing Trading: (Loose Ranges)
Options/Chop: (Extreme sideways movement)
Breakout Signals: Triggers "BUY/SELL" labels when price closes outside the box. Includes an optional Volume Filter to ignore low-momentum breakouts.
Wick Reversals: Detects "Fake-outs" where wicks probe the range boundary but fail to close outside, signaling a potential reversal back into the range.
How to Use:
Select a Profile: Choose "Normal" for standard day trading or "Tight" for scalping.
Wait for the Box: The indicator will draw an orange box when price consolidates.
Trade the Break: Wait for a confirmed close outside the box (Look for the "Malama BUY/SELL" label).
Watch for Rejection: If you see a "Wick" label, it means the breakout failed—be cautious or trade the reversal.
Settings:
Profile: Select your trading style (Scalping, Intraday, Swing).
Volume Filter: Require a volume spike to confirm breakouts (Recommended).
Wick Confirmation: Require a confirmation candle before signaling a wick reversal.

Luxy Momentum, Trend, Bias and Breakout Indicators V7
TABLE OF CONTENTS
This is Version 7 (V7) - the latest and most optimized release. If you are using any older versions (V6, V5, V4, V3, etc.), it is highly recommended to replace them with V7.
Why This Indicator is Different
Who Should Use This
Core Components Overview
The UT Bot Trading System
Understanding the Market Bias Table
Candlestick Pattern Recognition
Visual Tools and Features
How to Use the Indicator
Performance and Optimization
FAQ
---
### CREDITS & ATTRIBUTION
This indicator implements proven trading concepts using entirely original code developed specifically for this project.
### CONCEPTUAL FOUNDATIONS
• UT Bot ATR Trailing System
- Original concept by @QuantNomad: (search "UT-Bot-Strategy"
- Our version is a complete reimplementation with significant enhancements:
- Volume-weighted momentum adjustment
- Composite stop loss from multiple S/R layers
- Multi-filter confirmation system (swing, %, 2-bar, ZLSMA)
- Full integration with multi-timeframe bias table
- Visual audit trail with freeze-on-touch
- NOTE: No code was copied - this is a complete reimplementation with enhancements.
• Standard Technical Indicators (Public Domain Formulas):
- Supertrend: ATR-based trend calculation with custom gradient fills
- MACD: Gerald Appel's formula with separation filters
- RSI: J. Welles Wilder's formula with pullback zone logic
- ADX/DMI: Custom trend strength formula inspired by Wilder's directional movement concept, reimplemented with volume weighting and efficiency metrics
- ZLSMA: Zero-lag formula enhanced with Hull MA and momentum prediction
### Custom Implementations
- Trend Strength: Inspired by Wilder's ADX concept but using volume-weighted pressure calculation and efficiency metrics (not traditional +DI/-DI smoothing)
- All code implementations are original
### ORIGINAL FEATURES (70%+ of codebase)
- Multi-Timeframe Bias Table with live updates
- Risk Management System (R-multiple TPs, freeze-on-touch)
- Opening Range Breakout tracker with session management
- Composite Stop Loss calculator using 6+ S/R layers
- Performance optimization system (caching, conditional calcs)
- VIX Fear Index integration
- Previous Day High/Low auto-detection
- Candlestick pattern recognition with interactive tooltips
- Smart label and visual management
- All UI/UX design and table architecture
### DEVELOPMENT PROCESS
**AI Assistance:** This indicator was developed over 2+ months with AI assistance (ChatGPT/Claude) used for:
- Writing Pine Script code based on design specifications
- Optimizing performance and fixing bugs
- Ensuring Pine Script v6 compliance
- Generating documentation
**Author's Role:** All trading concepts, system design, feature selection, integration logic, and strategic decisions are original work by the author. The AI was a coding tool, not the system designer.
**Transparency:** We believe in full disclosure - this project demonstrates how AI can be used as a powerful development tool while maintaining creative and strategic ownership.
---
1. WHY THIS INDICATOR IS DIFFERENT
Most traders use multiple separate indicators on their charts, leading to cluttered screens, conflicting signals, and analysis paralysis. The Suite solves this by integrating proven technical tools into a single, cohesive system.
Key Advantages:
All-in-One Design: Instead of loading 5-10 separate indicators, you get everything in one optimized script. This reduces chart clutter and improves TradingView performance.
Multi-Timeframe Bias Table: Unlike standard indicators that only show the current timeframe, the Bias Table aggregates trend signals across multiple timeframes simultaneously. See at a glance whether 1m, 5m, 15m, 1h are aligned bullish or bearish - no more switching between charts.
Smart Confirmations: The indicator doesn't just give signals - it shows you WHY. Every entry has multiple layers of confirmation (MA cross, MACD momentum, ADX strength, RSI pullback, volume, etc.) that you can toggle on/off.
Dynamic Stop Loss System: Instead of static ATR stops, the SL is calculated from multiple support/resistance layers: UT trailing line, Supertrend, VWAP, swing structure, and MA levels. This creates more intelligent, price-action-aware stops.
R-Multiple Take Profits: Built-in TP system calculates targets based on your initial risk (1R, 1.5R, 2R, 3R). Lines freeze when touched with visual checkmarks, giving you a clean audit trail of partial exits.
Educational Tooltips Everywhere: Every single input has detailed tooltips explaining what it does, typical values, and how it impacts trading. You're not guessing - you're learning as you configure.
Performance Optimized: Smart caching, conditional calculations, and modular design mean the indicator runs fast despite having 15+ features. Turn off what you don't use for even better performance.
No Repainting: All signals respect bar close. Alerts fire correctly. What you see in history is what you would have gotten in real-time.
What Makes It Unique:
Integrated UT Bot + Bias Table: No other indicator combines UT Bot's ATR trailing system with a live multi-timeframe dashboard. You get precision entries with macro trend context.
Candlestick Pattern Recognition with Interactive Tooltips: Patterns aren't just marked - hover over any emoji for a full explanation of what the pattern means and how to trade it.
Opening Range Breakout Tracker: Built-in ORB system for intraday traders with customizable session times and real-time status updates in the Bias Table.
Previous Day High/Low Auto-Detection: Automatically plots PDH/PDL on intraday charts with theme-aware colors. Updates daily without manual input.
Dynamic Row Labels in Bias Table: The table shows your actual settings (e.g., "EMA 10 > SMA 20") not generic labels. You know exactly what's being evaluated.
Modular Filter System: Instead of forcing a fixed methodology, the indicator lets you build your own strategy. Start with just UT Bot, add filters one at a time, test what works for your style.
---
2. WHO WHOULD USE THIS
Designed For:
Intermediate to Advanced Traders: You understand basic technical analysis (MAs, RSI, MACD) and want to combine multiple confirmations efficiently. This isn't a "one-click profit" system - it's a professional toolkit.
Multi-Timeframe Traders: If you trade one asset but check multiple timeframes for confirmation (e.g., enter on 5m after checking 15m and 1h alignment), the Bias Table will save you hours every week.
Trend Followers: The indicator excels at identifying and following trends using UT Bot, Supertrend, and MA systems. If you trade breakouts and pullbacks in trending markets, this is built for you.
Intraday and Swing Traders: Works equally well on 5m-1h charts (day trading) and 4h-D charts (swing trading). Scalpers can use it too with appropriate settings adjustments.
Discretionary Traders: This isn't a black-box system. You see all the components, understand the logic, and make final decisions. Perfect for traders who want tools, not automation.
Works Across All Markets:
Stocks (US, international)
Cryptocurrency (24/7 markets supported)
Forex pairs
Indices (SPY, QQQ, etc.)
Commodities
NOT Ideal For :
Complete Beginners: If you don't know what a moving average or RSI is, start with basics first. This indicator assumes foundational knowledge.
Algo Traders Seeking Black Box: This is discretionary. Signals require context and confirmation. Not suitable for blind automated execution.
Mean-Reversion Only Traders: The indicator is trend-following at its core. While VWAP bands support mean-reversion, the primary methodology is trend continuation.
---
3. CORE COMPONENTS OVERVIEW
The indicator combines these proven systems:
Trend Analysis:
Moving Averages: Four customizable MAs (Fast, Medium, Medium-Long, Long) with six types to choose from (EMA, SMA, WMA, VWMA, RMA, HMA). Mix and match for your style.
Supertrend: ATR-based trend indicator with unique gradient fill showing trend strength. One-sided ribbon visualization makes it easier to see momentum building or fading.
ZLSMA : Zero-lag linear-regression smoothed moving average. Reduces lag compared to traditional MAs while maintaining smooth curves.
Momentum & Filters:
MACD: Standard MACD with separation filter to avoid weak crossovers.
RSI: Pullback zone detection - only enter longs when RSI is in your defined "buy zone" and shorts in "sell zone".
ADX/DMI: Trend strength measurement with directional filter. Ensures you only trade when there's actual momentum.
Volume Filter: Relative volume confirmation - require above-average volume for entries.
Donchian Breakout: Optional channel breakout requirement.
Signal Systems:
UT Bot: The primary signal generator. ATR trailing stop that adapts to volatility and gives clear entry/exit points.
Base Signals: MA cross system with all the above filters applied. More conservative than UT Bot alone.
Market Bias Table: Multi-timeframe dashboard showing trend alignment across 7 timeframes plus macro bias (3-day, weekly, monthly, quarterly, VIX).
Candlestick Patterns: Six major reversal patterns auto-detected with interactive tooltips.
ORB Tracker: Opening range high/low with breakout status (intraday only).
PDH/PDL: Previous day levels plotted automatically on intraday charts.
VWAP + Bands : Session-anchored VWAP with up to three standard deviation band pairs.
---
4. THE UT BOT TRADING SYSTEM
The UT Bot is the heart of the indicator's signal generation. It's an advanced ATR trailing stop that adapts to market volatility.
Why UT Bot is Superior to Fixed Stops:
Traditional ATR stops use a fixed multiplier (e.g., "stop = entry - 2×ATR"). UT Bot is smarter:
It TRAILS the stop as price moves in your favor
It WIDENS during high volatility to avoid premature stops
It TIGHTENS during consolidation to lock in profits
It FLIPS when price breaks the trailing line, signaling reversals
Visual Elements You'll See:
Orange Trailing Line: The actual UT stop level that adapts bar-by-bar
Buy/Sell Labels: Aqua triangle (long) or orange triangle (short) when the line flips
ENTRY Line: Horizontal line at your entry price (optional, can be turned off)
Suggested Stop Loss: A composite SL calculated from multiple support/resistance layers:
- UT trailing line
- Supertrend level
- VWAP
- Swing structure (recent lows/highs)
- Long-term MA (200)
- ATR-based floor
Take Profit Lines: TP1, TP1.5, TP2, TP3 based on R-multiples. When price touches a TP, it's marked with a checkmark and the line freezes for audit trail purposes.
Status Messages: "SL Touched ❌" or "SL Frozen" when the trade leg completes.
How UT Bot Differs from Other ATR Systems:
Multiple Filters Available: You can require 2-bar confirmation, minimum % price change, swing structure alignment, or ZLSMA directional filter. Most UT implementations have none of these.
Smart SL Calculation: Instead of just using the UT line as your stop, the indicator suggests a better SL based on actual support/resistance. This prevents getting stopped out by wicks while keeping risk controlled.
Visual Audit Trail: All SL/TP lines freeze when touched with clear markers. You can review your trades weeks later and see exactly where entries, stops, and targets were.
Performance Options: "Draw UT visuals only on bar close" lets you reduce rendering load without affecting logic or alerts - critical for slower machines or 1m charts.
Trading Logic:
UT Bot flips direction (Buy or Sell signal appears)
Check Bias Table for multi-timeframe confirmation
Optional: Wait for Base signal or candlestick pattern
Enter at signal bar close or next bar open
Place stop at "Suggested Stop Loss" line
Scale out at TP levels (TP1, TP2, TP3)
Exit remaining position on opposite UT signal or stop hit
---
5. UNDERSTANDING THE MARKET BIAS TABLE
This is the indicator's unique multi-timeframe intelligence layer. Instead of looking at one chart at a time, the table aggregates signals across seven timeframes plus macro trend bias.
Why Multi-Timeframe Analysis Matters:
Professional traders check higher and lower timeframes for context:
Is the 1h uptrend aligning with my 5m entry?
Are all short-term timeframes bullish or just one?
Is the daily trend supportive or fighting me?
Doing this manually means opening multiple charts, checking each indicator, and making mental notes. The Bias Table does it automatically in one glance.
Table Structure:
Header Row:
On intraday charts: 1m, 5m, 15m, 30m, 1h, 2h, 4h (toggle which ones you want)
On daily+ charts: D, W, M (automatic)
Green dot next to title = live updating
Headline Rows - Macro Bias:
These show broad market direction over longer periods:
3 Day Bias: Trend over last 3 trading sessions (uses 1h data)
Weekly Bias: Trend over last 5 trading sessions (uses 4h data)
Monthly Bias: Trend over last 30 daily bars
Quarterly Bias: Trend over last 13 weekly bars
VIX Fear Index: Market regime based on VIX level - bullish when low, bearish when high
Opening Range Breakout: Status of price vs. session open range (intraday only)
These rows show text: "BULLISH", "BEARISH", or "NEUTRAL"
Indicator Rows - Technical Signals:
These evaluate your configured indicators across all active timeframes:
Fast MA > Medium MA (shows your actual MA settings, e.g., "EMA 10 > SMA 20")
Price > Long MA (e.g., "Price > SMA 200")
Price > VWAP
MACD > Signal
Supertrend (up/down/neutral)
ZLSMA Rising
RSI In Zone
ADX ≥ Minimum
These rows show emojis: GREEB (bullish), RED (bearish), GRAY/YELLOW (neutral/NA)
AVG Column:
Shows percentage of active timeframes that are bullish for that row. This is the KEY metric:
AVG > 70% = strong multi-timeframe bullish alignment
AVG 40-60% = mixed/choppy, no clear trend
AVG < 30% = strong multi-timeframe bearish alignment
How to Use the Table:
For a long trade:
Check AVG column - want to see > 60% ideally
Check headline bias rows - want to see BULLISH, not BEARISH
Check VIX row - bullish market regime preferred
Check ORB row (intraday) - want ABOVE for longs
Scan indicator rows - more green = better confirmation
For a short trade:
Check AVG column - want to see < 40% ideally
Check headline bias rows - want to see BEARISH, not BULLISH
Check VIX row - bearish market regime preferred
Check ORB row (intraday) - want BELOW for shorts
Scan indicator rows - more red = better confirmation
When AVG is 40-60%:
Market is choppy, mixed signals. Either stay out or reduce position size significantly. These are low-probability environments.
Unique Features:
Dynamic Labels: Row names show your actual settings (e.g., "EMA 10 > SMA 20" not generic "Fast > Slow"). You know exactly what's being evaluated.
Customizable Rows: Turn off rows you don't care about. Only show what matters to your strategy.
Customizable Timeframes: On intraday charts, disable 1m or 4h if you don't trade them. Reduces calculation load by 20-40%.
Automatic HTF Handling: On Daily/Weekly/Monthly charts, the table automatically switches to D/W/M columns. No configuration needed.
Performance Smart: "Hide BIAS table on 1D or above" option completely skips all table calculations on higher timeframes if you only trade intraday.
---
6. CANDLESTICK PATTERN RECOGNITION
The indicator automatically detects six major reversal patterns and marks them with emojis at the relevant bars.
Why These Six Patterns:
These are the most statistically significant reversal patterns according to trading literature:
High win rate when appearing at support/resistance
Clear visual structure (not subjective)
Work across all timeframes and assets
Studied extensively by institutions
The Patterns:
Bullish Patterns (appear at bottoms):
Bullish Engulfing: Green candle completely engulfs prior red candle's body. Strong reversal signal.
Hammer: Small body with long lower wick (at least 2× body size). Shows rejection of lower prices by buyers.
Morning Star: Three-candle pattern (large red → small indecision → large green). Very strong bottom reversal.
Bearish Patterns (appear at tops):
Bearish Engulfing: Red candle completely engulfs prior green candle's body. Strong reversal signal.
Shooting Star: Small body with long upper wick (at least 2× body size). Shows rejection of higher prices by sellers.
Evening Star: Three-candle pattern (large green → small indecision → large red). Very strong top reversal.
Interactive Tooltips:
Unlike most pattern indicators that just draw shapes, this one is educational:
Hover your mouse over any pattern emoji
A tooltip appears explaining: what the pattern is, what it means, when it's most reliable, and how to trade it
No need to memorize - learn as you trade
Noise Filter:
"Min candle body % to filter noise" setting prevents false signals:
Patterns require minimum body size relative to price
Filters out tiny candles that don't represent real buying/selling pressure
Adjust based on asset volatility (higher % for crypto, lower for low-volatility stocks)
How to Trade Patterns:
Patterns are NOT standalone entry signals. Use them as:
Confirmation: UT Bot gives signal + pattern appears = stronger entry
Reversal Warning: In a trade, opposite pattern appears = consider tightening stop or taking profit
Support/Resistance Validation: Pattern at key level (PDH, VWAP, MA 200) = level is being respected
Best combined with:
UT Bot or Base signal in same direction
Bias Table alignment (AVG > 60% or < 40%)
Appearance at obvious support/resistance
---
7. VISUAL TOOLS AND FEATURES
VWAP (Volume Weighted Average Price):
Session-anchored VWAP with standard deviation bands. Shows institutional "fair value" for the trading session.
Anchor Options: Session, Day, Week, Month, Quarter, Year. Choose based on your trading timeframe.
Bands: Up to three pairs (X1, X2, X3) showing statistical deviation. Price at outer bands often reverses.
Auto-Hide on HTF: VWAP hides on Daily/Weekly/Monthly charts automatically unless you enable anchored mode.
Use VWAP as:
Directional bias (above = bullish, below = bearish)
Mean reversion levels (outer bands)
Support/resistance (the VWAP line itself)
Previous Day High/Low:
Automatically plots yesterday's high and low on intraday charts:
Updates at start of each new trading day
Theme-aware colors (dark text for light charts, light text for dark charts)
Hidden automatically on Daily/Weekly/Monthly charts
These levels are critical for intraday traders - institutions watch them closely as support/resistance.
Opening Range Breakout (ORB):
Tracks the high/low of the first 5, 15, 30, or 60 minutes of the trading session:
Customizable session times (preset for NYSE, LSE, TSE, or custom)
Shows current breakout status in Bias Table row (ABOVE, BELOW, INSIDE, BUILDING)
Intraday only - auto-disabled on Daily+ charts
ORB is a classic day trading strategy - breakout above opening range often leads to continuation.
Extra Labels:
Change from Open %: Shows how far price has moved from session open (intraday) or daily open (HTF). Green if positive, red if negative.
ADX Badge: Small label at bottom of last bar showing current ADX value. Green when above your minimum threshold, red when below.
RSI Badge: Small label at top of last bar showing current RSI value with zone status (buy zone, sell zone, or neutral).
These labels provide quick at-a-glance confirmation without needing separate indicator windows.
---
8. HOW TO USE THE INDICATOR
Step 1: Add to Chart
Load the indicator on your chosen asset and timeframe
First time: Everything is enabled by default - the chart will look busy
Don't panic - you'll turn off what you don't need
Step 2: Start Simple
Turn OFF everything except:
UT Bot labels (keep these ON)
Bias Table (keep this ON)
Moving Averages (Fast and Medium only)
Suggested Stop Loss and Take Profits
Hide everything else initially. Get comfortable with the basic UT Bot + Bias Table workflow first.
Step 3: Learn the Core Workflow
UT Bot gives a Buy or Sell signal
Check Bias Table AVG column - do you have multi-timeframe alignment?
If yes, enter the trade
Place stop at Suggested Stop Loss line
Scale out at TP levels
Exit on opposite UT signal
Trade this simple system for a week. Get a feel for signal frequency and win rate with your settings.
Step 4: Add Filters Gradually
If you're getting too many losing signals (whipsaws in choppy markets), add filters one at a time:
Try: "Require 2-Bar Trend Confirmation" - wait for 2 bars to confirm direction
Try: ADX filter with minimum threshold - only trade when trend strength is sufficient
Try: RSI pullback filter - only enter on pullbacks, not chasing
Try: Volume filter - require above-average volume
Add one filter, test for a week, evaluate. Repeat.
Step 5: Enable Advanced Features (Optional)
Once you're profitable with the core system, add:
Supertrend for additional trend confirmation
Candlestick patterns for reversal warnings
VWAP for institutional anchor reference
ORB for intraday breakout context
ZLSMA for low-lag trend following
Step 6: Optimize Settings
Every setting has a detailed tooltip explaining what it does and typical values. Hover over any input to read:
What the parameter controls
How it impacts trading
Suggested ranges for scalping, day trading, and swing trading
Start with defaults, then adjust based on your results and style.
Step 7: Set Up Alerts
Right-click chart → Add Alert → Condition: "Luxy Momentum v6" → Choose:
"UT Bot — Buy" for long entries
"UT Bot — Sell" for short entries
"Base Long/Short" for filtered MA cross signals
Optionally enable "Send real-time alert() on UT flip" in settings for immediate notifications.
Common Workflow Variations:
Conservative Trader:
UT signal + Base signal + Candlestick pattern + Bias AVG > 70%
Enter only at major support/resistance
Wider UT sensitivity, multiple filters
Aggressive Trader:
UT signal + Bias AVG > 60%
Enter immediately, no waiting
Tighter UT sensitivity, minimal filters
Swing Trader:
Focus on Daily/Weekly Bias alignment
Ignore intraday noise
Use ORB and PDH/PDL less (or not at all)
Wider stops, patient approach
---
9. PERFORMANCE AND OPTIMIZATION
The indicator is optimized for speed, but with 15+ features running simultaneously, chart load time can add up. Here's how to keep it fast:
Biggest Performance Gains:
Disable Unused Timeframes: In "Time Frames" settings, turn OFF any timeframe you don't actively trade. Each disabled TF saves 10-15% calculation time. If you only day trade 5m, 15m, 1h, disable 1m, 2h, 4h.
Hide Bias Table on Daily+: If you only trade intraday, enable "Hide BIAS table on 1D or above". This skips ALL table calculations on higher timeframes.
Draw UT Visuals Only on Bar Close: Reduces intrabar rendering of SL/TP/Entry lines. Has ZERO impact on logic or alerts - purely visual optimization.
Additional Optimizations:
Turn off VWAP bands if you don't use them
Disable candlestick patterns if you don't trade them
Turn off Supertrend fill if you find it distracting (keep the line)
Reduce "Limit to 10 bars" for SL/TP lines to minimize line objects
Performance Features Built-In:
Smart Caching: Higher timeframe data (3-day bias, weekly bias, etc.) updates once per day, not every bar
Conditional Calculations: Volume filter only calculates when enabled. Swing filter only runs when enabled. Nothing computes if turned off.
Modular Design: Every component is independent. Turn off what you don't need without breaking other features.
Typical Load Times:
5m chart, all features ON, 7 timeframes: ~2-3 seconds
5m chart, core features only, 3 timeframes: ~1 second
1m chart, all features: ~4-5 seconds (many bars to calculate)
If loading takes longer, you likely have too many indicators on the chart total (not just this one).
---
10. FAQ
Q: How is this different from standard UT Bot indicators?
A: Standard UT Bot (originally by @QuantNomad) is just the ATR trailing line and flip signals. This implementation adds:
- Volume weighting and momentum adjustment to the trailing calculation
- Multiple confirmation filters (swing, %, 2-bar, ZLSMA)
- Smart composite stop loss system from multiple S/R layers
- R-multiple take profit system with freeze-on-touch
- Integration with multi-timeframe Bias Table
- Visual audit trail with checkmarks
Q: Can I use this for automated trading?
A: The indicator is designed for discretionary trading. While it has clear signals and alerts, it's not a mechanical system. Context and judgment are required.
Q: Does it repaint?
A: No. All signals respect bar close. UT Bot logic runs intrabar but signals only trigger on confirmed bars. Alerts fire correctly with no lookahead.
Q: Do I need to use all the features?
A: Absolutely not. The indicator is modular. Many profitable traders use just UT Bot + Bias Table + Moving Averages. Start simple, add complexity only if needed.
Q: How do I know which settings to use?
A: Every single input has a detailed tooltip. Hover over any setting to see:
What it does
How it affects trading
Typical values for scalping, day trading, swing trading
Start with defaults, adjust gradually based on results.
Q: Can I use this on crypto 24/7 markets?
A: Yes. ORB will not work (no defined session), but everything else functions normally. Use "Day" anchor for VWAP instead of "Session".
Q: The Bias Table is blank or not showing.
A: Check:
"Show Table" is ON
Table position isn't overlapping another indicator's table (change position)
At least one row is enabled
"Hide BIAS table on 1D or above" is OFF (if on Daily+ chart)
Q: Why are candlestick patterns not appearing?
A: Patterns are relatively rare by design - they only appear at genuine reversal points. Check:
Pattern toggles are ON
"Min candle body %" isn't too high (try 0.05-0.10)
You're looking at a chart with actual reversals (not strong trending market)
Q: UT Bot is too sensitive/not sensitive enough.
A: Adjust "Sensitivity (Key×ATR)". Lower number = tighter stop, more signals. Higher number = wider stop, fewer signals. Read the tooltip for guidance.
Q: Can I get alerts for the Bias Table?
A: The Bias Table is a dashboard for visual analysis, not a signal generator. Set alerts on UT Bot or Base signals, then manually check Bias Table for confirmation.
Q: Does this work on stocks with low volume?
A: Yes, but turn OFF the volume filter. Low volume stocks will never meet relative volume requirements.
Q: How often should I check the Bias Table?
A: Before every entry. It takes 2 seconds to glance at the AVG column and headline rows. This one check can save you from fighting the trend.
Q: What if UT signal and Base signal disagree?
A: UT Bot is more aggressive (ATR trailing). Base signals are more conservative (MA cross + filters). If they disagree, either:
Wait for both to align (safest)
Take the UT signal but with smaller size (aggressive)
Skip the trade (conservative)
There's no "right" answer - depends on your risk tolerance.
---
FINAL NOTES
The indicator gives you an edge. How you use that edge determines results.
For questions, feedback, or support, comment on the indicator page or message the author.
Happy Trading!

Session Range Breakouts With Targets [AlgoAlpha]⛓️💥Session Range Breakouts With Targets 🚀
Introducing the "Session Range Breakouts With Targets" indicator by AlgoAlpha, a powerful tool for traders to capitalize on session-based range breakouts and identify precise target zones using ATR-based calculations! Whether you trade the Asian, American, European, or Oceanic sessions, this script highlights key breakout levels and targets that adapt to market volatility, ensuring you're always prepared for those crucial price movements. 🕒📊
Session-based Trading : The indicator highlights session-specific ranges, offering clear breakouts for Asian, American, European, Oceanic, and even custom sessions 🌍.
Adaptive Volatility Zones : Uses ATR to determine dynamic zone widths, filtering out fakeouts and adjusting to market conditions ⚡.
Precise Take-Profit Targets : Set multiple levels of take-profits based on ATR multipliers, ensuring you can manage both aggressive and conservative trades 🎯.
Customizable Appearance : Tailor the look with customizable colors for session highlights and breakout zones to fit your chart style 🎨.
Alerts on Key Events : Built-in alert conditions for breakouts and take-profit hits, so you never miss a trading opportunity 🔔.
🚀 Quick Guide to Using the Indicator
🛠 Add the Indicator : Add the indicator to favorites by pressing the star icon. Choose your session (Asia, America, Europe, Oceana, or Custom) and adjust the ATR length, zone width multiplier, and target multipliers to suit your strategy.
📊 Analyze Breakouts : Watch for the indicator to plot upper and lower range boxes based on session highs and lows. Price breaking through these boxes will signal a potential entry.
📈 Monitor Targets : Track bullish and bearish targets as price moves, with up to three take-profit levels based on ATR multipliers.
🔔 Set Alerts : Enable alerts for session breakouts or when price hits your designated take-profit targets.
🔍 How It Works
This script operates by identifying session-specific ranges based on highs and lows from the beginning of the selected session (Asia, America, Europe, or others). After a user-defined wait period (default: 120 bars), it calculates the highest and lowest points and creates upper and lower zones using the Average True Range (ATR) to adapt to market volatility. If the price breaks above or below these zones, it is identified as a breakout, and the script dynamically calculates up to three take-profit targets for both bullish and bearish scenarios using an ATR multiplier. The indicator also includes alerts for breakouts and take-profit hits, providing real-time trading signals.

Machine Learning Breakouts (from Pivots)I developed the 'Machine Learning Breakouts (from Pivots)' indicator to revolutionize the way we detect breakout opportunities and follow trend, harnessing the power of pivot points and machine learning. This tool integrates the k-Nearest Neighbors (k-NN) method with the Euclidean distance algorithm, meticulously analyzing pivot points to accurately forecast multiple breakout paths/zones. "ML Pivots Breakouts" is designed to identify and visually alert traders on bullish breakouts above high lines and bearish breakouts below low lines, offering essential insights for breakout and trend follower traders.
For traders, the instruction is clear: a bullish breakout signal is given when the price crosses above the forecasted high line, indicating potential entry points for long positions. Conversely, a bearish breakout signal is provided when the price breaks below the forecasted low line, suggesting opportunities to enter short positions. This makes the indicator a vital asset for navigating through market volatilities and capitalizing on emerging trends, designed for both long and short strategies and adeptly adapting to market shifts.
In this indicator I operate in a two-dimensional space defined by price and time. The choice of Euclidean distance as the preferred method for this analysis hinges on its simplicity and effectiveness in measuring and predicting straight-line distances between points in this space.
The Machine Learning Breakouts (from Pivots) Indicator calculations have been transitioned to the MLPivotsBreakouts library, simplifying the process of integration. Users can now seamlessly incorporate the "breakouts" function into their scripts to conduct detailed momentum analysis with ease.
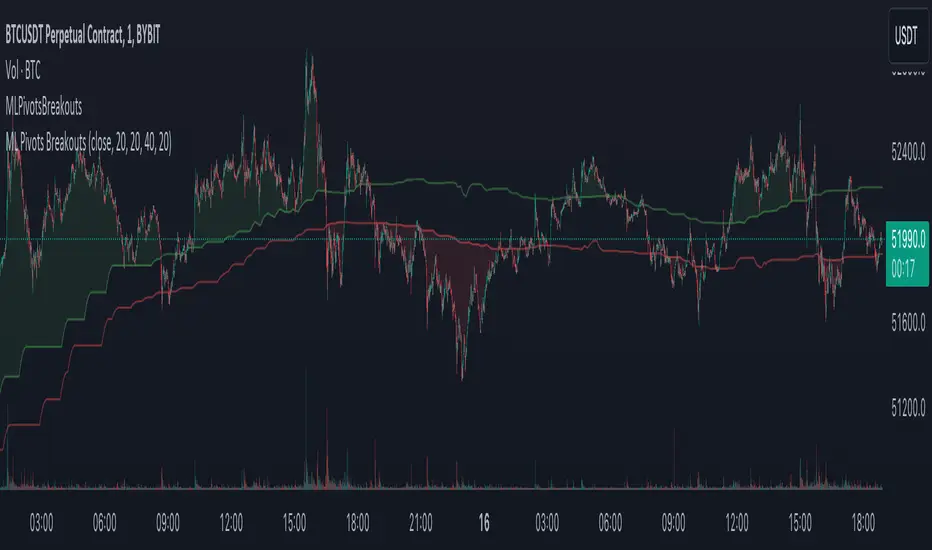
Bollinger Bands Breakout Oscillator [LuxAlgo]The Bollinger Bands Breakout Oscillator is an oscillator returning two series quantifying the significance of breakouts between the price and the extremities of the Bollinger Bands indicator.
Settings
Length: Period of the Bollinger Bands indicator
Mult: Controls the width of the Bollinger Bands
Src: Input source of the indicator
Usage
Each series is calculated by summing the distance between price and a respective Bollinger Bands extremity in the case price is outside this extremity and divided by the sum of the absolute distance between price and a respective extremity. This sum is done over the most recent Length bars.
Bullish breakouts are represented by the green areas of the indicator, while bearish breakouts are represented by the red areas of the indicator.
The oscillator can determine the presence of an uptrend when the bullish area is superior to the bearish area, while a downtrend is indicated by a bearish area being superior to the bullish one. The significance of the breakout is determined by the amplitude of each area, with higher amplitudes indicating more significant breakouts or strong trends.
Using higher Mult values would naturally return wider bands, which would induce less frequent breakouts, this would be highlighted by the oscillator.
In the chart above we can see the oscillator using a multiplicative factor of 2.

L1 Breakout IndicatorLevel: 1
Background
A breakout refers to when the price of an asset moves above a resistance area or below a support area. Breakouts indicate that the price may be trending in the direction of the breakout.
Function
L1 Breakout Indicator utilizes highest() and lowest() functions to define breakout levels. Use ema() to draw a trade line to detect the distance to breakout points. By doing that, you will know whether is overbought or oversold. Then, by applying a set of simple threshold inputs, you can locate the long and short entries points.
Key Signal
trade line and its lag version
Pros and Cons
Pros:
1. Simple but powerful to know overbought and oversold regions
2. Flexible input threshold values to adapt various market conditions
Cons:
1. It may satruate for extreme conditions of long and short.
2. Multiple long and short entries may be generated.
Remarks
Just simple
Readme
In real life, I am a prolific inventor. I have successfully applied for more than 60 international and regional patents in the past 12 years. But in the past two years or so, I have tried to transfer my creativity to the development of trading strategies. Tradingview is the ideal platform for me. I am selecting and contributing some of the hundreds of scripts to publish in Tradingview community. Welcome everyone to interact with me to discuss these interesting pine scripts.
The scripts posted are categorized into 5 levels according to my efforts or manhours put into these works.
Level 1 : interesting script snippets or distinctive improvement from classic indicators or strategy. Level 1 scripts can usually appear in more complex indicators as a function module or element.
Level 2 : composite indicator/strategy. By selecting or combining several independent or dependent functions or sub indicators in proper way, the composite script exhibits a resonance phenomenon which can filter out noise or fake trading signal to enhance trading confidence level.
Level 3 : comprehensive indicator/strategy. They are simple trading systems based on my strategies. They are commonly containing several or all of entry signal, close signal, stop loss, take profit, re-entry, risk management, and position sizing techniques. Even some interesting fundamental and mass psychological aspects are incorporated.
Level 4 : script snippets or functions that do not disclose source code. Interesting element that can reveal market laws and work as raw material for indicators and strategies. If you find Level 1~2 scripts are helpful, Level 4 is a private version that took me far more efforts to develop.
Level 5 : indicator/strategy that do not disclose source code. private version of Level 3 script with my accumulated script processing skills or a large number of custom functions. I had a private function library built in past two years. Level 5 scripts use many of them to achieve private trading strategy.