Bar colour BreakoutIndicator that changes the colour of the bars depending on the breakout of the high or the low of the previous bar. A lime bar indicates a bar that has a higher high than the previous one. A fuchsia bar indicates a bar that has a lower low than the previous bar. A yellow bar indicates an outside bar (higher high and lower low than the previous one). A blue bar indicates an inside bar (lower high and higher low).
Cari dalam skrip untuk "breakout"

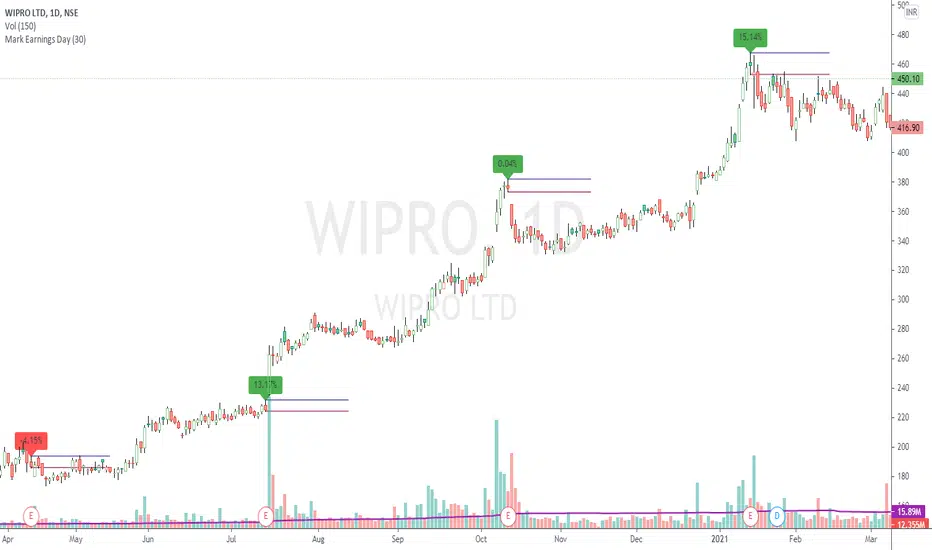
Mark Earnings DayThe idea for today is to plot high / low prices on the Earnings day. (use only on Daily timeframe)
And as we all know, most of the times, price is unidirectional after the earnings are declared.
A target of 1:2 or even 1:5 can be easily achieved in these cases, within few days.
Green label indicates, reported earnings are higher than estimated. Red indicates the other way.
But 1, this does not necessarily indicate the trend direction.
But 2, a breakout / breakdown of this day's candle mostly does. The other serving as a Stop Loss.
Optionally, the scripts can also plot splits and dividends on the charts.
The difference between this indicator and readily available default markings on the chart is,
these figures are directly available on the chart itself, that saves multiple clicks.
Trend ResumptionWe again keep it really simple.
This indicator just plots the combination of RGRR and GRGG candlesticks. (R = Red / Bearish, G = Green / Bullish)
When either pattern occurs, trade the combined high and combined low of recent 2 RR or recent 2 GG candles. I.e.,
Buy above GG's high with SL at GG's low.
Sell below RR's low with SL at RR's high.
Refer the shared chart for example. The signals were plotted on both the sides, and wherever triggered - gave rewards.
Only 1 at 05-Apr, 10:50 a.m. did not trigger, but that must then be ignored. Do not hurry to enter the trade, wait for breakout / breakdown above combined high / low.

Donchian Channels Trending Breakout StrategyThis script looks for two entry signals. Long is when the previous breakout of the donchian channels was a low, price is above the input EMA, current price is equal or higher than the upper band and we're not in a position yet. Short is the other way around, so previous breakout of the donchian channels was a high, price is below the input EMA, current price is equal or lower than the lower band.
I haven't found a script that does take the previous highs and lows into consideration. Works for any markets in any conditions because the stop loss and profit targets are based on the upper and lower band of the donchian channels, which means the stop loss and profit targets move with the trend.
For more details see the script itself, I wrote a ton of comments.

Box Range AlertSimple Script for getting alerts on the crossing of Upper & Lower levels either way.
Good for Free users as they can only use 1 alert at a time. So this indicator will be useful to get alerts on both Breakout Or Breakdowns.
Just add input Price manually and set alerts.

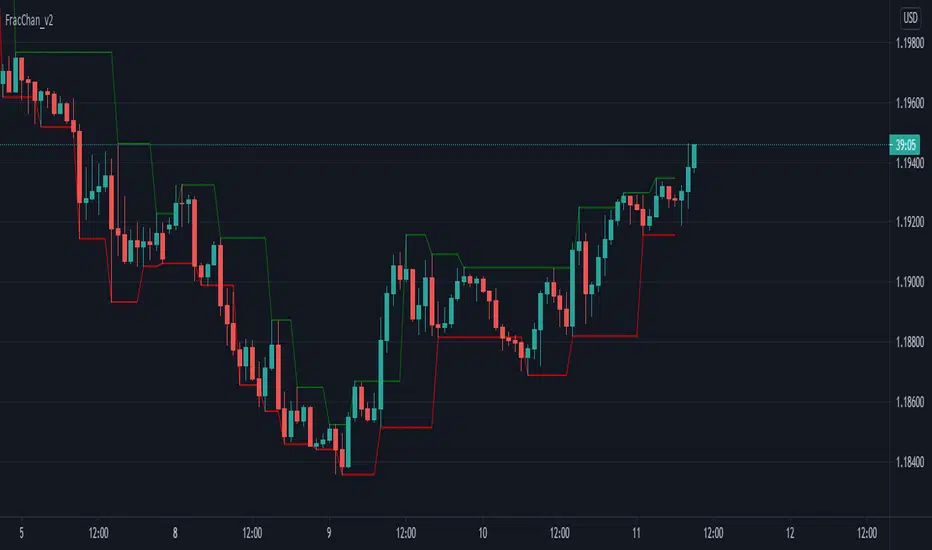
Fractal Channel v2Just another way of visualizing Williams' Fractals: they are now joined in a channel.
You can also create a channel of Fractals from another time frame than the current.
Great for identifying breakout entries, trend direction analysis (i.e. easily visualize Higher Lows, Higher Highs, Lower Lows, Lower Highs) or to trail your Stop Losses.
Version 2 of the Fractal Channel now correctly identifies William's Fractals when the High/Low of the 'Fractal Candle' is equal to the High/Low of the neighbouring 2 candles on both sides.
LAGging span leaves Bollinger Bands strategyAbstract
This script points out the positions a lagging span leaves a Bollinger Band.
This script does not plot a lagging span but moves the Bollinger Band forward.
You can find profit opportunities by combining this script and risk management.
Introduction
Bollinger Bands is a popular indicator.
It contains a moving average, an upper band and a lower band.
The moving average can indicate trend, the upper band and the lower band can indicate if the price is far away from the moving average.
However, in trading markets, anything can happen.
Both continuation and reversal are possible when the price touches the moving average, the upper band or the lower band.
Therefore, many traders adjust the parameters of the Bollinder Band or add other indicators to improve their trading strategies.
@Daveatt et. al. provided an idea that uses a lagging span.
A lagging span is a line chart. It displays the reference price but in earlier time.
For example, if the offset of a lagging span is 26 days, the value of the lagging span on 29 days ago is the reference price 3 days ago.
A lagging span is a part of Ichimoku Cloud.
It can compare the price to the earlier price and the values of indicators in the past.
To compare the price to the values of indicators in the past, we can also shift indicators forward instead of adding a lagging span into the chart.
This script uses shift-the-indicators-forward method.
In other words, this script plots the Bollinger Band forward so that the price can be compared to the values of the Bollinger Band in the past.
Computing and Adjusting
(1) Compute Moving Average
(2) Compute Standard Derivation
(3) Upper Band = Moving Average + Standard Derivation * Multi
(4) Lower Band = Moving Average - Standard Derivation * Multi
(5) Shift the Bollinger Band forward according to the offset parameter.
(6) Mark the points the price leaves the shifted Bollinger Band
(7) Compute the most possible loss and profit before the next opposite signal.
Parameters
source : the data for computing the bollinger band. can be open, high, low, close or their combination.
length : how many days are calculated by the bollinger band
mult : the distance from the moving average to the upper band and the distance from the moving average to the upper band is equal to ( mult * standard derivation ) .
x_offset : the offset of the lagging span
Conclusion
This script can find signals for potential breakout or trend continuation.
If you want to use this signal well, you need to know when to cut loss and protect the profit.
Reference
@Daveatt , Bollinger bands/Lagging span cross , BGyrPgOA , Tradingview 2019
How to trade with Bollinger Bands
How to use Ichimoku Cloud
How to trade with a line chart

London Breakout/Session GBP/USD Forex DaytradeThis is a forex strategy suited for day traders, specialized in the london breakout session
The key elements for this strategy are the specific london time session, together with an exit time(before asian trade/at the end of new york session).
At the same time, as logic elements we only use price action inside like :
For long we have 3 ascending candles, and for short we have 3 descending candles.
For exit we have both TP/SL based on price percentage movement, or we exit if we reach the end of the day.
If you have any questions message me in private !

Stock Market Strategy : VWAP, MACD, EMA, Breakout, BBHello there,
Today I bring you a stock market strategy, specialized in NASDAQ stocks.
Its a daytrading strategy, that can only do a max of 1 trade per day. In this case it only trades the first 2 opening hours of the market.
The rules are simple :
We follow the trend based on a big EMA, in this case 200, after that, we check for VWAP direction , then, we check histogram from MACD. This is the simple logic of the strategy.
Inside there is another strategy, that not just do the above, but also uses Bollinger bands, and checks for breakout of bottom or top line. Also it uses Average directional Index, for even a bigger criteria .
So for example a long condition it would be : candle is above the ema, and candle is above vwap, and histogram is positive, and candle break the top bb level and ADI < 40 -> long signal . The opposite works for short(ADI > 20).
In this case all this criterias are between the first 2 hours of market. So we enter between the first hour, and exit in the next hour. For this we need to use very short time frames.
Hope you enjoy it.
Let me know if you have any questions

London breakout GBPUSD daytradeHello,
First I want to WARN THAT YOU NEED A MINIMUM OF 30X LEVERAGE FOR THIS STRATEGY IN ORDER TO WORK.
THE REASON IS THAT THE SIZE IS CALCULATED BASED ON A VERY SHORT STOP LOSS LEVEL IN PIPS
UTILIZE IT AT YOUR OWN RISK
This is a daytrading strategy, that's suited for GBPUSD 1H timechart.
It a very simple strategy that utilizes 2 moving averages : a very fast one and a very slow one.
It will always enter only at the beginning candle of London session, and it will always exit at the candle at the finish of London session.
So the rules are simple :
If its 8 am GMT and the candle close or high cross the slow moving average and we are above at the same over the slow moving average we make a long movement. The oposite condition is applied for short.
At the same time we always use a very small stop loss = 50-100 points ( 5-10 pips).
We dont have a take profit, in our case the trade ends always at the end of London session. In this case at 15h GMT
It might work on other currencies aswell, but it has to be tested first.
For any questions or suggestions, please let me know.

London Open Range Breakout by KviateqThis script is what I currently use to day trade forex on a 5-minute timeframe.
The script features Multi-timeframe EMA20 that uses timeframe multipliers and is smoother by the factor by which you're multiplying your current timeframe.
Default settings are set to display EMA20 on the current (M5) timeframe, as well as M15, H1, H4 and D1 timeframes.
The background color changes intensity based on how many conditions are met - are all EMAs in the right order, is the current close above/below all the EMAs.
Featured is also a range set to 1 hour since the London breakout (can be changed to M15, or however long you'd like - my current setting is 30 minute).
Also featured are levels that I find to be of most importance - such as Daily and Weekly Open, Previous Day's and Week's Highs.
The idea is to only take trades when all stars align - EMAs, break above/below the Opening Range and not to long/short into an important level.

Monster Breakout Index V2Brief Description:
Monster Breakout Index V2 is a the successor to Monster Breakout Index, an indicator I published on May 13, 2020.
Like it's predecessor, MBI V2 gives high quality signals and is incredibly robust at preventing you from trading sideways/consolidating markets.
------------------------------------------------------------------------------------------------------------------------------------------------------------------
Interpreting Signals:
Green = Buy
Red = Sell
------------------------------------------------------------------------------------------------------------------------------------------------------------------
Calculation:
1) Calculate the median price of each bar over n periods. Determine the highest & lowest medians.
2) Current bar's high > highest median? -----Yes = Buy signal
3) Current bar's low < lowest median? -------Yes = Sell signal
Note: Occasionally, the indicator will simultaneously produce both a buy & sell signal. Because of this, it is recommended you use at least one other indicator in conjunction with this one...OR alternatively, ignore this double signal.
------------------------------------------------------------------------------------------------------------------------------------------------------------------
Enjoy ;)
Long Term Breakout entry + 25% Trailing stopThis script enters on a long term breakout and exits using a 25% trailing stop

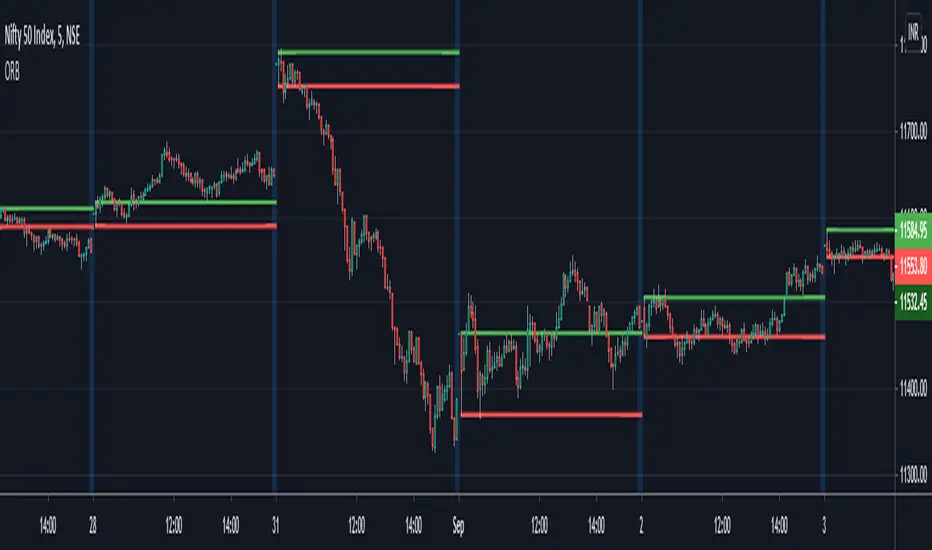
ORB - Opening Range BreakoutThis script plots the high/low of any custom session and extends it until the daily close. It does not show on the timeframe higher than the length of custom opening session by default.
The time period of opening range & the max timeframe to display it on can be adjusted from the settings.
So for eg. if want to use 5m ORB to trade, then set "ORB total time" as 5min & "Session Time" as whatever is the opening 5mins time period of ticker that are trading.
365 Day High Breakout StrategySCRIPT NOTES
- Strategy consists of 3 parameters :-
1. BUY on 365 day breakout (250 days taken in back-testing instead of 365 days considering weekends and other holidays in a year)
2. Moving averages (Noise Filtering condition )
3. RELATIVE STRENTH indicator (Original Author - tradingview.com ) (Noise Filtering condition )
- Strategy works better on low volatile stocks.
- This strategy is for self improvement and concept sharing purpose only.
- Trading (including profit/loss) using this strategy is completely user's responsibility.

3 Bar Triangle Breakout////Current bar's High is less than the 3rd bar's High///
/// and Current bar's Low to be higher the 3rd bar's Low.////
////This then predicts the market might breakout to new levels ////
///within 2-3 of the next coming bars///
////Entry occurs when have two inside days and close break candle three high or low//
//If need more information recommend google search/////
I have coded when candle conducts breakout the formation above is the setup criteria !!

CPR BREAKOUT STRATEGY by ganeshCPR BUY STRATEGY:
This is buy only strategy for stocks for breakout play
Rules :
buy above yellow line with sl of red line tgt green line
with previous day high los close ploted

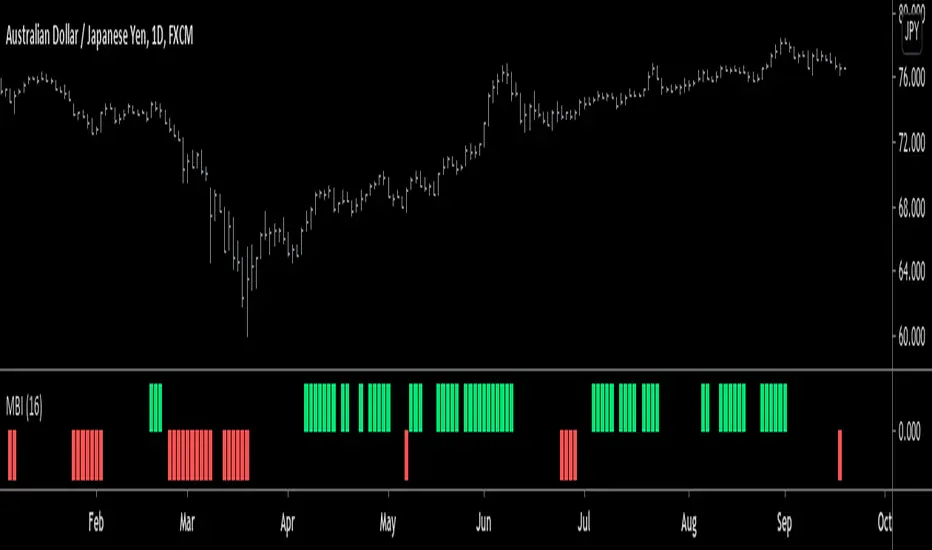
Monster Breakout IndexThis is the coolest indicator I have ever made to date so far.
The Monster Breakout Index is a completely original idea that I came up with.
MBI is a breakout indicator with one parameter. MBI lives up to its name because of how robust the index is. It gives very little signals, which means that the signals that it does generate are very high quality.
How to Interpret:
Green - Buy
Red - Sell
Would you like to know how this indicator works?
Of course you do! Well here it is...(in steps):
1) Calculate the median price (hl2 price) of each bar over n periods (n is the parameter).
2) Is the current bar's close higher than the highest median? Yes = Buy signal , No = proceed to step 3
3) Is the current bar's close lower than the lowest median? Yes = Sell signal , No = No signal
Recommended setting: 12
If you found this indicator, good job because its a true force to reckon with, its what I would call.....a monster.
Good luck traders, and hit the like button!

Fractal Breakout StrategyFractal
A type of pattern used in technical analysis to predict a reversal in the current trend. A fractal pattern consists of five bars and is identified when the price meets the following characteristics:
1. A shift from a downtrend to an uptrend occurs when the lowest bar is located in the middle of the pattern and two bars with successively higher lows are positioned around it.
2. A shift from an uptrend to a downtrend occurs when the highest bar is located in the middle of the pattern and two bars with successively lower highs are positioned around it.


BEST Engulfing + Breakout StrategyHello traders
This is a simple algorithm for a Tradingview strategy tracking a convergence of 2 unrelated indicators.
Convergence is the solution to my trading problems.
It's a puzzle with infinite possibilities and only a few working combinations.
Here's one that I like
- Engulfing pattern
- Price vs Moving average for detecting a breakout
Definition
Take out the notebooks :) and some coffee (good for focus). I'm bullish in coffee
The engulfing pattern is a two-candle reversal pattern.
The second candle completely ‘engulfs’ the real body of the first one, without regard to the length of the tail shadows.
The bullish Engulfing pattern appears in a downtrend and is a combination of one red candle followed by a larger green candle
The bearish Engulfing pattern appears in a downtrend and is a combination of one green candle followed by a larger red candle
Example: imgur.com
We're bored sir... what's the point of all this?
In summary, an engulfing is a pattern to track reversals. (the whole TradingView audience stands up now giving a standing ovation)
Adding the Price vs Moving average filters allows to track reversals with momentums (half of the audience collapsed because this is too awesome)
Ok sir... you picked up my interest
I included some cool backtest filters:
- date range filtering
- flexible take profit in USD value (plotted in blue)
- flexible stop loss in USD value (plotted in red)
All the best
Dave

Bollinger Band - Keltner Squeeze - Failed Volatility BreakoutThis simple script provides Bollinger Band and Keltner Channel indicators, and will highlight areas where the Bollinger Bands enter into the Keltner Channel.
This script is based on the Failed Volatility Breakout (FVBO) System used by professional trader ChrisD_Macro. The default plot styles for the indicators in this script are based on Chris's setup, but visual styles as well as BB and Kelt settings (length, standard deviation, etc...) can all be easily customized with the user interface in the indicator settings.
You can also choose whether you want the condition to be triggered by just one Bollinger Band entering the Keltner Channel, or if it has to be both bands entering the channel.
This script is very useful when manually back testing the FVBO strategy, as it clearly highlights the BB-Kelt squeezes instead of having to constantly scroll in and out looking for them.
It can also be useful live as it has the ability to trigger TradingView alerts using the condition "BB-Kelt Squeeze".
Hope it's helpful
- JDC
Side Notes:
With Forex / Currencies this indicator I usually use this indicator on the 1 Day time frame.
Keep in mind that the script includes the Bollinger Bands and Keltner Channels, so if you already have your own version of these indicators on your chart, it will get really messy. (Just hide the other indicators while you get to know this one).

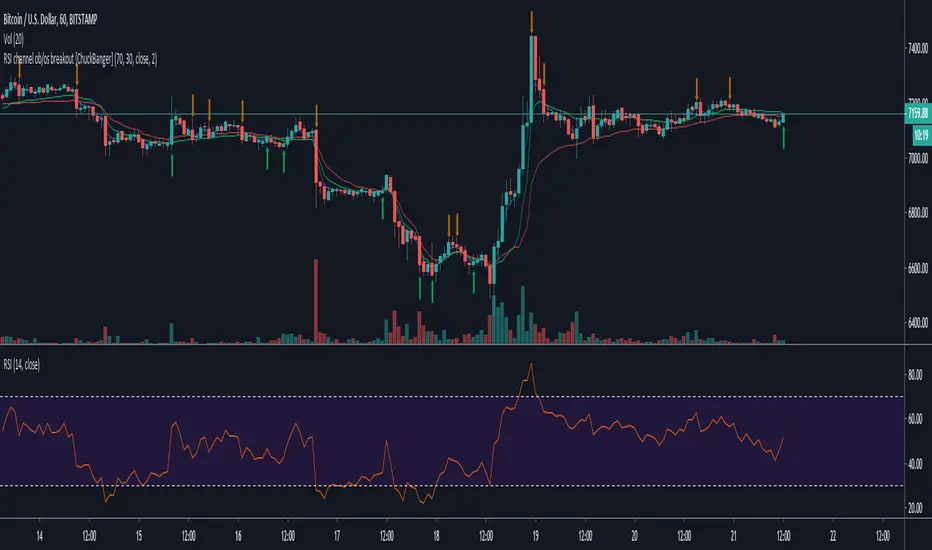
RSI channel ob/os breakout [ChuckBanger]This is a breakout signal script based on reverse engineering of RSI. It shows a channel of overbought and oversold readings that the trader can sett in settings. When low crosses under lower line it shows bullish signal and when high is crossing upper line it shows a bearish signal. The script also has wilder's moving average as filter instead of high/low.
Good luck traders!