Price and Volume Breakout Buy Strategy [TradeDots]The "Price and Volume Breakout Buy Strategy" is a trading strategy designed to identify buying opportunities by detecting concurrent price and volume breakouts over a specified range of candlesticks.
This strategy is optimized for assets demonstrating high volatility and significant momentum spikes.
HOW IT WORKS
The strategy first takes the specific number of candlesticks as the examination window for both price and volume.
These values are used as benchmarks to identify breakout conditions.
A trade is initiated when both the closing price and the trading volume surpass the maximum values observed within the predetermined window.
Price must be above a designated moving average, serving as the trend indicator, ensuring that all trades align with the prevailing market trend.
APPLICATION
This strategy is particularly effective for highly volatile assets such as Bitcoin and Ethereum, capitalizing on the cues from sudden price and volume breakouts indicative of significant market movement, often driven by market smart money traders.
However, for broader markets like the S&P 500, this strategy may be less effective due to less pronounced volume and price shifts compared to the cryptocurrency markets.
DEFAULT SETUP
Commission: 0.01%
Initial Capital: $10,000
Equity per Trade: 70%
Backtest result sometimes gives fewer than 100 trades under certain higher timeframes, as most trades tend to have a long holding period. Entry conditions are also more stringent, which, combined with the relatively brief history of cryptocurrencies, results in fewer trades on longer timeframes.
Users are advised to adjust and personalize this trading strategy to better match their individual trading preferences and style.
RISK DISCLAIMER
Trading entails substantial risk, and most day traders incur losses. All content, tools, scripts, articles, and education provided by TradeDots serve purely informational and educational purposes. Past performances are not definitive predictors of future results.
Cari dalam skrip untuk "breakout"

Range Breakout Signals (Intrabar) [LuxAlgo]The Range Breakout Signals (Intrabar) is a novel indicator highlighting trending/ranging intrabar candles and providing signals when the price breaks the extremities of a ranging intrabar candles.
🔶 USAGE
The indicator highlights candles with trending intrabar prices, with uptrending candles being highlighted in green, and down-trending candles being highlighted in red.
This highlighting is affected by the selected intrabar timeframe, with a lower timeframe returning a more precise estimation of a candle trending/ranging state.
When a candle intrabar prices are ranging the body of the candle is hidden from the chart, and one upper & lower extremities are displayed, the upper extremity is equal to the candle high and the lower extremity to the candle low. Price breaking one of these extremities generates a signal.
The indicator comes with two modes, "Trend Following" and "Reversal", these modes determine the extremities that need to be broken in order to return a signal. The "Trend Following" mode as its name suggests will provide trend-following signals, while "Reversal" will aim at providing early signals suggesting a potential reversal.
🔶 DETAILS
To determine if intrabar prices are trending or ranging we calculate the r-squared of the intrabar data, if the r-squared is above 0.5 it would suggest that lower time frame prices are trending, else ranging.
This approach allows almost obtaining a "settings" free indicator, which is uncommon. The intrabar timeframe setting only controls the intrabar precision, with a timeframe significantly lower than the chart timeframe returning more intrabar data as a result, this however might not necessarily affect the displayed information by the indicator.
🔶 SETTINGS
Intrabar Timeframe: Timeframe used to retrieve the intrabar data within a chart candle. Must be lower than the user chart timeframe.
Auto: Select the intrabar timeframe automatically. This setting is more adapted to intraday charts.
Mode: Signal generation mode.
Filter Out Successive Signals: Allows removing successive signals of the same type, returning a more easily readable chart.

Liquidity Breakout - Strategy [presentTrading]- Introduction and How It Is Different
The Liquidity Breakout Strategy is a unique trading strategy that focuses on identifying and leveraging patterns in market price data. This strategy, mainly inspired by the script "Master Pattern" by LuxAlgo, takes a different approach from many traditional strategies that rely on technical indicators or fundamental analysis. Instead, the Liquidity Breakout is based on the concept of contraction detection and liquidity levels. This approach allows traders to identify potential trading opportunities that other strategies might miss.
BTCUSDT 6h
The strategy is different from other trading strategies because it uses a unique combination of pattern detection, liquidity levels, and user-defined trading direction. This combination allows the strategy to adapt to various market conditions and trading styles, making it a versatile tool for traders.
- Strategy: How It Works
1. Contraction Detection: The strategy uses a lookback period defined by the user (default is 10 bars) to identify contractions in the market. A contraction is a period where the market is consolidating, often followed by a significant price movement. The strategy identifies contractions by finding pivot highs and pivot lows within the lookback period. If a pivot high is lower than the previous pivot high and a pivot low is higher than the previous pivot low, a contraction is detected.
2. liquidity Levels:
What are Liquidity levels? Liquidity levels, also known as liquidity pools or zones, are price levels at which there is a significant amount of trading activity. They are often areas where large institutional traders (like banks or hedge funds) have placed orders. These levels are important because they can act as support or resistance levels, and price often reacts at these levels.
In the context of this strategy, liquidity levels are used to identify potential entry and exit points for trades. When the price reaches a liquidity level, it could indicate a potential trading opportunity. For example, if the price breaks through a liquidity level, it could signal the start of a new trend. On the other hand, if the price approaches a liquidity level and then reverses, it could signal a potential reversal.
The strategy uses these two elements to identify potential trading opportunities. When a contraction is detected, the strategy will look for a breakout in the direction of the trend. If the breakout occurs at a liquidity level, the strategy will execute a trade.
The strategy also allows traders to set their stop loss based on either the Average True Range (ATR) or a fixed percentage. This flexibility allows traders to manage their risk according to their personal risk tolerance and trading style.
- Trade Direction
One of the unique features of the Master Pattern Strategy is the ability to choose the trading direction. Traders can choose to trade in the "Long" direction, the "Short" direction, or "Both". This feature allows traders to adapt the strategy to their personal trading style and market outlook.
For example, if a trader believes that the market is in an uptrend, they can choose to trade only in the "Long" direction. Conversely, if the market is in a downtrend, they can choose to trade only in the "Short" direction. If the trader believes that the market is volatile and there are opportunities in both directions, they can choose to trade in "Both" directions.
- Usage
To use the strategy, traders need to input their preferred settings, including the contraction detection lookback period, liquidity levels, stop loss type, and trading direction. Once these settings are input, the strategy will automatically detect potential trading opportunities and execute trades according to the defined parameters.
- Default Settings
The default settings for the Master Pattern Strategy are as follows:
Contraction Detection Lookback: 10
Liquidity Levels: 20
Stop Loss Type: ATR
ATR Length: 20
ATR Multiplier: 3.0
Fixed Percentage: 0.01
Trading Direction: Both
These settings can be adjusted according to the trader's personal preferences and market conditions. It's recommended that traders experiment with different settings to find the ones that work best for their trading style and goals.

Fibonacci Breakout Target LevelsFibonacci Extension
Fibonacci Extension is a powerful technical analysis tool that traders use to predict where the market might find support and resistance. It is based on the Fibonacci sequence and uses levels that are found by extending the 23.6%, 38.2%, 50%, 61.8%, and 100% Fibonacci ratios from a swing high or low. These levels can be used to find possible areas of support and resistance, and traders often use them to figure out when to get into or get out of a trade.
What does this indicator do?
This indicator gets five levels of the Fibonacci Extension and uses it for both the low and the high. The default lookback period is 10 days, and it checks for the highest and lowest price in that period. Then it calculates the extension levels and plots them, and it also adds a line that shows you the current breakout target levels.
How to use?
The primary use intended for this indicator is to be used to determine possible breakout target levels. Let's say you are trading a range and a breakout happens. You can use this indicator to determine possible take-profit zones and possible support and resistance zones.
Features:
Change the lookback period for the Fibonacci Extension levels.
Disable the Fibonacci Bands if you just want to see the FIB levels.
You can also change the 5 levels and add different Fibonacci numbers.
In this image, you can see how you can use this indicator to determine take-profit levels. The Fibonacci Extensions will determine potential support and resistance levels, which could be good places to exit your long or short positions.

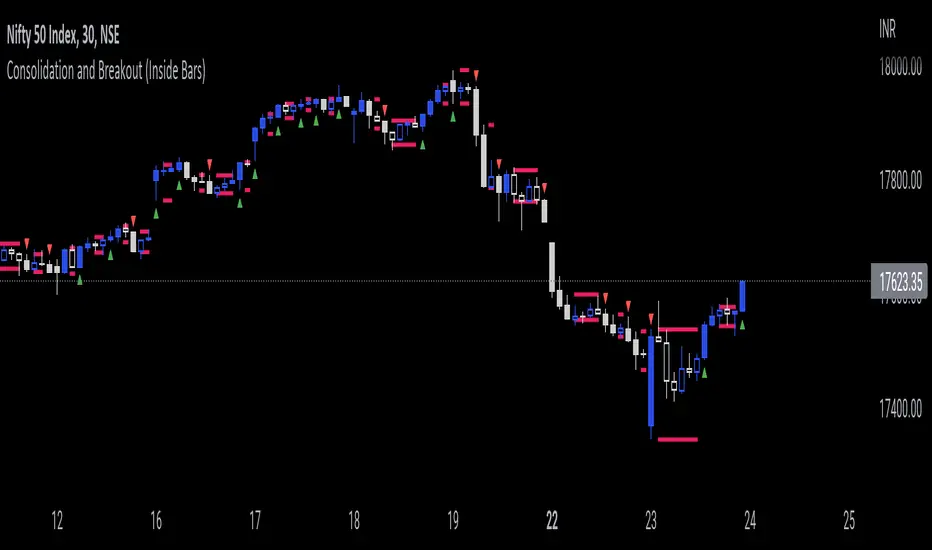
Consolidation and Breakout (Inside Bars)Consolidation indicates moments of market indecision when there is no shift in price. It is neither positive nor negative. Usually, after a price burst or strong trend movement that market falls back into a phase when traders are cautious about possible overbought or oversold positions. During this period, market reconciles before another breakout or trend emerges. Once you have identified consolidation, the next step is to keep an eye on a possible breakout.
This indicator would be useful for Breakout traders.
A candle's high and low is marked and if consequent candle fails to close above or below the marked candle, it's considered as an inside bar.
This can help breakout traders in tackling fakeouts since the wick above or below the initial candle are neglected and only the candle close above or below the range are considered as breakout.
Best Bulls Bears Volume trend Breakout V2 [badshah_e_alam]This is a intraday indicator. Only to be used on timeframe less than daily charts.
This indicator purely uses volume to plot the graph. The indicator helps in conforming a breakout strategy.
This indicator is advanced version of my previously developed indicator you can check this link
Total volume is made up of buying volume and selling volume . Buying volume is the number of shares, contracts, or lots that were associated with green bars, and selling volume is the number that were associated with red bars.
The labels on the right side are the current bar value and that days bulls /bears weightage.
the first value shows the current bar volume.
second value show the bulls weight in %
third value show the bears weightage throughout the day ( %)
The Blue plot in graph keeps the track of bulls movement in intraday( %)
The Red plot in graph keeps the track of bears movement in intraday ( %)
X axis is time.
Y axis ranges from 100 to -100
I use 1:2 risk to reward ratio. Do your own research.
**not a financial advice**
Example of price increasing, volume decreasing
this indicator can be used for confirming a breakout strategy with bulls or bears in action. In the current example, the buyer’s volume percentage is reducing and the price is increasing throughout the day. Hence a breakout of the trendline is confirmation of a short trade.
Example of Price reducing, volume decreasing
example of price moving down , bears losing the grip
Example of price decreasing volume increasing
Thanks to nizar9599 for giving idea to improve my previous indicator.
DISCLAIMER
Any and all liability for risks resulting from investment transactions or other asset dispositions carried out by the user based on information received or a market analysis is expressly excluded by me.
All the information made available here is generally provided to serve as an example only, without obligation and without specific recommendations for action. It does not constitute and cannot replace investment advice. We therefore recommend that you contact your personal financial advisor before carrying out specific transactions and investments.
Do your own research, This is not a financial advice.

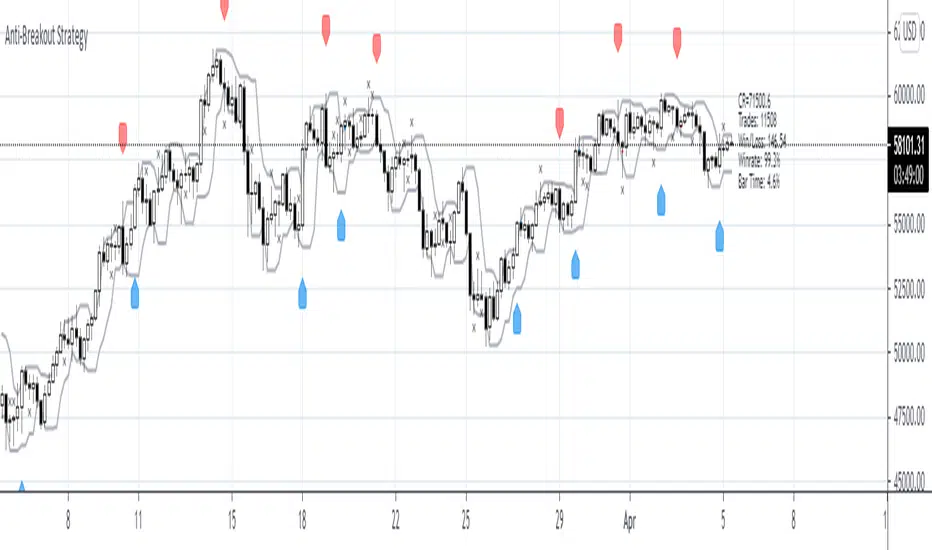
Anti-Breakout StrategyAnti-Breakout Strategy
Description:
This is a contrarian entry strategy for trading false breakouts. The high/low of the breakout bar is used for the entry in the opposite direction.
To reduce repainting set ptype variable to OHL3.
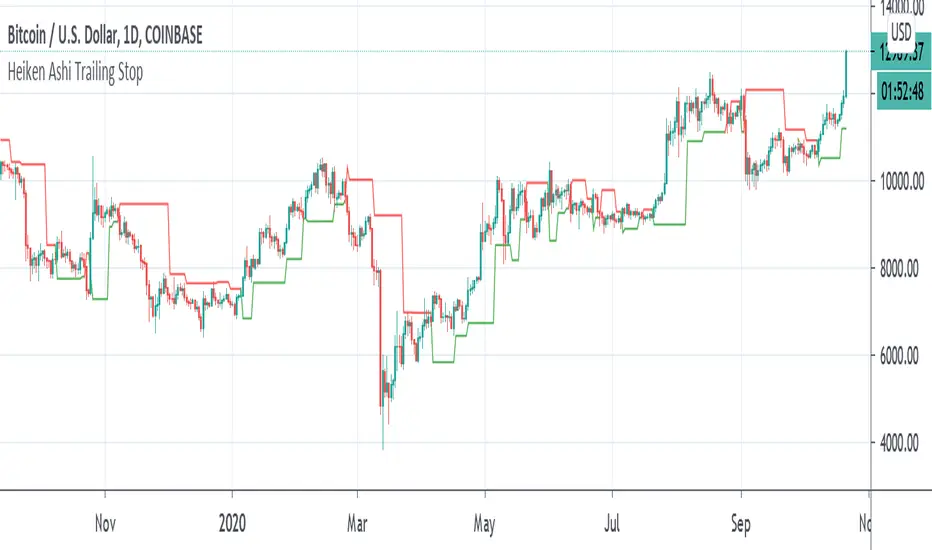
Heiken Ashi Pivot Breakout Trailing StopThis is a heiken ashi pivot based trailing stop for breakout entries and exits. It's possibly related to the Swing Index System by Welles Wilder or an alternative to it that I came up with, in case determining the swings on the Accumulative Swing Index is too much of a burden. It is believed that the ASI uses the calculation of heiken ashi in its formula. This does not use the ASI as a bottom indicator in the chart but instead uses the heiken ashi bars on the top of the chart to objectively find the swing pivots . These swings pivots act as support and resistance and can be used to confirm the start of a breakout or the end of one.
Suppose you find a chart pattern or setup, such as divergence or a pennant in the RSI , a pattern on the ASI, and/or on the chart, or the end of an elliot wave , etc and want to confirm a strong breakout and ride it to the end. Many trailing stops won't be able to confirm the beginning or would last too long or not long enough to exit out of one. On an uptrend, when the price breaks below the last swing low pivot , it can confirm the end of the breakout. On a downtrend, when the price breaks above the last swing high pivot , it can confirm the end of the breakout.
This trailing stop is not meant to replace trend following ones. The swing pivots can vary yet the price can still continue at an uptrend whereas this heiken ashi pivot based trailing stop exits as soon as it goes above or below the last resistance point. These swing points can end up being too close for trend following but can work well for breakout trading. The bigger the chart pattern or breakout, the more reliable the exit signal will be in my opinion. This is an experimental idea that I came up with from trying to interpret the ASI.
High & Low Of Custom Session - OpeningRange Breakout (Expo)High & Low Of Custom Session - OpeningRange Breakout (Expo) prints the high and the low of a custom session.
I use the indicator to trade the re-test of opening range (high/low) as well as breakouts from the opening range. The same logic can be applied to the session you have chosen.
HOW TO USE
1. Use the indicator to trade the re-tests of the session range.
2. Use the indicator to trade breakouts of session range.
INDICATOR IN ACTION
1-min chart
I hope you find this indicator useful , and please comment or contact me if you like the script or have any questions/suggestions for future improvements. Thanks!
I will continually work on this indicator, so please share your experience and feedback as it will enable me to make even better improvements. Thanks to everyone that has already contacted me regarding my scripts. Your feedback is valuable for future developments!
-----------------
Disclaimer
Copyright by Zeiierman.
The information contained in my scripts/indicators/ideas does not constitute financial advice or a solicitation to buy or sell any securities of any type. I will not accept liability for any loss or damage, including without limitation any loss of profit, which may arise directly or indirectly from the use of or reliance on such information.
All investments involve risk, and the past performance of a security, industry, sector, market, financial product, trading strategy, or individual’s trading does not guarantee future results or returns. Investors are fully responsible for any investment decisions they make. Such decisions should be based solely on an evaluation of their financial circumstances, investment objectives, risk tolerance, and liquidity needs.
My scripts/indicators/ideas are only for educational purposes!

VWMA/SMA Breakout and Divergence DetectorThis indicator compares four different values :
-Fast Simple Moving Average(SMA)
-Fast Volume Weighted Moving Average(VWMA)
-Slow SMA
-Slow VWMA
Comparing SMA's and VWMA's of the same length is a common trading tactic. Since volume is not taken into consideration when calculating Simple Moving Averages, we can gain valuable insights from the difference between the two lines.
Since volume should be increasing along with an upwards price movement, the VWMA should be greater than the SMA during a volume-supported uptrend. Thus, we can confirm an uptrend if the VWMA remains greater than the SMA. If the VWMA falls under the SMA in the midst of an upwards price movement, however, that indicates bearish divergence. The opposite is true for downtrends. If price is decreasing and volume is decreasing at the same time (as it should), then we can confirm the downtrend.
Interpreting the Graph:
If the slow SMA is greater than the slow VWMA, then the area representing the difference between the two lines is filled in red. If the slow VWMA is greater than the slow SMA, however, the area between the two is filled green.
If the fast SMA is greater than the fast VWMA, then the area between the two dotted lines is filled in red. On the other hand, the area will be filled green if the fast VWMA is greater than the slow SMA.
In addition to spotting divergences and confirming trends, the four lines can be used to spot breakouts. Typically, a VWMA crossover will precede the SMA crossover. When the fast VWMA crosses over the slow VWMA and then a SMA crossover follows shortly after, then it is a hint that a bullish trend is beginning to form.

ATR ZigZag BreakoutATR ZigZag Breakout
This strategy uses my ATR ZigZag indicator (powered by the ZigZagCore library) to scalp breakouts at volatility-filtered highs and lows.
Everyone knows stops cluster around clear swing highs and lows. Breakout traders often pile in there, too. These levels are predictable areas where aggressive orders hit the tape. The idea here is simple:
→ Let ATR ZigZag define clean, volatility-filtered pivots
→ Arm a stop market order at those pivots
→ Join the breakout when the crowd hits the level
The key to greater success in this simple strategy lies in the ZigZag. Because the pivots are filtered by ATR instead of fixed bar counts or fractals, the levels tend to be more meaningful and less noisy.
This approach is especially suited for intraday trading on volatile instruments (e.g., NQ, GC, liquid crypto pairs).
How It Works
1. Pivot detection
The ATR ZigZag uses an ATR-based threshold to confirm swing highs and lows. Only when price has moved far enough in the opposite direction does a pivot become “official.”
2. Candidate breakout level
When a new swing direction is detected and the most recent high/low has not yet been broken in the current leg, the strategy arms a stop market order at that pivot.
• Long candidate → most recent swing high
• Short candidate → most recent swing low
These “candidate trades” are shown as dotted lines.
3. Entry, SL, and TP
If price breaks through the level, the stop order is filled and a bracket is placed:
• Stop loss = ATR × SL multiplier
• Take profit = SL distance × RR multiplier
Once a level has traded, it is not reused in the same swing leg.
4. Cancel & rotate
If the market reverses and forms a new swing in the opposite direction before the level is hit, the pending order is cancelled and a new candidate is considered in the new direction.
Additional Features
• Optional session filter for backtesting specific trading hours

Moving Average Channel Breakout (No Repaint) This indicator creates a channel using two simple moving averages: SMA of highs (upper line) and SMA of lows (lower line).
How it works:
- When a candle closes above the upper channel line, the following candles turn green (bullish trend)
- When a candle closes below the lower channel line, the following candles turn red (bearish trend)
- The trend color remains until a breakout in the opposite direction occurs
Anti-repaint:
This indicator does NOT repaint. The candle color is determined at the open, based on the previous candle's close. Once a candle opens with a color, that color never changes.
Breakout strategy:
- Candle opens green → Long entry signal
- Candle opens red → Short entry signal
The signal and entry moment are perfectly synchronized at the candle open, making it ideal for systematic breakout strategies.

Structure Breakout - Buy Sell IndicatorStructure Breakout - Buy Sell Indicator
📈 OVERVIEW:
A minimalist indicator that identifies market structure breakouts using swing point analysis.
Displays clear blue buy arrows and red sell arrows when price breaks key swing levels.
🔧 HOW IT WORKS:
1. Identifies swing highs and lows using configurable lookback period
2. Triggers BUY signal (blue arrow) when price closes above previous swing high
3. Triggers SELL signal (red arrow) when price closes below previous swing low
4. Uses clean visual arrows without cluttering the chart
⚙️ KEY FEATURES:
• Clean, uncluttered visual signals
• Customizable sensitivity period
• Blue arrows for buy signals (below bars)
• Red arrows for sell signals (above bars)
• No lagging repainting
• Works on all timeframes
🎯 TRADING APPLICATIONS:
• Swing trading entries
• Breakout confirmation
• Trend continuation signals
• Support/resistance breaks
⚡ SETTINGS:
• Structure Detection Period (default: 20) - Adjust sensitivity of swing detection
⚠️ RISK DISCLAIMER:
This is an educational tool. Always use proper risk management.
Past performance does not guarantee future results.

Session Opening Range Breakout (ORBO)This strategy automates a classic Opening Range Breakout (ORBO) approach: it builds a price range for the first minutes after the market opens, then looks for strong breakouts above or below that range to catch early directional moves.
Concept
The idea behind ORBO is simple:
The first minutes after the session open are often highly informative.
Price forms an “opening range” that acts as a mini support/resistance zone.
A clean breakout beyond this zone can lead to high-momentum moves.
This script turns that logic into a fully backtestable strategy in TradingView.
How the strategy works
Opening Range Session
Default session: 09:30–09:50 (exchange time)
During this window, the script tracks:
orHigh → highest high within the session
orLow → lowest low within the session
This forms your Opening Range for the day.
Breakout Logic (after the window ends)
Once the defined session ends:
Long Entry:
If the close crosses above the Opening Range High (orHigh),
→ strategy.entry("OR Long", strategy.long) is triggered.
Short Entry:
If the close crosses below the Opening Range Low (orLow),
→ strategy.entry("OR Short", strategy.short) is triggered.
Only one opening range per day is considered, which keeps the logic clean and easy to interpret.
Daily Reset
At the start of a new trading day, the script resets:
orHigh := na
orLow := na
A fresh Opening Range is then built using the next session’s 09:30–09:50 candles.
This ensures entries are always based on today’s structure, not yesterday’s.
Visuals & Inputs
Inputs:
Opening range session → default: "0930-0950"
Show OR levels → toggle visibility of OR High / Low lines
Fill range body → optional shaded zone between OR High and OR Low
Chart visuals:
A green line marks the Opening Range High.
A red line marks the Opening Range Low.
Optional yellow fill highlights the entire OR zone.
Background shading during the session shows when the range is currently being built.
These visuals make it easy to see:
Where the OR sits relative to current price
How clean / noisy the breakout was
How often price respects or rejects the opening zone
Backtesting & Optimization
Because this is written as a strategy():
You can use TradingView’s Strategy Tester to view:
Win rate
Net profit
Drawdown
Profit factor
Equity curve
Ideas to experiment with:
Change the session window (e.g., 09:15–09:45, 10:00–10:30)
Apply to different:
Markets: indices, FX, crypto, stocks
Timeframes: 1m / 5m / 15m
Add your own:
Stop Loss & Take Profit levels
Time filters (only trade certain days / times)
Volatility filters (e.g., ATR, range size thresholds)
Higher-timeframe trend filter (e.g., only take longs above 200 EMA)

Breakout Volume Momentum [5m]Breakout Volume Momentum Indicator (Pine Script v5)
This TradingView Pine Script v5 indicator plots a green dot below a 5-minute price bar whenever all the breakout and volume conditions are met. It is optimized for live intraday trading (not backtesting) and includes customizable inputs for thresholds and trading session times. Key features and conditions of this indicator:
Gap Up Threshold: Current price is up at least X% (default 20%) from the previous day’s close (uses higher-timeframe daily data) before any signal can trigger.
Relative Volume (RVOL): Current bar’s volume is at least Y× (default 2×) the average volume of the last 20 bars. This ensures unusually high volume is present, indicating strong interest.
Trend Alignment: Price is trading above the VWAP (Volume-Weighted Average Price) and above a fast EMA. In addition, the fast EMA (default 9) is above the slower EMA (default 20) to confirm bullish momentum
tradingview.com
tradingview.com
. These filters ensure the stock is in an intraday uptrend (above the average price and rising EMAs).
Intraday Breakout (optional): Optionally require the price to break above the recent intraday high (default last 30 bars). If enabled, a signal only occurs when the stock exceeds its prior range high, confirming a breakout. This can be toggled on/off in the settings.
Avoid Parabolic Spikes: The script skips any bar with an excessively large range (default >12% from low to high), to avoid triggering on spiky or unsustainable parabolic candles.
Time Window Filter: Signals are restricted to a specific session window (by default 09:30 – 11:00 exchange time, typically the morning session) and will not trigger outside these hours. The session window is adjustable via inputs
stackoverflow.com
.
Alerts: An alert condition is provided so you can set a Trading View alert to send a push notification when a green dot signal fires. The alert message includes the ticker and price at the time of signal.

Opening Range Breakout Detector📈 Opening Range Breakout Detector (TF-Independent)
Tracks breakouts with precision. No matter the chart, no matter the timeframe.
This indicator monitors whether price breaks above or below the Opening Range across multiple key durations — 1m, 5m, 10m, 15m, 30m, 45m, and 60m — using 1-minute data under the hood, while you can work on higher timeframe charts (daily, etc.).
Highlights:
✅ Status table shows which ORs broke UP or DOWN
⏱ Control which timeframes to track
🖼 Customizable table position, size and colors
Crafted by @FunkyQuokka

RTB - Momentum Breakout Strategy V3
📈 RTB - Momentum Breakout Strategy V3 is a directional breakout strategy based on momentum. It combines exponential moving averages (EMAs), RSI, and recent support/resistance levels to detect breakout entries with trend confirmation. The system includes dynamic risk management using ATR-based stop-loss and trailing stop levels. Webhook alerts are supported for external automated trading integrations.
🔎 The strategy was backtested using default parameters on BTCUSDT Futures (Bybit) with 4-hour timeframe and a 0.05% commission per trade.
⚠️ This script is for educational purposes only and does not constitute financial advice. Always do your own research before trading.

Katalyst's Opening Range BreakoutKatalyst's Opening Range Breakout + No Trade Zone
📜 Overview:
This indicator allows traders to visualize the high and low of the opening range for a user-selected timeframe (e.g., 30s, 1m, 5m, 15m). It features fully customizable lines, labels, and an optional **No Trade Zone** fill to help you identify breakout levels with ease.
---
🎯 Key Features:
1. **Customizable Opening Range**:
- Select your preferred opening range duration: **30 seconds, 1 minute, 2 minutes, 5 minutes, 10 minutes, or 15 minutes**.
- The indicator calculates and plots the **high** and **low** of the selected opening range.
2. **Dynamic Line Styling**:
- Choose the **line color**, **transparency**, and **style**: **Solid, Dashed, or Dotted**.
- Lines extend to the right of the chart for clarity.
3. **No Trade Zone** *(Optional / Disabled by default)*:
- When enabled, fills the area between the high and low lines with a customizable **color and transparency**.
- Helps visually identify consolidation areas where trading might be avoided.
4. **Labels for Precision**:
- Clearly displays the **Opening Range High** and **Low** values.
- Labels are color-coded and positioned dynamically for easy interpretation.
5. **Clean and Efficient Updates**:
- The indicator deletes old lines, labels, and fills before creating new ones, ensuring a clutter-free chart.
---
⚙️ How to Use:
1. **Select Your Timeframe**:
- From the settings, choose your desired opening range duration: 30s, 1m, 2m, 5m, 10m, or 15m.
2. **Customize the Visuals**:
- Adjust line color, style, and transparency.
- Enable the **No Trade Zone** for a transparent background fill between the high and low lines.
3. **Interpret the Breakout**:
- Watch for price movements above or below the **opening range** to identify potential breakout opportunities.
---
🛠 Settings:
Opening Range Duration: Select the timeframe for the opening range (30s, 1m, 2m, 5m, 10m, 15m).
Line Color: Set the color of the range lines.
Line Transparency: Adjust the transparency of the lines (0 = solid, 100 = invisible).
Line Style: Choose line style: Solid, Dashed, or Dotted.
Label Colors: Customize the label colors for the high and low values.
Enable No Trade Zone: Fill the area between high and low lines with a transparent color.
No Trade Zone Color: Set the fill color for the no trade zone.
No Trade Zone Transparency: Adjust the transparency of the no trade zone fill.
---
📈 Ideal For
Day traders and scalpers looking to trade **breakouts**.
Traders who want to identify areas of consolidation visually.
Anyone who relies on the **opening range** for their trading strategy.
---
🔍 Example Usage:
Set the opening range to **5 minutes** and enable the **No Trade Zone** with a light red fill.
Watch for price to break above or below the high/low lines to signal potential trade opportunities.
---
✨ Why Use This Indicator?
This script simplifies your breakout strategy by providing a clear, visually appealing representation of the opening range. The flexible customization options and the optional **No Trade Zone** make it a powerful tool for identifying high-probability trades.
---
Let me know if you need any additional tweaks or clarifications for this description. It's all set to help traders understand and use your powerful script! 🚀📈

Swing Breakout Sequence [LuxAlgo]The Swing Breakout Sequence tool enables traders to identify a directional price action scalping sequence comprising two unsuccessful breakouts in the same direction, with the expectation of a third.
🔶 USAGE
This sequence looks for pressure on one side of a swing zone.
The market tried to break out of the zone twice but failed. This led to a pullback into the zone after each attempt. Once a reversal inside the zone is identified, the sequence is complete. It is expected that the market will move from the final reversal within the zone to the final breakout attempt outside the zone.
The sequence of price action is as follows:
Point 1: Breakout attempt out of the swing zone
Point 2: Pullback into the zone
Point 3: Breakout attempt out of Point 1
Point 4: Pullback into the zone, tapping into Point 2 liquidity
Point 5: Reversal structure with Point 4 in the form of a double top or double bottom
This sequence assumes traders will be caught off-guard when they try to capitalize on the initial breakout at Point 1, which is likely to result in a loss. If the breakout at Point 3 fails, all traders will be caught out and switch positions.
If there is enough pressure in the swing zone to cause a reversal at Point 5, the trapped traders could be the start of the next breakout attempt.
🔹 Sequence Detection
Traders can define sequence behavior and adjust detection with three parameters from the Settings panel.
Disabling Points 4 and 5 will detect the most uncompleted sequences.
🔹 Showing/Hiding Elements
Traders can change the look of sequences by showing or hiding their parts using the Style settings.
🔶 SETTINGS
Swing Length: Number of candles to confirm a swing high or swing low. A higher number detects larger swings.
Internal Length: Number of candles to confirm a internal high or internal low. A lower number detects smaller swings. It must be the same size or smaller than the swing length.
🔹 Detection
Point 4 Beyond Point 2: It only detects sequences where Point 4 is beyond Point 2.
Show Point 5: Enable/disable Point 5 detection.
Require Equal H/L at Point 5: Enable/Disable double top/bottom detection at Point 5 within a given threshold. A bigger value detects more sequences.
🔹 Style
Show Sequence Path: Enable/disable a line between sequence points.
Show Boxes: Enable/disable colored boxes for each sequence.
Show Lines: Enable/disable horizontal lines from each point of the sequence.
Default Color: Define the color or enable/disable auto color.

Advanced Volume-Driven Breakout SignalsThe "Advanced Volume-Driven Breakout Signals" indicator is a cutting-edge tool designed to help traders identify high-potential trading opportunities through sophisticated volume analysis techniques. This indicator integrates volume flow analysis, moving averages, and Relative Volume (RVOL) to provide a comprehensive view of market conditions, going beyond traditional Volume Spread Analysis (VSA) methods.
Key Features:
Volume Flow Analysis: Distinguishes bullish and bearish volume flows with distinct colors, making it easier to visualize market sentiment and potential breakout points.
Volume Flow Moving Averages: Calculates moving averages for volume using various methods (SMA, EMA, WMA, HMA, VWMA), accommodating different trading strategies. This includes settings for adjusting the type of moving average and its period, as well as thresholds for high, medium, and low volume levels.
Volume Spikes Detection: Identifies significant volume spikes based on user-defined multipliers and moving averages, highlighting unusual trading activity.
Volume MA Cloud Settings: Computes general moving averages of volume to track trends and detect deviations. This feature includes options to select different moving average types and adjust thresholds for detecting high volume activity.
Relative Volume (RVOL): Measures current volume relative to historical averages, triggering signals when RVOL exceeds predefined thresholds, indicating notable changes in trading activity.
Entry Conditions: Provides clear long and short entry signals based on combined volume flow conditions and RVOL, offering actionable trading opportunities.
Volume Visualization:
— Bullish Volume Flow: Light and dark green bars indicate bullish volume flow.
— Bearish Volume Flow: Light and dark red bars denote bearish volume flow.
— High Volume Bars: Highlighted in yellow, and extreme volume bars in orange for additional context. These bars are plotted for visual aid and do not directly influence trade signals, focusing instead on the quality and strength of the volume flow.
Alerts: Allows users to create alert notifications for long and short entry signals when the criteria are met, enabling traders to respond promptly to trading opportunities.
Usage:
Overlay: Apply the indicator directly to your price chart to visualise real-time signals and volume conditions.
Customisable: Adjust settings for moving averages, RVOL, and other parameters to match your trading strategy and preferences.
Comparison to VSA Scripts: The "Advanced Volume-Driven Breakout Signals" indicator extends beyond traditional VSA scripts by incorporating a wider range of analytical features. While VSA primarily focuses on volume spread patterns and price action, this indicator offers enhanced functionality with advanced RVOL metrics, customizable moving averages, and detailed volume spike detection, making it a more versatile tool for identifying breakout opportunities and managing trades. It is particularly effective when used alongside key levels and order blocks.
Acknowledgements: Special thanks to @oh92 and @goofoffgoose for their invaluable scripts, which served as inspiration in the development of this advanced trading indicator.
Notes: The script is continually evolving, with ongoing refinements aimed at enhancing accuracy and performance.

VWAP Bollinger Band Crossover Breakout with ResistanceCredit to © Jesus_Salvatierra for VWAP script
This script help you find a trend in momentum stock that is about to breakout and shows resistance point. This script utilizes Bollinger bands VWAP and is good for intra day charts.
VWAP, or Volume Weighted Average Price, is a technical analysis tool used to measure the average price a security trades at during a given time period, weighted by the trading volume for each price level. It is commonly used by traders and investors to identify the true average price of a security and to assess whether they are buying or selling at a fair price.
A Bollinger Band is a technical analysis tool that uses standard deviation to measure the volatility of a security. The Bollinger Band is typically composed of three lines: the upper band, the lower band, and the middle band. The middle band is a simple moving average of the security's price, while the upper and lower bands are calculated based on the standard deviation of the security's price.
A Bollinger Band crossover occurs when the price of a security crosses above or below one of the bands. When the price crosses above the upper band, it is considered overbought, while when it crosses below the lower band, it is considered oversold. Traders often use Bollinger Band crossovers as a signal to enter or exit a position, depending on their trading strategy.
The VWAP and Bollinger Band crossover are two separate technical analysis tools that can be used in conjunction with each other. When a security's price crosses above or below the Bollinger Band, traders may look to the VWAP to confirm whether the security is trading at a fair price. If the security is trading above the VWAP, it may be overvalued, while if it is trading below the VWAP, it may be undervalued. Similarly, traders may use the Bollinger Band crossover as a signal to enter or exit a position, while also taking into account the VWAP to assess whether the price is fair.

Volume Bar Breakout and Breakdown IndicatorVolume shows strength of a movement and highest volume shows the region that pushed price to certain extent with full strength. Breakout or Breakout of the highest volume bar range shows continuity further push by sellers or buyers indicating a trend continuation for a small period if not for long duration. Entries can be taken once signal is generated with stoploss as recommended.
Guidelines:
Don't trade if range is too large
Don't trade if Breakdown or Breakdown candle body / range is too large or if there is high volatility
Use additional indicator to get the idea of overall trend analysis

DC Breakout Strategy | This is simplicity at its finest.As the title already describes: this is a Donchian breakout strategy. This strategy, as of now, only goes long. It goes long when the price close makes a new high and the 8 day moving average is above the 32 day moving average. The strategy exits the trade if the price breaks the atr trailing stop of * 3 or the 8 day moving average crosses below the 32 day moving average.
This is simplicity at its finest.
