Range BreakoutThis indicator makes easy to identify a range breakout in both the direction
Expected input is number of days that we should expect the range to be in
Cari dalam skrip untuk "breakout"

Best Bulls Bears Volume trend Breakout V2 [badshah_e_alam]This is a intraday indicator. Only to be used on timeframe less than daily charts.
This indicator purely uses volume to plot the graph. The indicator helps in conforming a breakout strategy.
This indicator is advanced version of my previously developed indicator you can check this link
Total volume is made up of buying volume and selling volume . Buying volume is the number of shares, contracts, or lots that were associated with green bars, and selling volume is the number that were associated with red bars.
The labels on the right side are the current bar value and that days bulls /bears weightage.
the first value shows the current bar volume.
second value show the bulls weight in %
third value show the bears weightage throughout the day ( %)
The Blue plot in graph keeps the track of bulls movement in intraday( %)
The Red plot in graph keeps the track of bears movement in intraday ( %)
X axis is time.
Y axis ranges from 100 to -100
I use 1:2 risk to reward ratio. Do your own research.
**not a financial advice**
Example of price increasing, volume decreasing
this indicator can be used for confirming a breakout strategy with bulls or bears in action. In the current example, the buyer’s volume percentage is reducing and the price is increasing throughout the day. Hence a breakout of the trendline is confirmation of a short trade.
Example of Price reducing, volume decreasing
example of price moving down , bears losing the grip
Example of price decreasing volume increasing
Thanks to nizar9599 for giving idea to improve my previous indicator.
DISCLAIMER
Any and all liability for risks resulting from investment transactions or other asset dispositions carried out by the user based on information received or a market analysis is expressly excluded by me.
All the information made available here is generally provided to serve as an example only, without obligation and without specific recommendations for action. It does not constitute and cannot replace investment advice. We therefore recommend that you contact your personal financial advisor before carrying out specific transactions and investments.
Do your own research, This is not a financial advice.

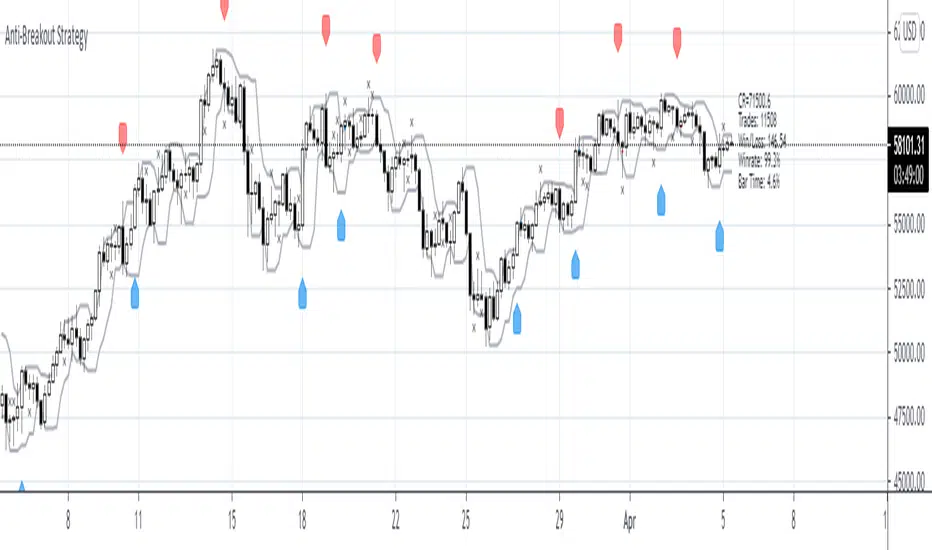
Anti-Breakout StrategyAnti-Breakout Strategy
Description:
This is a contrarian entry strategy for trading false breakouts. The high/low of the breakout bar is used for the entry in the opposite direction.
To reduce repainting set ptype variable to OHL3.
Ravih Pro Momentum BreakoutThis is a Momentum Breakout Strategy on “DAILY Timeframe”
This Breakout Strategy is specially created for Momentum Traders and for Bursa Market. The learning applied here are derived from past market behavioural approach. It takes into account of recent strength of price action and volume.
However, it can be applied for other Exchanges as well; as long as the stock is active with unusual volume.
The Momentum Set-Ups Script is designed for Short Term traders as in 3 to 60 Trading Days holding period or unless and until Exit Signal appears. Sometimes it could extend longer depending on the pace of the Momentum.
It also caters the aggressive traders as in Buy Today Sell Tomorrow/Today (BTST) and Fast in Fast Out (FIFO). These are traders...usually looking for 5% to 7% or 12% gain in a short span of time. However, do take note; momentum stocks are explosive in their moves. Therefore one could maximise the Gain Ride until Exit/Sell Signal appears.
The Script provides you the best High-Probability Profitable Set-Up Entry. The system identifies the stock/s in action Right Now. It is a powerful strategy for trading both Fast and Slow Momentum Stocks.
The Momentum Script is built around 3 Primary Factors namely…
1. Volume
2. Price Action
3. Time
And 2 Secondary Factors namely…
1. Volatility
2. Liquidity
Buy Exit/Sell Arrows are triggered based on last candle bar closed. It plots automatically.
For Long
Light Blue Up Triangle denotes Buy at the Closing Price. Entry Price is Closing Price or with + or – 2% tolerance for the following market day.
For Exit/Sell
Orange Down Triangle denotes Exit to close any remaining position to free up capital. Or...
Red Down Triangle denotes Exit to close any remaining position to free up capital.
Either one of the arrow is Final.
For Setting Up Alerts
The user has the option to Setup Alerts for chart signals that is…for Long and for Exit/Sell.
For Demonstrative purpose...
I have on purpose chosen an O&G counter from a Cold Sector from MYX. This is a time of Pandemic. Therefore, choosing Technology or Glove and Healthcare Sectors would definitely reflect good performance. The idea here is to demonstrate that the Momentum Strategy application works on all market conditions anytime of the year.
Remember...
This strategy is only built for stocks. It is Not for Indices neither for any other financial instruments.
No SHORT signals in this strategy.

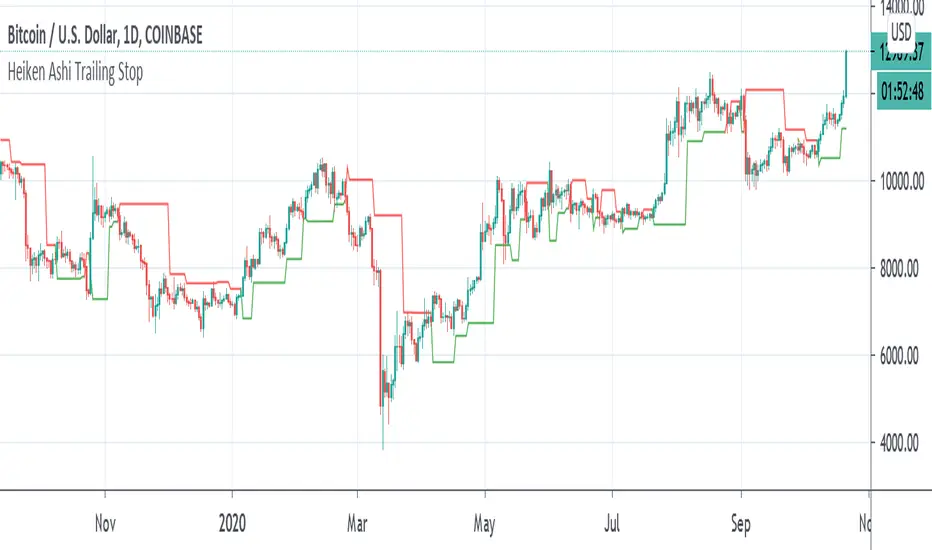
Heiken Ashi Pivot Breakout Trailing StopThis is a heiken ashi pivot based trailing stop for breakout entries and exits. It's possibly related to the Swing Index System by Welles Wilder or an alternative to it that I came up with, in case determining the swings on the Accumulative Swing Index is too much of a burden. It is believed that the ASI uses the calculation of heiken ashi in its formula. This does not use the ASI as a bottom indicator in the chart but instead uses the heiken ashi bars on the top of the chart to objectively find the swing pivots . These swings pivots act as support and resistance and can be used to confirm the start of a breakout or the end of one.
Suppose you find a chart pattern or setup, such as divergence or a pennant in the RSI , a pattern on the ASI, and/or on the chart, or the end of an elliot wave , etc and want to confirm a strong breakout and ride it to the end. Many trailing stops won't be able to confirm the beginning or would last too long or not long enough to exit out of one. On an uptrend, when the price breaks below the last swing low pivot , it can confirm the end of the breakout. On a downtrend, when the price breaks above the last swing high pivot , it can confirm the end of the breakout.
This trailing stop is not meant to replace trend following ones. The swing pivots can vary yet the price can still continue at an uptrend whereas this heiken ashi pivot based trailing stop exits as soon as it goes above or below the last resistance point. These swing points can end up being too close for trend following but can work well for breakout trading. The bigger the chart pattern or breakout, the more reliable the exit signal will be in my opinion. This is an experimental idea that I came up with from trying to interpret the ASI.
High & Low Of Custom Session - OpeningRange Breakout (Expo)High & Low Of Custom Session - OpeningRange Breakout (Expo) prints the high and the low of a custom session.
I use the indicator to trade the re-test of opening range (high/low) as well as breakouts from the opening range. The same logic can be applied to the session you have chosen.
HOW TO USE
1. Use the indicator to trade the re-tests of the session range.
2. Use the indicator to trade breakouts of session range.
INDICATOR IN ACTION
1-min chart
I hope you find this indicator useful , and please comment or contact me if you like the script or have any questions/suggestions for future improvements. Thanks!
I will continually work on this indicator, so please share your experience and feedback as it will enable me to make even better improvements. Thanks to everyone that has already contacted me regarding my scripts. Your feedback is valuable for future developments!
-----------------
Disclaimer
Copyright by Zeiierman.
The information contained in my scripts/indicators/ideas does not constitute financial advice or a solicitation to buy or sell any securities of any type. I will not accept liability for any loss or damage, including without limitation any loss of profit, which may arise directly or indirectly from the use of or reliance on such information.
All investments involve risk, and the past performance of a security, industry, sector, market, financial product, trading strategy, or individual’s trading does not guarantee future results or returns. Investors are fully responsible for any investment decisions they make. Such decisions should be based solely on an evaluation of their financial circumstances, investment objectives, risk tolerance, and liquidity needs.
My scripts/indicators/ideas are only for educational purposes!

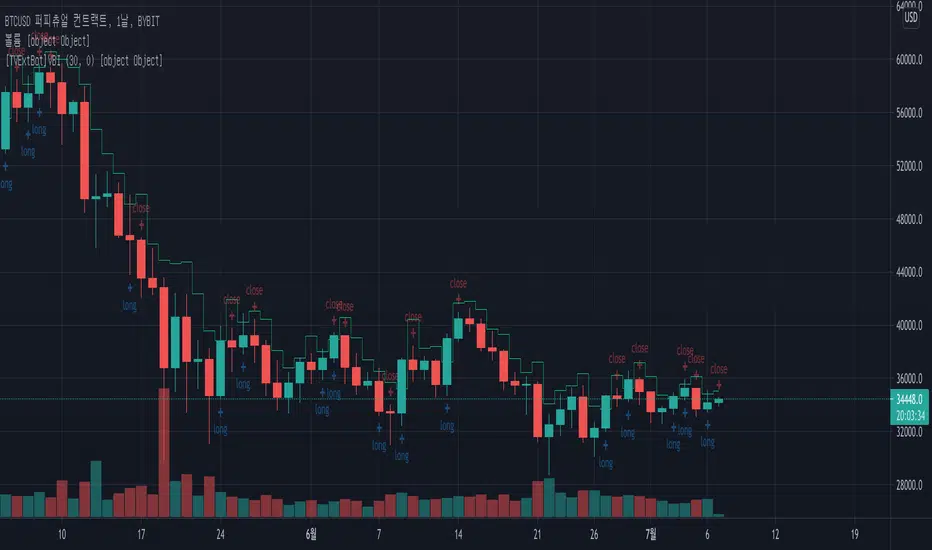
[TVExtBot]Volatility Breakout Indicator(With Alerts)Volatility Breakout Indicator(With Alerts)
It is based on the legendary trader Larry R. Williams' volatility breakout strategy.
The volatility breakout strategy is a short-term trading strategy that realizes rapid profits on a daily basis, following the upward trend of a strong upward trend that exceeds a certain level on a daily basis.
변동성 돌파 지표란 전설적인 트레이더 래리 윌리엄스(Larry R. Williams)의 변동성 돌파 전략을 기본으로 개발한 지표입니다.
변동성 돌파 전략은 일일 단위로 일정 수준 이상의 범위를 뛰어넘는 강한 상승세를 돌파 신호로 상승하는 추세를 따라가며 일 단위로 빠르게 수익을 실현하는 단기매매 전략입니다.
Areas of Support/Resistance & BreakoutA pretty little indicator showing pivotal breakouts - that is, locating critical pivot points within price action, connecting the dots and trading the breakouts from this area!
-----------
Useful for finding good entry levels, exit levels, areas of strong support/resistance and most importantly - the Breakout!
Includes "Bars to the Left" variable so you can shorten or lengthen the indicator as required.
Good Luck and Happy Trading!

ORB with Multi Breakout V.2 [MV]This ORB with Multi Breakout Indicator Session Time is Indian NSE and BSE Equity Market
This indicator Provide you 4 type Setup
Opening Range Plot Only for Observation
1st Range Breakout = Long
2nd Range Breakout = Short
3rd Range Breakout = Short
4th Range Breakout = Long
How to work This Indicator?
When Market is Open This Indicator automatically Plot Opening Range High and Low,
if Market bullish & Candle Close above Opening Range high When This Indicator automatically Plot 1st Range High and Low if You Want to 1st Range High Plot Crossingup any Candle You can Also Add Alerts
Note: When 1st Range High and Low Plot Automatically Plot 1st Range Takeprofit Buffer by Default 1 Percentage You can also Change and Add Alert.
if Bullish market Reverse Down Side and Breakout 1st Range Low Below Closing When automatically Plot 3rd Range High and low, You Can Also Add Alerts When 3rd Range Low Plot CrossingDown any Candle
Note: When 3rd Range High and Low Plot Automatically Plot 3rd Range Takeprofit Buffer by Default 1 Percentage You can also Change & Add Alert.
When Market is Open This Indicator automatically Plot Opening Range High and Low,
if Market Bearish & Candle Close Below Opening Range Low When This Indicator automatically Plot 2nd Range High and Low if You Want to 2nd Range Low Plot CrossingDown any Candle You can Also Add Alerts
Note: When 2nd Range High and Low Plot Automatically Plot 2nd Range Takeprofit Buffer by Default 1 Percentage You can also Change & Add Alert.
if Bearish market Reverse Up Side and Breakout 3rd Range High Above Closing When automatically Plot 4th Range High and low, You Can Also Add Alerts When 4th Range High Plot CrossingUp any Candle.
Note: When 4th Range High and Low Plot Automatically Plot 4th Range Takeprofit Buffer by Default 1 Percentage You can also Change & Add Alert.
If you Have any Suggestion please mention here
Thank you so much
Below some image with Other Range

ChaosSN Breakout Signals v3This signal indicator combines some key turning points including Fractals, Volume , Moving average and Momentum to try and pinpoint the moments a breakout or reversal is likely.
Purple Arrows:
Shows a possible breakout/breakdown is pending. Wait for the close and only pay attention to the most recent arrows. Place a long/short sell above or below the purple price line which will be generated at the time of the signal generated.
An ideal setup will include watching the AO/AC/Oscillator to make sure they align with the direction of the entry.
v2:
-Added labels to arrows
-Added optional rules for stricter fractal identification
-Added more toggling options to help with cleaner charting
v3:
-Added reversal signals
-Added Buy and Sell signals
Buy and Sells can be used on their own with the traditional stop losses. The ideal scenario would be to combine the Buy and Sell signals with a Fractal Breakout/Breakdown

VWMA/SMA Breakout and Divergence DetectorThis indicator compares four different values :
-Fast Simple Moving Average(SMA)
-Fast Volume Weighted Moving Average(VWMA)
-Slow SMA
-Slow VWMA
Comparing SMA's and VWMA's of the same length is a common trading tactic. Since volume is not taken into consideration when calculating Simple Moving Averages, we can gain valuable insights from the difference between the two lines.
Since volume should be increasing along with an upwards price movement, the VWMA should be greater than the SMA during a volume-supported uptrend. Thus, we can confirm an uptrend if the VWMA remains greater than the SMA. If the VWMA falls under the SMA in the midst of an upwards price movement, however, that indicates bearish divergence. The opposite is true for downtrends. If price is decreasing and volume is decreasing at the same time (as it should), then we can confirm the downtrend.
Interpreting the Graph:
If the slow SMA is greater than the slow VWMA, then the area representing the difference between the two lines is filled in red. If the slow VWMA is greater than the slow SMA, however, the area between the two is filled green.
If the fast SMA is greater than the fast VWMA, then the area between the two dotted lines is filled in red. On the other hand, the area will be filled green if the fast VWMA is greater than the slow SMA.
In addition to spotting divergences and confirming trends, the four lines can be used to spot breakouts. Typically, a VWMA crossover will precede the SMA crossover. When the fast VWMA crosses over the slow VWMA and then a SMA crossover follows shortly after, then it is a hint that a bullish trend is beginning to form.

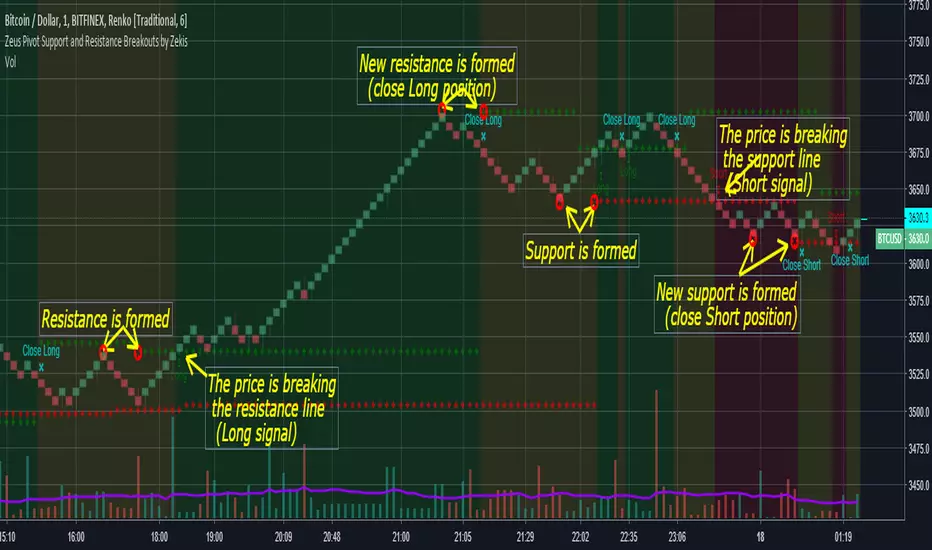
Zeus Pivot Points Support and Resistance Breakouts by ZekisZeus Pivot Support and Resistance Breakouts by Zekis
Is an indicator with big results, it forms new support /resistance according to the last higher high or lower low (it prints new ones only if it breaks through the last one)
Rules:
- enter Long or Short when the support or resistance is craked
- exit when new support or resistance is starts to form
Alerts for entries and exits
A moving average is added to filter signals (leave it at 1 for price close signals)
Bar colors can be added to see longs, shorts or no position
Background colors for longs, shorts or no position
Enjoy!
@Zekis
ORB Pro - NY Opening Range Breakout [Elev8+]**ORB Pro - NY Opening Range Breakout ** is a comprehensive, professional-grade toolkit designed for intraday traders who rely on the **Opening Range Breakout (ORB)** strategy.
Unlike standard ORB indicators that simply draw lines, this suite offers a complete dashboard-driven system that monitors **four distinct sessions** simultaneously, providing real-time status updates and precision alerts.
### 🎯 What is the Opening Range Breakout (ORB)?
The Opening Range is the price range established during the first period of the trading session (e.g., the first 15 or 30 minutes). This period represents the initial balance between buyers and sellers. A breakout from this range often signals the likely trend direction for the remainder of the session.
### 🚀 Key Features
**1. Multi-ORB Monitoring**
Stop switching settings constantly. This suite monitors four key ranges at once:
* **Pre-Market 15m** (08:00 – 08:15 ET)
* **Pre-Market 30m** (08:00 – 08:30 ET)
* **NY Cash Open 15m** (09:30 – 09:45 ET)
* **NY Cash Open 30m** (09:30 – 10:00 ET)
**2. Smart Status Dashboard**
A compact panel in the bottom-right corner gives you the live state of every session:
* **⏳ Waiting:** The session has not started yet.
* **⚡ Forming:** The range is currently being built.
* **↔️ Range:** The range has formed, but price is still contained within the range.
* **🚀 BULL / 📉 BEAR:** A confirmed breakout has occurred.
* **⛔ OFF:** The session is disabled in settings.
**3. "Dynamic Resolution" Technology**
This is a unique pro feature.
* **Precision:** The script *always* calculates the High/Low levels using 1-minute data, ensuring your support/resistance lines are pixel-perfect regardless of your chart timeframe.
* **Flexibility:** Breakout signals (Alerts/Labels) are triggered based on your *current* chart timeframe. This allows you to trade a 5m or 15m breakout strategy while keeping 1m-level precision on your levels.
**4. Visual Clarity**
* **Breakout Labels:** Automatically plots "BULL" or "BEAR" labels on the exact candle that confirms a breakout.
* **Profit Targets:** Optional toggle to show 1x and 2x profit targets projected from the breakout level.
* **Time-Bound Signals:** Signals are strictly time-bound to the active window to prevent late, low-quality alerts.
### 🛠️ How to Use
1. **Add to Chart:** Works best on intraday timeframes (1m, 5m, 15m).
2. **Configure:** Enable the sessions you trade (e.g., NY 15m) in the settings.
3. **Wait for Forming:** Watch the box form live. The dashboard will show "⚡ Forming".
4. **Trade the Break:** Wait for a candle **Close** outside the range. The dashboard will flip to "BULL" or "BEAR" and a label will appear.
5. **Manage Risk:** Use the opposite side of the range or the midline as your stop loss.
### ⚙️ Settings Overview
* **Global Settings:** Toggle forming boxes, dashboard, and label visibility.
* **Breakout Method:** Choose between **Close** (safer) or **Wick** (aggressive) for signal triggers.
* **Session Groups:** Individually enable/disable the 4 distinct sessions and customize their colors/styles.
---
*Disclaimer: This tool is for educational and analytical purposes only. Past performance of a strategy does not guarantee future results. Always manage your risk.*

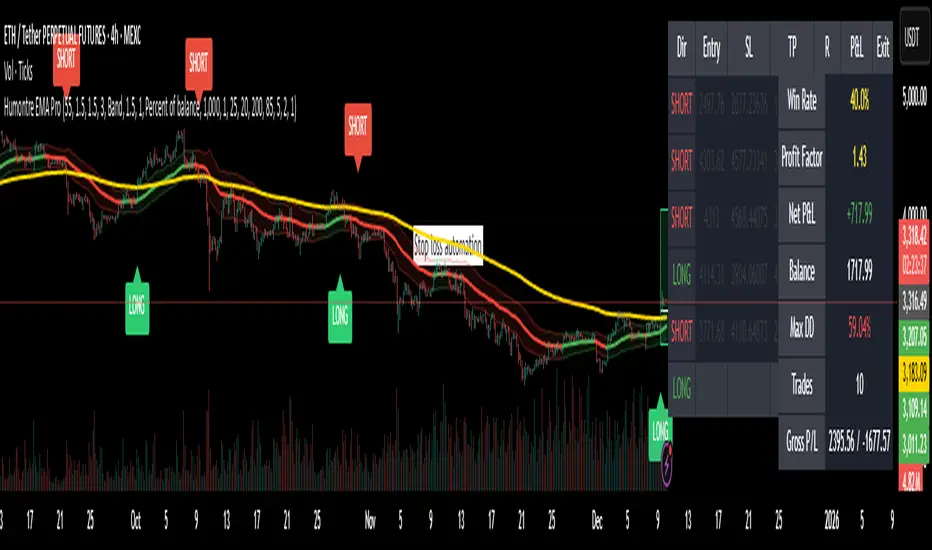
Adaptive Breakout & Risk Engine — Humontre EMA ProHumontre EMA Pro is a professional-grade trading system built for traders who want structure, clarity and real risk management integrated into every trade.
✔ No repainting
Instead of chasing signals or relying on unrealistic “high winrate” promises, this tool provides a consistent, repeatable process based on:
✔ Adaptive EMA breakout logic
✔ ATR-driven volatility channels
✔ Automatic SL/TP placement
✔ True R-multiple tracking
✔ Live trade visualization
✔ Smart signal filtering
✔ Performance statistics directly on the chart
This is more than an indicator — it’s a fully structured framework for traders who want discipline, confidence and objective risk management.
What’s included
✔ Private access to Humontre EMA Pro on TradingView
✔ Full feature set: breakout signals, EMA channel, risk engine
✔ Trailing stop system
✔ Live trade box & trade history table
✔ Win rate, profit factor, drawdown & R-metrics panel
✔ Alerts with Entry, SL, TP & risk-to-reward
✔ Continuous improvements & updates
Whether you're learning structure or refining your current system, this tool offers a clean and objective approach to trending markets: crypto, forex, metals and indices.
👤 About Humontre
I'm a trader and IT engineer who enjoys building tools that bring structure and clarity to the markets.
Humontre EMA Pro was designed to help traders visualize risk and understand trend dynamics with precision.
⚠️ Important
This is educational software. It does not guarantee profit.
Trading always carries risk.
Key Features
✔ Adapts to market volatility for precise SL/TP placement
✔ Trailing stop system
✔ Calculates Entry, Stop Loss, Take Profit and R-Multiples
✔ Filters duplicate entries and only signals the first valid setup per trend
✔ Visualizes active/past trades with P&L, R-values and exit reasons
✔ Detects high-quality trend breakouts using a dynamic EMA channel
Moving Average Channel Breakout (No Repaint) This indicator creates a channel using two simple moving averages: SMA of highs (upper line) and SMA of lows (lower line).
How it works:
- When a candle closes above the upper channel line, the following candles turn green (bullish trend)
- When a candle closes below the lower channel line, the following candles turn red (bearish trend)
- The trend color remains until a breakout in the opposite direction occurs
Anti-repaint:
This indicator does NOT repaint. The candle color is determined at the open, based on the previous candle's close. Once a candle opens with a color, that color never changes.
Breakout strategy:
- Candle opens green → Long entry signal
- Candle opens red → Short entry signal
The signal and entry moment are perfectly synchronized at the candle open, making it ideal for systematic breakout strategies.

Structure Breakout - Buy Sell IndicatorStructure Breakout - Buy Sell Indicator
📈 OVERVIEW:
A minimalist indicator that identifies market structure breakouts using swing point analysis.
Displays clear blue buy arrows and red sell arrows when price breaks key swing levels.
🔧 HOW IT WORKS:
1. Identifies swing highs and lows using configurable lookback period
2. Triggers BUY signal (blue arrow) when price closes above previous swing high
3. Triggers SELL signal (red arrow) when price closes below previous swing low
4. Uses clean visual arrows without cluttering the chart
⚙️ KEY FEATURES:
• Clean, uncluttered visual signals
• Customizable sensitivity period
• Blue arrows for buy signals (below bars)
• Red arrows for sell signals (above bars)
• No lagging repainting
• Works on all timeframes
🎯 TRADING APPLICATIONS:
• Swing trading entries
• Breakout confirmation
• Trend continuation signals
• Support/resistance breaks
⚡ SETTINGS:
• Structure Detection Period (default: 20) - Adjust sensitivity of swing detection
⚠️ RISK DISCLAIMER:
This is an educational tool. Always use proper risk management.
Past performance does not guarantee future results.

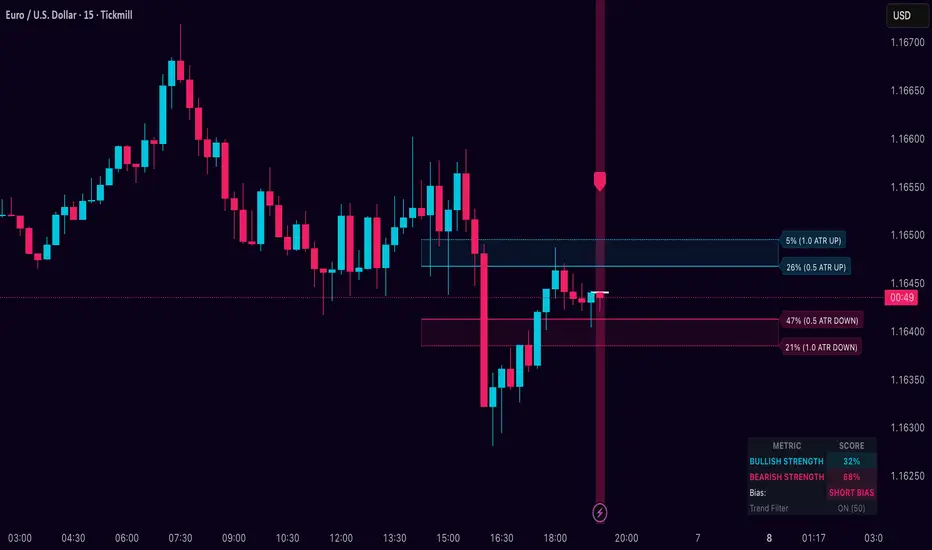
Dynamic Breakout Odds [RayAlgo]█ OVERVIEW
Dynamic Breakout Odds is a probability-based breakout tool that uses ATR and pattern matching to estimate how likely price is to expand up or down from the current candle.
Instead of guessing, the indicator scans historical candles that look like the current one and measures how often price broke above or below by a volatility-based amount.
It then projects those probabilities forward as clean levels and a bias dashboard on your chart.
Use it to quickly answer:
• “Is the next move statistically more likely up or down?”
• “How far does price typically travel from here, in ATR terms?”
█ CONCEPTS
Candle Profile Matching
The script builds a “profile” of the current setup using two elements:
• The color of the previous candle (bullish close vs bearish close)
• The trend environment (above/below EMA, if the filter is enabled)
Only historical candles with the same profile are used for statistics. This keeps the probabilities specific to the current context instead of mixing all market conditions together.
ATR-Based Expansion
For every matching historical candle, the script checks how far price moved away from the open using ATR:
• Upward move thresholds
• Moderate expansion (≈ 0.5 ATR above the open)
• Stronger expansion (≈ 1.0 ATR above the open)
• Downward move thresholds
• Moderate expansion (≈ 0.5 ATR below the open)
• Stronger expansion (≈ 1.0 ATR below the open)
It counts how often each expansion happened, then converts those counts into probabilities.
Normalized Probability Scores
The indicator doesn’t just show raw percentages; it normalizes them so that all scenarios together form a consistent probability set.
Internally it tracks four outcomes for similar candles:
• Chance of a moderate move upward
• Chance of a strong move upward
• Chance of a moderate move downward
• Chance of a strong move downward
These are then normalized so the total is roughly 100%. From this, two main metrics are derived:
• Bullish Strength = combined normalized odds of upside moves
• Bearish Strength = combined normalized odds of downside moves
Whichever side has the higher score defines the current directional bias .
█ WHAT YOU SEE ON THE CHART
1. Breakout Projection Levels
Four horizontal levels are projected around the open of the current bar:
• Two upside levels
• Nearer upside expansion (~0.5 ATR above the open)
• Further upside expansion (~1.0 ATR above the open)
• Two downside levels
• Nearer downside expansion (~0.5 ATR below the open)
• Further downside expansion (~1.0 ATR below the open)
Each line extends a configurable number of bars into the future, so you visually see a breakout “corridor” above and below price.
2. Probability Labels
At the right edge of each line, you’ll see a label such as:
• “X% – near upside”
• “Y% – further downside”
These labels tell you how frequently similar candles in the chosen lookback reached that expansion. You immediately know which scenario has been more common historically.
3. Breakout Zones
Between the paired upside lines and the paired downside lines, shaded “probability zones” can be shown:
• The upper shaded band highlights the typical upside expansion range
• The lower shaded band highlights the typical downside expansion range
These zones visually group probable target areas instead of just single lines.
4. Background Tint
The background behind price is softly tinted towards:
• Bullish color when Bullish Strength > Bearish Strength
• Bearish color when Bearish Strength > Bullish Strength
The stronger the statistical imbalance between the two, the more pronounced the tint. This gives you an instant feel for whether conditions lean more Long, more Short, or are nearly Neutral.
5. Directional Bias Arrow
On the last bar the script can plot a clean arrow:
• Up-arrow below price when bullish odds dominate
• Down-arrow above price when bearish odds dominate
The arrow is positioned beyond all projection lines, making it easy to see even on cluttered charts and reminding you of the current statistical bias without text.
6. Origin Marker
A small horizontal mark is drawn at the open of the current candle.
This acts as the “starting point” from which all ATR-based expansions above and below are measured.
7. Dashboard Panel
A compact dashboard is drawn in a corner of the chart (location configurable). It displays:
• Bullish Strength – combined normalized probability for upside expansions
• Bearish Strength – combined normalized probability for downside expansions
• Bias – “Long Bias”, “Short Bias”, or “Neutral”
• Trend Filter – shows whether EMA-based filtering is ON or OFF and which length is used
This gives you a quick, text-based summary of the current statistical environment.
█ SETTINGS
Analysis Lookback Period
• Controls how many historical bars the script inspects when searching for similar candles.
• Larger values = more history, smoother statistics, slower adaptation.
• Smaller values = faster adaptation, but more noise and less stability.
ATR Length
• The period used to compute ATR volatility.
• Defines how “big” 0.5 ATR and 1.0 ATR moves are on your current symbol and timeframe.
Trend Filter (EMA)
• Filter by Trend?
• When ON, only historical candles in a similar trend regime are used.
• When OFF, all past candles with similar color are considered, regardless of trend.
• Trend EMA Length
• EMA period used to classify trend.
• Price above EMA → uptrend environment.
• Price below EMA → downtrend environment.
This filter helps you separate behavior in uptrends from downtrends, which can significantly change breakout dynamics.
Visual Settings
• Projection Width (bars)
• How far the lines and zones extend into the future.
• Show Probability Zones
• Toggle shaded bands between each pair of levels.
• Label Size
• Choose smaller or larger text for the probability labels on the right.
• Tint Background by Bias
• Turn the bias-based background on or off.
• Show Bias Marker on Last Candle
• Toggle the up/down arrow marker.
• Dashboard Location
• Select top/bottom left/right corner for the panel.
█ HOW TO USE IT
1. Start With the Dashboard
Look at Bullish Strength vs Bearish Strength:
• If bullish is clearly larger → environment statistically favors upside expansion.
• If bearish is clearly larger → environment statistically favors downside expansion.
• If they are close → treat the situation as Neutral; consider reducing position size or waiting for more clarity.
2. Use Levels as Dynamic Targets
The projected lines and zones can serve as:
• Profit targets based on typical expansion distance
• Logical regions for scaling out
• Areas where you expect price behavior to change (e.g., loss of momentum)
Short-term traders often focus on the nearer expansion levels, while swing traders may use the farther levels as extended targets.
3. Align With Trend (Optional)
With the trend filter ON:
• Prefer Long setups when price is above the EMA and bullish probabilities dominate.
• Prefer Short setups when price is below the EMA and bearish probabilities dominate.
With the filter OFF, you get pure color-plus-pattern statistics across the whole lookback, which can be useful if you deliberately trade counter-trend or range conditions.
4. Combine With Your Existing System
Dynamic Breakout Odds is best used as a confirmation and targeting layer :
• Combine it with structure (support/resistance, supply/demand, order blocks).
• Combine it with volume or orderflow tools if you use them.
• Use the probability zones to validate whether your planned target is realistic relative to recent volatility.
It is not designed to be a standalone “buy/sell” signal generator, but a statistical map around your entries.
█ PRACTICAL EXAMPLES
Example A – Bullish, Moderate Expansion Frequently Hit
• Bullish Strength significantly higher than Bearish Strength.
• The nearer upside level shows a strong historical hit rate.
Interpretation: similar setups often produce at least a moderate push upward before failing.
Use case: trade pullbacks in the direction of the bias, targeting the nearer upside projection as an initial take-profit.
Example B – Bearish, Deeper Downside Often Reached
• Bearish Strength clearly dominant.
• Both the nearer and farther downside levels show decent probabilities.
Interpretation: similar conditions historically saw follow-through to the downside.
Use case: use rallies against the direction of the bias to position into shorts, planning partial exits around the first downside projection and runners toward the second.
Example C – Neutral, Balanced Probabilities
• Bullish and Bearish Strength scores are close.
• Background tint is very light or absent.
Interpretation: the market is statistically indecisive; expansions up or down are similarly likely.
Use case: consider range trading tactics, mean-reversion ideas, or simply standing aside until a clearer skew develops.
█ BEST PRACTICES
• Use on liquid symbols and reasonable timeframes to avoid distorted ATR behavior.
• Don’t overfit lookback length to a single instrument; test across markets.
• Let the indicator provide context, not absolute certainty.
• Always combine with proper risk management (position sizing, max loss per trade, etc.).
• Be cautious with very small sample sizes (e.g., very short lookbacks on low-volume assets).
█ LIMITATIONS & NOTES
• All probabilities are based on historical behavior ; markets can change regime.
• ATR distances are relative to recent volatility and may shrink/expand over time.
• The script intentionally does not guarantee any direction or target; it only reports what has been most common in similar past situations.
█ DISCLAIMER
This tool is for educational and informational purposes only.
It does not constitute financial advice or a guarantee of performance.
Always do your own research, test on demo or historical data, and use appropriate risk management when trading live capital.
Daniel.Yer Volume Breakout Signal🧠 Summary – Daniel.Yer Volume Breakout Signal
The indicator only works on time frames of minutes.
An indicator that detects high-volume breakouts after the market opens and highlights potential entry zones.
Based on sampling the opening volume window and comparing it to the session’s volume peak.
Visually marks preparation areas (colored background) and plots BUY/SELL triangles for confirmation candles.
Includes real-time alert conditions for leading tickers: SPY, AAPL, MSFT, META, AMD, TSLA, NVDA, PLTR, GOOG, and AMZN.
Optimized for day trading — provides actionable alerts even when the user is offline.

Breakout Volume Momentum [5m]Breakout Volume Momentum Indicator (Pine Script v5)
This TradingView Pine Script v5 indicator plots a green dot below a 5-minute price bar whenever all the breakout and volume conditions are met. It is optimized for live intraday trading (not backtesting) and includes customizable inputs for thresholds and trading session times. Key features and conditions of this indicator:
Gap Up Threshold: Current price is up at least X% (default 20%) from the previous day’s close (uses higher-timeframe daily data) before any signal can trigger.
Relative Volume (RVOL): Current bar’s volume is at least Y× (default 2×) the average volume of the last 20 bars. This ensures unusually high volume is present, indicating strong interest.
Trend Alignment: Price is trading above the VWAP (Volume-Weighted Average Price) and above a fast EMA. In addition, the fast EMA (default 9) is above the slower EMA (default 20) to confirm bullish momentum
tradingview.com
tradingview.com
. These filters ensure the stock is in an intraday uptrend (above the average price and rising EMAs).
Intraday Breakout (optional): Optionally require the price to break above the recent intraday high (default last 30 bars). If enabled, a signal only occurs when the stock exceeds its prior range high, confirming a breakout. This can be toggled on/off in the settings.
Avoid Parabolic Spikes: The script skips any bar with an excessively large range (default >12% from low to high), to avoid triggering on spiky or unsustainable parabolic candles.
Time Window Filter: Signals are restricted to a specific session window (by default 09:30 – 11:00 exchange time, typically the morning session) and will not trigger outside these hours. The session window is adjustable via inputs
stackoverflow.com
.
Alerts: An alert condition is provided so you can set a Trading View alert to send a push notification when a green dot signal fires. The alert message includes the ticker and price at the time of signal.

Screener - Moving Average / ATR Breakout Signal [ARTech]Screener - Moving Average / ATR Breakout Signal
This indicator features a powerful multi-symbol screener that scans up to 40 user-defined symbols in real time for Moving Average (MA) and ATR breakout signals. Users can customize the list of symbols, select the asset class (e.g., Crypto, Stocks, Forex). The screener detects trend-following signals based on price crossing a chosen MA type and length, enhanced by optional ATR-based volatility filters and breakout thresholds to improve signal accuracy. Signals can be displayed on the chart via labels, tooltips, or a compact signal table, allowing traders to monitor multiple markets simultaneously without switching charts. The list of symbols generating signals can also be tracked with customizable alerts, enabling traders to receive real-time notifications for long and short breakout signals directly via TradingView alerts.
This indicator is developed based on the concept of Moving Average / ATR Breakout Signal script on TradingView, with enhancements to support multi-symbol scanning.
Key Features
• Multi-Symbol Screener: Scans up to 40 user-defined symbols simultaneously, with automatic separator detection and symbol validation.
• Repaint Prevention: Carefully designed to avoid repaint issues. The script structure and signal logic have been built to ensure reliable behavior, even across multiple symbols and varying chart conditions.
• Flexible Signal Display: Offers chart labels, tooltips, or a compact table to show signals, enabling multi-market monitoring without switching charts.
• Customizable Alerts: Supports alerts for both long and short signals, sending a list of symbols generating signals as real-time notifications.
• Multi-Type Moving Average Support: Choose from several MA types including EMA, SMA, Hull MA, VWMA, RMA, and TEMA, with customizable source and length settings.
• Flexible Signal Logic: Generates signals when price breaks above or below the selected MA, with options for confirmation candles and wick or close based breakout detection.
• ATR-Based Filtering: Utilizes ATR to create dynamic breakout bands around the MA, reducing noise and improving breakout validation.
• Breakout Threshold Filtering: Adds an optional minimum percentage price move before a new opposite signal is allowed, preventing rapid reversals.
Why use this indicator?
• Scans up to 40 symbols at the same time.
• Users can define the symbol list, asset class, and automatically detects the symbol separator; warns if any symbols are invalid
• Detected signals are shown directly on the chart as labels, tooltips, or in a compact table.
• The list of signal-generating symbols can be tracked with alerts — no need to watch the chart constantly.
How to Use
███████ Alerts ███████
🔸 Long / Short
To enable Custom Alerts, select the desired alert type (Long or Short) from the indicator's settings under the "Alerts" section, you can customize messages and enable notifications for Long and Short signals. Then, you need to activate the fx alert() function call option in TradingView’s alert creation dialog.
Alert messages include your custom message followed by a list of symbols currently giving signals, each shown on a new line. For example, if your input message is set to “🟢 Long Signal” and BTCUSD and ETHUSD are signaling, the alert will look like this:
🟢 Long Signal
BTCUSD
ETHUSD
This format helps you clearly see the type of signal and each symbol individually, making real-time monitoring easier.
🔸 Alert Delay (seconds)
This setting adds a delay before alerts are triggered. It helps ensure that signals are based on confirmed bar closures for slight timing differences between symbol data feeds (especially in multi-symbol mode). For example, setting a 30-second delay allows all symbols to finish processing before the alert fires, avoiding early or incomplete signal lists.
For best results, try different delay values to see what works best with your selected timeframe.
███████ Display / Signal ███████
🔸 Display Mode
Choose how the indicator presents signals on your chart. Focus on a single symbol (Chart mode), Scan and display multiple symbols at once (Screener mode), or hide visuals and use only tables or alerts (No mode).
• Chart Mode: Displays signals only for the current chart symbol. Useful for testing and optimizing signal conditions before scanning multiple assets.
• Screener Mode: Activates the screener functionality, showing results for all valid symbols in your list. Signals appear as labels on the chart and are also listed in the signal table for easy tracking.
• No (Table Only): Hides all on-chart visuals (labels, markers). Signals are still processed and can be viewed in tables or used with alerts. This mode is ideal when you're using multiple screeners at once and want to avoid overlapping visuals. Each screener can display its results in separate table positions (e.g., bottom right, top left, etc.), so turning off chart visuals helps keep your workspace clean while still tracking multiple symbol groups efficiently. This way, you can also track more than 40 symbols by using multiple screener instances with different symbol groups and table positions.
🔸 Long
You can independently turn ON or OFF the display of Long signals using the toggle.
🔸 Short
You can independently turn ON or OFF the display of Short signals using the toggle.
███████ Symbols ███████
🔸 Symbols
You can enter up to 40 symbols. Symbols must be written in full format. For example: BINANCE:BTCUSDT, NASDAQ:AAPL, or OANDA:EURUSD. TradingView requires this full format to correctly recognize each symbol. Due to TradingView’s limitations, only the first 40 symbols in your list will be processed
- Separator Rules: Letters (A–Z), numbers (0–9), underscore (_), dot (.), and exclamation mark (!) are allowed within symbol names (e.g., BINANCE:BTCUSDT.P). Therefore, avoid using them as separators. Instead, use comma (,) , semicolon (;) , space , or newline to separate multiple symbols.
- Auto Detection: The indicator automatically detects the separator used in your list. If the format is incorrect or a symbol is invalid, a warning will appear to help you fix it.
🔸 Symbol Filter
When scanning multiple symbols, it's important that they belong to the same market type (Crypto, Stocks, Forex, etc.). Different markets have different trading hours, and mixing them may cause issues.
For example, if your chart is using a stock symbol (like NASDAQ:AAPL) and your symbol list includes crypto symbols (like BINANCE:BTCUSDT), the screener may not work correctly. Since stock markets are not open 24/7, the chart time may fall outside of crypto trading hours — causing crypto signals to fail or not update properly.
To avoid this issue, the indicator includes a Symbol Filter. This lets you filter your symbol list to include only the correct asset type (e.g., only Crypto or only Stocks). By using this filter, you make sure the screener runs under the correct market conditions and avoids signal mismatches.
If you set the filter to None , no filtering will be applied. In this case, you are responsible for making sure all listed symbols match your chart’s market type.
For best results, always use symbols from the same market type as your chart symbol. This ensures that candle open/close times align across all symbols, avoiding timing mismatches. Symbols and the chart must follow the same market hours for accurate and consistent signal generation.
🔸 Show Symbols on Table
This feature helps you quickly review the symbols you've entered. When enabled, a table appears in the bottom-right corner of the chart displaying all symbols from your list along with their market types and statuses
- Green background: Symbol is valid and matches the selected Symbol Filter. It can generate signals.
- Gray background: Symbol is valid but does not match the selected filter. It will not generate signals.
- Red background: Symbol is invalid (e.g., due to incorrect names, delisting, or unsupported by broker).
You don’t need to remove invalid or mismatched symbols, but no signals will be generated for them. This visual check makes it easier to catch symbol issues before relying on the screener output.
███████ Signal Display Style ███████
🔸 Display Method
Choose how signals will be shown visually
• Label: The signal appears as a label on the candle. The label includes all triggering symbols as text.
• Tooltip: An icon (such as 🟢 or 🔴) is shown instead of full text. Hold your mouse pointer on the icon on chart for a few seconds to see a tooltip listing the triggered symbols. This method keeps your chart cleaner and less cluttered.
• None: No visual markers appear on candles. Signals are only visible in the signal table — ideal if you're using multiple indicators and want to avoid chart clutter.
🔸 Symbol Display Format
This setting affects the labels, tooltips, signal table, and alert messages, ensuring consistency across all displays. Select whether you want symbols to appear as:
• EXCHANGE:SYMBOL: BINANCE:BTCUSDT
• SYMBOL: BTCUSDT
🔸 Long Signal Icon
Used only in Tooltip mode, these icons (e.g., 🟢 for Long) appear on bars where signals are detected. Customize it freely to match your style or strategy.
🔸 Short Signal Icon
Used only in Tooltip mode, these icons (e.g., 🔴 for Short) appear on bars where signals are detected. Customize it freely to match your style or strategy.
🔸 Size
Adjust the visual size of labels or tooltips. Smaller sizes help reduce clutter when many signals trigger in close proximity.
███████ Signal Table ███████
This section controls the appearance and behavior of the signal table that displays last detected Long and Short signals for your symbols.
🔸 Show
Enable or disable the signal table display on the chart.
🔸 Highlight Signal Duration (Bars)
When a signal occurs, the corresponding cell in the table is highlighted using the selected Long or Short color for this many bars. This helps visually track recent signals over time. The bar where the signal icon appears is counted as 1.
🔸 Table Size
Choose the size of the table to fit your chart layout and readability preferences.
🔸 Table Position
Select where the table appears on your chart (e.g., top right, middle right, bottom left).
🔸 Title
Customize the table header text. The default is “Recent Signals”.
🔸 Background Color
Set the table’s background color and transparency to match your chart’s theme.
🔸 Long Signal Color
Choose the highlight color used to mark Long signals within the table.
🔸 Short Signal Color
Choose the highlight color used to mark Short signals within the table.
🔸 Text Color
Customize the text color inside the table for better contrast and readability.
🔸 Show Bars Since Signal
Optionally display how many bars have passed since each signal appeared. The bar where the signal occurs counts as 1.
███████ Signal ███████
This is the core component of the signal system. You can customize:
🔸 Moving Average Type
Choose from SMA, EMA, WMA, Hull MA, VWMA, RMA, or TEMA
🔸 Length
Adjust the length to suit your strategy.
🔸 Source
Select which price data (e.g., Close, Open, HL2) is used to calculate the MA.
🔸 Confirm Candles
Defines the number of consecutive candles that must break the selected level to confirm a signal.
– If ATR filter is enabled, this level is the ATR bands.
– If ATR is disabled, the Moving Average line is used.
This helps filter out noise and avoid premature signals.
🔸 Break Type
Specifies how the candle must break the level:
– Close: The candle must close beyond the level.
– Wick: A wick touching or exceeding the level is enough.
Both options generate signals only after the candle has closed.
🔸 Filter
This section provides optional filters to improve signal accuracy.
ATR
When the ATR filter is enabled, signals are generated only if the price breaks above the upper ATR line or below the lower ATR line—calculated by adding or subtracting the ATR multiplied threshold from the moving average—and the breakout must occur for the number of consecutive confirmation candles specified by the user input . This helps reduce false signals during low volatility periods.
• Multiplier: Adjusts the width of ATR bands by multiplying the ATR value.
• Length: Sets the period for ATR calculation.
• Smoothing: Selects the smoothing method applied to the ATR (RMA, SMA, EMA, WMA).
Breakout
When enabled, breakout confirmation requires the price to cross above the upper breakout line or below the lower breakout line by a specified percentage from the last signal price.
• Threshold (%): Defines the minimum percentage price movement required to validate a breakout.
• Show Breakout Levels: Toggle to display or hide breakout threshold area on the chart.

Opening Range Breakout Detector📈 Opening Range Breakout Detector (TF-Independent)
Tracks breakouts with precision. No matter the chart, no matter the timeframe.
This indicator monitors whether price breaks above or below the Opening Range across multiple key durations — 1m, 5m, 10m, 15m, 30m, 45m, and 60m — using 1-minute data under the hood, while you can work on higher timeframe charts (daily, etc.).
Highlights:
✅ Status table shows which ORs broke UP or DOWN
⏱ Control which timeframes to track
🖼 Customizable table position, size and colors
Crafted by @FunkyQuokka

Katalyst's Opening Range BreakoutKatalyst's Opening Range Breakout + No Trade Zone
📜 Overview:
This indicator allows traders to visualize the high and low of the opening range for a user-selected timeframe (e.g., 30s, 1m, 5m, 15m). It features fully customizable lines, labels, and an optional **No Trade Zone** fill to help you identify breakout levels with ease.
---
🎯 Key Features:
1. **Customizable Opening Range**:
- Select your preferred opening range duration: **30 seconds, 1 minute, 2 minutes, 5 minutes, 10 minutes, or 15 minutes**.
- The indicator calculates and plots the **high** and **low** of the selected opening range.
2. **Dynamic Line Styling**:
- Choose the **line color**, **transparency**, and **style**: **Solid, Dashed, or Dotted**.
- Lines extend to the right of the chart for clarity.
3. **No Trade Zone** *(Optional / Disabled by default)*:
- When enabled, fills the area between the high and low lines with a customizable **color and transparency**.
- Helps visually identify consolidation areas where trading might be avoided.
4. **Labels for Precision**:
- Clearly displays the **Opening Range High** and **Low** values.
- Labels are color-coded and positioned dynamically for easy interpretation.
5. **Clean and Efficient Updates**:
- The indicator deletes old lines, labels, and fills before creating new ones, ensuring a clutter-free chart.
---
⚙️ How to Use:
1. **Select Your Timeframe**:
- From the settings, choose your desired opening range duration: 30s, 1m, 2m, 5m, 10m, or 15m.
2. **Customize the Visuals**:
- Adjust line color, style, and transparency.
- Enable the **No Trade Zone** for a transparent background fill between the high and low lines.
3. **Interpret the Breakout**:
- Watch for price movements above or below the **opening range** to identify potential breakout opportunities.
---
🛠 Settings:
Opening Range Duration: Select the timeframe for the opening range (30s, 1m, 2m, 5m, 10m, 15m).
Line Color: Set the color of the range lines.
Line Transparency: Adjust the transparency of the lines (0 = solid, 100 = invisible).
Line Style: Choose line style: Solid, Dashed, or Dotted.
Label Colors: Customize the label colors for the high and low values.
Enable No Trade Zone: Fill the area between high and low lines with a transparent color.
No Trade Zone Color: Set the fill color for the no trade zone.
No Trade Zone Transparency: Adjust the transparency of the no trade zone fill.
---
📈 Ideal For
Day traders and scalpers looking to trade **breakouts**.
Traders who want to identify areas of consolidation visually.
Anyone who relies on the **opening range** for their trading strategy.
---
🔍 Example Usage:
Set the opening range to **5 minutes** and enable the **No Trade Zone** with a light red fill.
Watch for price to break above or below the high/low lines to signal potential trade opportunities.
---
✨ Why Use This Indicator?
This script simplifies your breakout strategy by providing a clear, visually appealing representation of the opening range. The flexible customization options and the optional **No Trade Zone** make it a powerful tool for identifying high-probability trades.
---
Let me know if you need any additional tweaks or clarifications for this description. It's all set to help traders understand and use your powerful script! 🚀📈
