Probability of Candle Close Higher Than OpenThe "Probability of Candle Close Higher Than Open" indicator is designed to help traders assess the likelihood of a given candle closing higher than its open based on the previous candle's price action. It does this by calculating a probability score between 0 and 1 and displaying it on the chart, along with a horizontal line representing a user-defined probability threshold.
The indicator uses three input variables to determine the probability score:
lookback_period: This input defines the number of previous candles to consider when calculating the probability. By default, it is set to 2, meaning the indicator considers the previous two candles.
prev_high and prev_low: These variables are calculated using the highest() and lowest() functions, respectively, and represent the highest high and lowest low of the previous lookback_period candles.
prev_body: This variable calculates the absolute value of the difference between the open and close prices of the previous candle.
The probability score is then calculated based on the following conditions:
If the current candle's open price is higher than the previous lookback_period candles' highest high, the probability score is set to 0.1 (indicating a low probability of the candle closing higher than its open).
If the current candle's open price is lower than the previous lookback_period candles' lowest low, the probability score is set to 0.9 (indicating a high probability of the candle closing higher than its open).
If neither of the above conditions apply, the probability score is calculated using the following formula:
If the previous candle closed higher than its open, the probability score is set to 0.5 plus half of the previous candle's body (i.e., the absolute difference between its open and close prices).
If the previous candle closed lower than its open, the probability score is set to 0.1 plus half of the previous candle's body.
If the previous candle closed at the same price as its open, the probability score is set to 0.1.
Finally, the indicator plots the probability score as a label on the chart and a horizontal line representing the probability threshold.
Disclaimer:
Trading involves significant risk and is not suitable for all investors. The "Probability of Candle Close Higher Than Open" indicator is for informational purposes only and should not be used as the sole basis for making trading decisions. Always conduct your own research and due diligence before entering any trades. No guarantee or warranty is given as to the accuracy or completeness of the information provided by this indicator, and any reliance on this information is at your own risk. Past performance is not necessarily indicative of future results. Trading with margin carries the risk of losing more than your initial investment. Only trade with risk capital that you can afford to lose.
Cari dalam skrip untuk "candle"

50% candlestick closeThis indicator is useful at important level, when you want to see some bullish or bearish signs in candlestick.
At your important support level you can buy, if candlestick close is above 50% of its range, with low of this candlestick as SL.
At your important resistance level you can sell, if candlestick close is below 50% of its range, with high of this candlestick as SL.

Detect BOS in Five Candles with MTF - Alert [MsF]Japanese below / 日本語説明は英文の後にあります。
-------------------------
*This indicator is based on azmathshah's "Last Three Candles each of Two HTF".
It's a very cool indicator. thank you.
You can detect trend reversal with candlesticks.
It's MTF compatible and can display up to 2 sets of 5 candles of any time frame on the right side of the chart.
By displaying the candles of the upper time frame bars, you can check the trend change and measure the entry timing with the lower time frame bars.
There are two types of alerts.
"Liquidity Sweep": This is an alert when the upper beard (high) of ③ is touched with the next foot.
"Candle Close": An alert when the upper whisker (high) of ③ is exceeded by the closing price of the next bar (generally a strong signal)
-------------------------
ローソク足でトレンド転換を検知するインジケーターです。
MTF対応となっておりチャートの右側に任意タイムフレームのローソク5本を最大2セット表示できます。
上位足のローソクを表示することにより、トレンド転換確認しながら、下位足でエントリータイミングを計ることができます。
アラートは2種類あります。
"Liquidity Sweep":③の上ヒゲ(high)を次の足でタッチした場合のアラートです
"Candle Close":③の上ヒゲ(high)を次の足の終値で上回った場合のアラートです(一般的には強力なシグナルとなります)

Breakout Candles + RSIHello!
This is my firt script :)
This indicator looks for candles that are significantly larger than the previous X candle.
It is possible to set the following:
Multiplier: deviation from the size of the previous X candle (if set to 3 the size of the actual candle's body /abs(open - close)/ must be larger than the size of the bigger candle from the prevous X candles)
Previous candles: the number of previous candles to size check
Upper RSI limit: if the RSI14 close higher than the specified number, the candle will ignore
Lower RSI limit: if the RSI14 close lower than the specified number, the candle will ignore
Without dojis: if checked, watches candles only that do not have a bottom spike (bullish) or top spike (bearish). Useful for Heikin-Ashi candles
Feel free to left any suggestion!
Thank You!

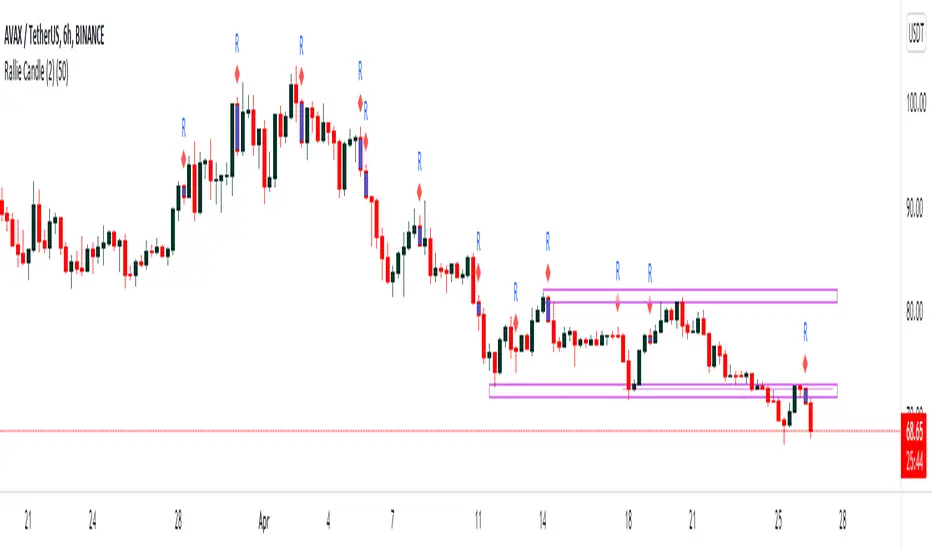
Rally Candle (End Game ) 26/04/2022 Few Months ago I started wanted to code a candle which alerts me when a Rally may be over in Bearish Conditions and today I have created a candle which is 1. subjective but more importantly appears in areas where buying pressure is at either a climax or in the process of a decline and this is where the Rally Candle signals. This shows momentum may be shifting and these can provide some good entries.
They will only working when price is below the 200ema and in overextended markets - VERY IMPORTANT!!!
Works on all timeframe with HTF providing more price percentage than LTF
They aren’t a specific candle size however they will repaint when we see 4 higher close candles followed by a candle which has closed lower than the previous 4th.
//Candle Conditions
This candle has to be in a swing high area to be valid and on 1H and 6H but the 1H will repaint a lot of candles so when we have a point system of +20 we can assume this setup is a good setup.
//Candle Operators
You can change the color of the bar to your liking
There is a ema filter so if you want to candle to not show candles of the 50ema this operator will do the command.
Please post requests and any potential implementations I could port to pine script.
Hope you Enjoy :)
Volume Filtered *All Candlestick Patterns* [KT] Hello!
This script uses TradingView's *All Candlestick Patterns* indicator and includes a volume filter.
The frequency of each candlestick pattern is recorded in addition to the subsequent session's outcome - higher or lower close.
The requisite volume for the pattern is configurable; formations will not be distinguished when volume is less than the defined lower threshold.
For example, setting the volume threshold to 10% forces the script to identify candlestick patterns in which volume for the session (candle) is 10% greater than the volume moving average. All candlestick patterns with volume less than (1.10 * volume MA) are discounted.
The script counts the frequency of each pattern - the number of times the pattern occurred - in addition to the next candle's outcome.
Pertinent statistics are displayed in the table, which can be hidden.
I plan on working on the script quite a bit more; please comment a suggestion if you have one! What else should be included?

Cumulative Volume Delta CandlesCVD Trend Candles
Visualize buying and selling pressure directly on your price candles. This indicator colors your candlesticks based on Cumulative Volume Delta (CVD), helping you see the underlying order flow driving price action.
WHAT IS CVD?
Cumulative Volume Delta estimates the difference between aggressive buying and selling volume on each bar. Positive delta indicates more aggressive buying; negative delta indicates more aggressive selling.
COLOR METHODS
▸ CVD Raw
The simplest view—candles are colored based purely on the raw delta of each bar.
• Cyan = Positive delta (net buying)
• Red = Negative delta (net selling)
▸ Rule-Based (Default)
Uses Heikin Ashi-smoothed CVD candles with intensity based on trend strength:
• Bright colors = Strong conviction (larger body + continuation)
• Medium colors = Moderate conviction (continuation)
• Dark colors = Weak/indecision (inside candles, hesitation)
▸ Size-Based
Colors intensity based on z-score of delta changes:
• Bright colors = Statistically significant delta (above strong threshold)
• Medium colors = Moderate delta (above moderate threshold)
• Dark colors = Normal/quiet delta
KEY FEATURES
◆ Kalman Filter Smoothing
Adaptive filtering reduces noise while staying responsive to genuine shifts in order flow. Adjust sensitivity with the Responsiveness and Kalman Gain settings.
◆ Inside Candle Rule
When enabled, prevents false signals from inside candles that show a direction change but lack conviction. The candle retains the previous trend's color (dimmed) instead of flipping.
◆ Session Anchoring
Optionally reset cumulative delta at a specific time (e.g., market open) for intraday analysis.
◆ Z-Score Thresholds
Fine-tune what constitutes "strong" vs "moderate" delta activity for Size-Based coloring.
HOW TO USE
1. Add the indicator to your chart
2. Set your chart type to "Line" or bring the indicator to front via Visual Order → Bring to Front
3. Select your preferred Color Method
4. Look for:
• Sequences of bright cyan candles → Strong buying pressure / bullish momentum
• Sequences of bright red candles → Strong selling pressure / bearish momentum
• Fading colors → Weakening conviction, potential reversal or consolidation
• Color flips → Shift in order flow dominance
Notes
• This indicator estimates delta from OHLCV data. For true order flow analysis, consider using tick or trade data from your broker/exchange.
• Works on all timeframes and instruments with volume data.
• Best used in conjunction with support/resistance levels, market structure, or other confluence factors.

CVD – Visible Range Candles & Line (Cumulative Delta Volume)Disclaimer:
This indicator is provided for informational and educational purposes only. It does not constitute investment advice, trading advice, or a recommendation to buy or sell any financial instrument. The author assumes no liability for any losses, damages, or errors arising from use or misuse of this script. Please test thoroughly and use at your own risk.
________________________________________________________________________________
Purpose
This indicator provides a fast and clear visualization of Cumulative Delta Volume (CVD) for the currently visible chart range in TradingView. It helps traders identify buy/sell volume pressure and market sentiment over any custom timeframe, with full control over reset intervals and chart style.
Key Features
CVD by Visible Bars: Dynamically calculates CVD only for bars currently visible on the chart, so scrolling and zooming always rescale the line and candles to your view.
Style Selection: Choose line or candlestick display. Candles include both standard OHLC and optional Heikin Ashi smoothing.
Automatic Resets: Restart CVD accumulation at the beginning of every day, week, month, or quarter. Choose ‘None’ for ongoing accumulation.
Fully Custom Colors: Line color, candle body, wick, border – all optimized for clarity and customizable via the indicator’s Style tab.
Autoscale Support: Always fits your timeframe. No need to adjust scale manually.
Zero-Level Reference: Includes a horizontal zero line for quick reversal detection.
Input Parameters
Style: "Line" or "Candles" – controls visual type
Heikin Ashi candles: Enable smoothing for candle view
Show Line: Toggle CVD line visibility
Reset CVD: Options: None, Daily, Weekly, Monthly, Quarterly
How To Use
Add the indicator to your TradingView chart.
Select your preferred visual style (Line or Candles).
Choose reset frequency based on your trading timeframe.
Customize colors in the Style tab (line, candle up/down, wick, border).
Scroll or zoom on the chart – the indicator’s range always fits the currently visible bars.
Typical Use Cases
Intraday traders tracking open/close session volume delta
Swing traders identifying quarterly or monthly market accumulations
Visualizing buy/sell pressure divergence at reversal points
Comparing volume sentiment across flexible chart intervals
Formula
Delta calculation: Delta=volume×(sign(close−open))
Accumulation: Resets at user-chosen intervals, CVD plotted for only visible bars
Author
Created by Ronen Cohen

IU Three Line Strike Candlestick PatternIU Three Line Strike Candlestick Pattern
This indicator identifies the Three Line Strike candlestick pattern — a rare yet powerful 4-bar reversal setup that captures exhaustion and momentum shifts at the end of strong trends.
Pattern Logic:
The Three Line Strike is a 4-candle pattern that typically signals a sharp reversal after a sustained directional move. This script detects both bullish and bearish variations using strict criteria to ensure accuracy.
Bullish Three Line Strike:
* Previous three candles must be bearish (red)
* Each of these candles must close progressively lower (indicating a strong downtrend)
* The current candle must:
* Be bullish (green)
* Open below the prior close
* Completely engulf the previous three candles by closing above the first candle's open
* And make a higher high than the last 3 bars — confirming a strong reversal
* Once confirmed, a green shaded box is drawn around the 4-bar zone to highlight the pattern
Bearish Three Line Strike:
* Previous three candles must be bullish (green)
* Each must close progressively higher (indicating a strong uptrend)
* The current candle must:
* Be bearish (red)
* Open above the prior close
* Completely engulf the prior three candles by closing below the first candle's open
* And make a lower low than the last 3 bars — confirming downside strength
* A red shaded box is plotted around the 4-bar formation to emphasize the reversal zone
Why this is unique:
Most candlestick tools focus on 1–2 bar patterns. The Three Line Strike goes a step further by combining trend exhaustion (3 same-colored candles) with a full reversal engulfing candle. This pattern is both rare and highly expressive of sentiment shift, making it a standout signal for discretionary and algorithmic traders alike.
How users can benefit:
* High-probability setups: Filters out weak signals using multi-bar confirmation logic
* Clear visual cues: Dynamic shaded boxes and labels make spotting reversals effortless
* Cross-timeframe compatible: Works on intraday and higher timeframes across all markets
* Real-time alerts: Get notified instantly when a bullish or bearish setup forms
This indicator is a valuable addition for traders who want to capture key reversals backed by strong multi-bar price action logic. Whether you are a price action purist or a pattern-based strategist, the IU Three Line Strike gives you a reliable edge.
Disclaimer:
This script is for educational purposes only and does not constitute financial advice. Trading involves risk, and past performance is not indicative of future results. Always do your own research and consult with a licensed financial advisor before making trading decisions.

Engulfing Candle with Streaks and CountIdentifies Engulfing Candles + The Number of Consecutive Signals + Identifies 3rd/4th Consecutive Signals + Keeps Count of Most Recent Number of Signals as Decided by User.
- Have coded in the latest version 6
- This script allows the tracking of engulfing candles over a user defined amount of time (candles).
- The script will signal every engulfing candle and its consecutive corresponding number across the entire chart.
- The Engulfing Count box in the bottom right counts how many bullish and bearish engulfing candles have occurred over the number decided by the user.
- The Engulfing Signal that prints is triggered when an opposite next candle prints and the body is over 100% larger than the previous candle. It does not need to "fully engulf" the previous candle, the coding has an allowance for an "equal to and greater/smaller than" the previous close price. This allows for signals were the open of the engulfing candle can be equal to the close of the previous opposite, however the engulfing still must reach an over 100% sizing of the previous to print a signal.
- Where a piercing candle occurs and the open price is within the body of the previous candle, this will void the equation and no matter how big the candle is, it will not trigger an engulfing signal as I was only looking for true engulfing candles.
- The script keeps count of the same consecutive signals no matter the timeframe.
- It will print the consecutive number above or below the signal (depending if bullish or bearish).
- To assist with trend identification the 3rd consecutive signal will print blue, and the 4th consecutive signal will print yellow (or I prefer to use the term "Gold"). This can help filter out the noise on lower timeframes to assist to see where the momentum is going, or if there are signals going against the trend to try trick traders.
- Back testing I found the 3rd and 4th signals are uncommon on higher timeframes and tend to act as fake-outs before the trend reverses.
- Overall a good tool to add to your trend analysis, either for additional confluence or to assist with reversal identification.
- Colors are set as default, but everything can be changed by the user as I didn't want to limit its possibilities.
*** Please note that this script does not take into any consideration candle wicks. Although it can be used with Heikin Ashi it is somewhat unreliable. This indicator is designed to be used with standard candles only ***

RSI Candles with EMA byAuncleJoeThe Relative Strength Index (RSI) is one of the most widely used momentum indicators in trading. It helps traders assess whether an asset is overbought or oversold by measuring the speed and magnitude of recent price changes. Traditionally, RSI is displayed as a single line oscillating between 0 and 100, but this representation can sometimes make it difficult to spot trends, reversals, and momentum shifts effectively.
To enhance RSI visualization and usability, the RSI Candles with EMA indicator transforms the RSI values into candlestick charts, providing a more intuitive and dynamic way to analyze momentum. Unlike the traditional RSI line, this approach allows traders to observe RSI trends just as they would analyze price charts, making it easier to detect changes in momentum and trend strength.
Each RSI candle represents a specific period’s momentum activity. Green candles indicate that the RSI closed higher than it opened, signaling bullish momentum, while red candles suggest that the RSI closed lower than it opened, indicating bearish sentiment. This candlestick-style visualization helps traders spot RSI trends, breakouts, and reversals more effectively than a simple line chart.
To further refine momentum analysis, this indicator also includes an Exponential Moving Average (EMA) of RSI. The EMA smooths RSI fluctuations and provides a clearer trend direction. When RSI candles remain above the EMA, it suggests strong buying momentum, whereas RSI candles falling below the EMA indicate increasing selling pressure. This combination of RSI candlesticks and an EMA line allows traders to better identify shifts in market sentiment and potential trend reversals.
Additionally, the indicator includes customizable overbought and oversold levels (defaulted at 70 and 30, respectively). These levels help traders recognize when an asset might be overextended in either direction, potentially signaling an upcoming reversal. When RSI candles approach or cross these thresholds, traders can anticipate possible changes in market direction.
This indicator is particularly useful for a wide range of traders. Scalpers and day traders can leverage it to quickly identify short-term momentum shifts, while swing traders can use it to detect potential reversals in multi-day trends. Trend-following traders can confirm bullish or bearish trends based on RSI’s position relative to its EMA, and mean reversion traders can use it to spot extreme conditions where price action might snap back.
By combining RSI candlesticks with an EMA filter, this indicator provides a more dynamic and visually intuitive approach to momentum trading. It offers clearer trend signals, better reversal detection, and enhanced decision-making, making it an essential tool for traders who rely on RSI-based strategies.

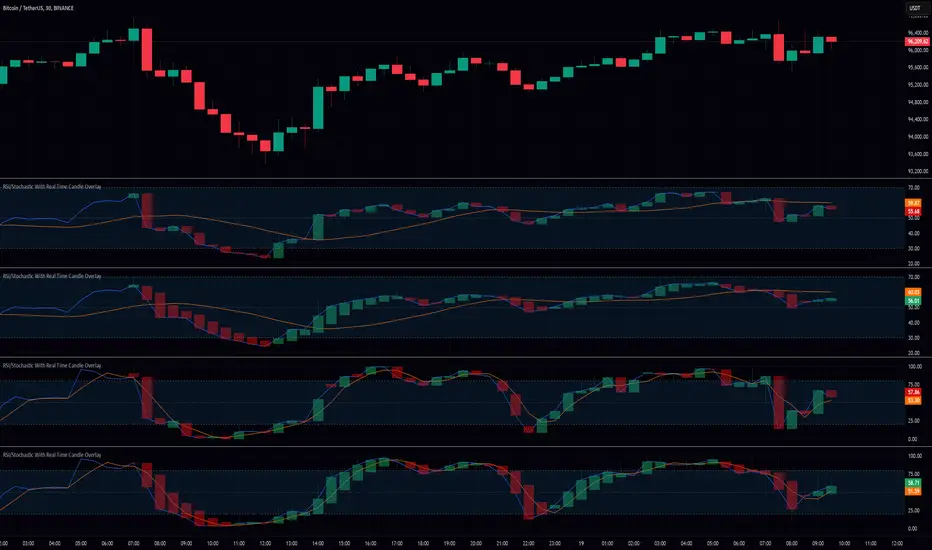
RSI/Stochastic With Real Time Candle OverlayThis indicator provides an alternative way to visualize either RSI or Stochastic values by representing them as candle bars in real time, allowing a more detailed view of momentum shifts within each bar. By default, it displays the standard historical plot of the chosen oscillator in the background, but once you are receiving real-time data (or if you keep your chart open through the close), it begins overlaying candles that track the oscillator’s intrabar movements. These candles only exist for as long as the chart remains open; if you refresh or load the chart anew, there is no stored candle history, although the standard RSI or Stochastic line is still fully retained. These candles offer insight into short-term fluctuations that are otherwise hidden when viewing a single line for RSI or Stochastic.
In the settings, there is an option to switch between standard candlesticks and Heiken Ashi. When Heiken Ashi is selected, the indicator uses the Heiken Ashi close once it updates in real time, producing a smoothed view of intrabar price movement for the oscillator. This can help identify trends in RSI or Stochastic by making it easier to spot subtle changes in direction, though some may prefer the unmodified values that come from using regular candles. The combination of these candle styles with an oscillator’s output offers flexibility for different analytical preferences.
Traders who use RSI or Stochastic often focus on entry and exit signals derived from crossing certain thresholds, but they are usually limited to a single reading per bar. With this tool, it becomes possible to watch how the oscillator’s value evolves within the bar itself, which can be especially useful for shorter timeframes or for those who prefer a more granular look at momentum shifts. The visual separation between bullish and bearish candle bodies within the indicator can highlight sudden reversals or confirm ongoing trends in the oscillator, aiding in more precise decision-making. Because the candle overlay is cleared as soon as the bar closes, the chart remains uncluttered when scrolling through historical data, ensuring that only the necessary real-time candle information is displayed.
Overall, this indicator is intended for users who wish to track intrabar changes in RSI or Stochastic, with the added choice of standard or Heiken Ashi candle representation. The real-time candle overlay clarifies short-lived fluctuations, while the standard line plots maintain the usual clarity of past data. This approach can be beneficial for those who want deeper insights into how oscillator values develop in real time, without permanently altering the simplicity of the chart’s historical view.
BullDozz MA-CandlesticksBullDozz MA-Candlesticks 🏗️📊
The BullDozz MA-Candlesticks indicator transforms traditional candlesticks by replacing their Open, High, Low, and Close values with various types of Moving Averages (MAs). This helps traders visualize market trends with smoother price action, reducing noise and enhancing decision-making.
🔹 Features:
✅ Choose from multiple MA types: SMA, EMA, WMA, DEMA, TEMA, LSMA
✅ Customizable MA period for flexibility
✅ Candlestick colors based on trend: Green for bullish, Red for bearish
✅ Works on any market and timeframe
This indicator is perfect for traders who want a clearer perspective on price movement using moving average-based candlesticks. 🚀 Try it now and refine your market analysis! 📈🔥

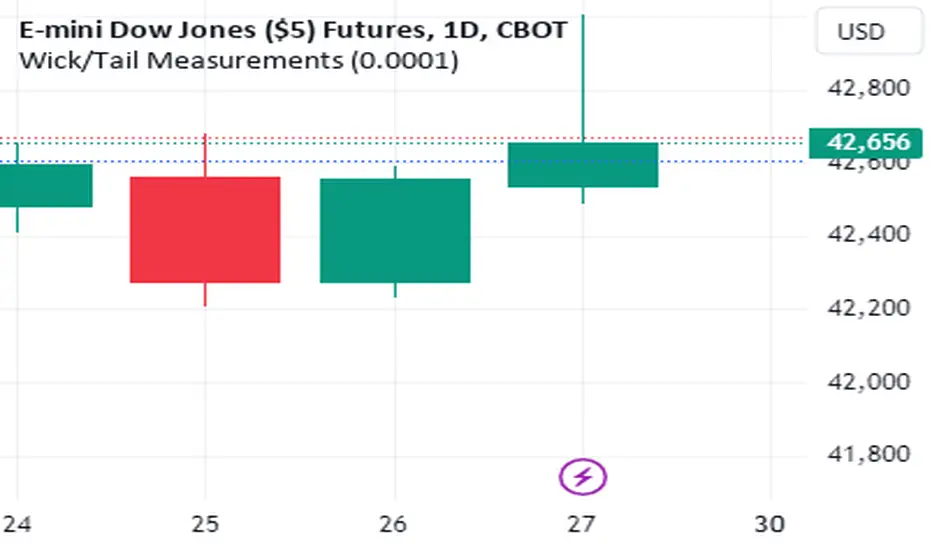
Wick/Tail Candle MeasurementsThis indicator runs on trading view. It was programmed with pine script v5.
Once the indicator is running you can scroll your chart to any year or date on the chart, then for the input select the date your interested in knowing the length of the tails and wicks from a bar and their lengths are measured in points.
To move the measurement, you can select the vertical bar built into the indicator AFTER clicking the green label and moving it around using the vertical bar *only*. You must click the vertical bar in the middle of the label to move the indicator calculation to another bar. You can also just select the date using the input as mentioned. This indicator calculates just one bar at a time.
measurements are from bar OPEN to bar HIGH for measured WICKS regardless of the bar being long or short and from bar OPEN to bar LOW for measured TAILS also regardless of the bar being long or short.
This indicator calculates tails and wicks including the bar body in the calculations. Basically showing you how much the market moved in a certain direction for the entire duration of that Doji candle.
Its designed to measure completed bars on the daily futures charts. (Dow Jones, ES&P500, Nasdaq, Russell 2000, etc) Although it may work well on other markets. The indicator could easily be tweaked in order to work well with other markets. It is not designed for forex markets currently.
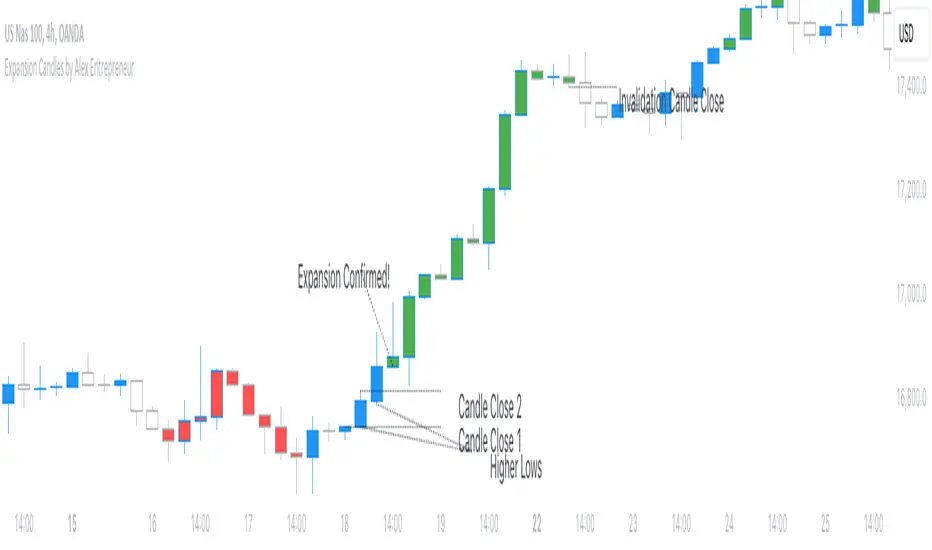
Expansion Candles by Alex EntrepreneurHey people! Thanks for using Expansion Candles. I designed this tool to help me identify price runs (expansions) based on consecutive bullish or bearish candle closes and then trade continuations on the lower timeframes. Here's what makes it awesome:
How Does It Work?
An “expansion” is confirmed after multiple closes above the previous candle’s high (in the bull case) or below the previous candle’s low (in the bear case) while also having a higher candle low than the previous candle (in the bull case) or having lower candle high that the previous candle (in the bear case). After an expansion is confirmed, then the indicator will be displayed on the next candle.
You can set the number of required candle closes that confirm an “expansion” by increasing or decreasing the "Required Candles For Valid Expansion" setting.
An expansion will continue until an “invalidation” event occurs this will cause the indicator to stop displaying.
This “invalidation” can either be a lower candle low than the previous candle (in the bull case) and a higher candle high than the previous candle (in the bear case), or a close below the previous candle’s low (in the bull case) or a close above the previous candle’s high (in the bear case).
You can choose whether you want to use candle highs and lows as invalidation or candle closes as invalidation by changing the “Invalidation Type” setting to either “Wick” or “Candle Close”.
Key Features
Price Run Detection : Identify when price is expanding through consecutive bullish or bearish candle closes. You can chose whether a wick or opposite candle close finishes the run.
Timeframe Selection : Select your preferred timeframe for expansion candles and then view the indicator on lower timeframes for precise continuation entries.
Custom Display Options : Tailor the way expansions are shown on your chart. Choose your bullish and bearish colours and then display expansions as coloured candles, background colours, boxes, or arrows.
Sensitivity Adjustment : Adjust the indicator's sensitivity by changing the number of "Required Candles For Valid Expansion" to suit your analysis.
Set Alerts : Detect new bullish or bearish expansions in your favourite instruments with customisable alerts.
Best,
Alex Entrepreneur
PA Helper - Draw Next 5 CandlesA user-friendly tool designed for a quick visual preview of the next 5 candles on your trading chart.
Here's how to use it effortlessly:
Set Open Prices:
Adjust the open prices for the upcoming 5 candles using the inputs labeled Next close #1 to Next close #5.
Toggle Candles:
Use the checkboxes (p1 to p5) to enable or disable the drawing of each corresponding next candle.
Offset Option:
Customize your preview by toggling the offset option:
If offset is set to false, the drawing starts from the current candle's close, providing insight into the next 5 candles relative to the current one.
If offset is set to true, the drawing begins with the next candle, offering a preview of the upcoming 5 candles, effectively skipping the current one.
Visual Representation:
The indicator visually displays the next 5 candles on your chart based on your selected open prices, offering a clear and tailored insight into potential market movements.

Advanced Engulfing CandlesThere are a plenty of Engulfing candle detecting indicators but every single of them detect engulfing candles engulfed by only single candle but sometime it take more then one candle to engulf the previous opposite candle, which is also considered as engulfing candle.
So this script show both type of candles.
Type of Engulfing Candles
Normal Engulfing Candles
Candle engulfed by more then one continuous candle
I hope you will like it.
If you find any bugs or have any suggestions for any possible addition feel free to comment or DM me.

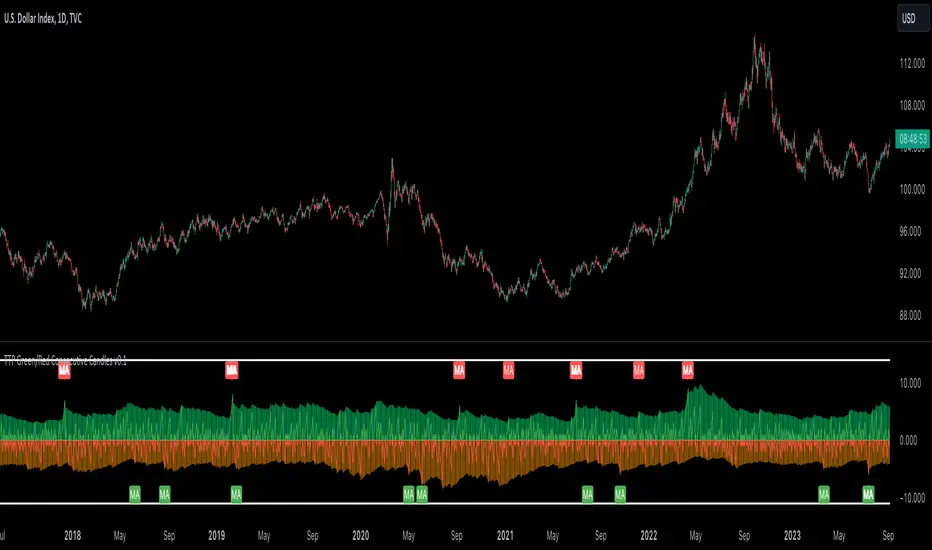
TTP Green/Red Consecutive CandlesThis indicator counts consecutive green/red candles offering some basic statistics and signals/alerts.
Features
- Counts consecutive green/red candles in an oscillator chart
- Moving average of the counting helps spotting when the consecutive candles are away from the mean. MA length and multiplier to adjust the signal sensitivity.
- Thresholds can be set to backtest and send alerts on any number of arbitrary consecutive candles of the same color.
- All time highs: the indicator keeps track of when the maximum has been reached
- Distribution data: the number of times each number of consecutive color candles has been reached is offered
Signals
- Threshold signal triggers when the number of candles of the same color is above the specified threshold.
- MA cross signal triggers when the number of candles of the same color is above the MA.
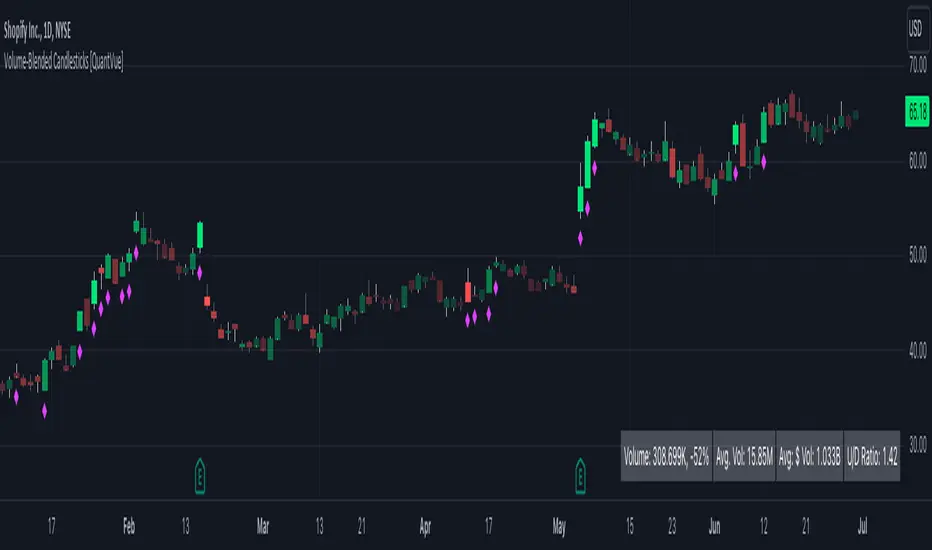
Volume-Blended Candlesticks [QuantVue]Introducing the Volume-Blended Candlestick Indicator, a powerful tool that seamlessly integrates volume information with candlesticks, providing you with a comprehensive view of market dynamics in a single glance.
The Volume-Blended Candlestick Indicator employs a unique approach of projecting volume totals by calculating the total volume traded per second and comparing it to the time left in the session as well as the historical average length selected by the user.
The indicator then dynamically adjusts the opacity of the candlestick colors based on the intensity of the projected volume. As volume intensifies, the candlestick colors become more pronounced, while low volume will cause colors to fade allowing you to visually perceive the level of buying or selling.
One of the standout features of the Volume-Blended Candlestick Indicator is its ability to identify pocket pivots. A pocket pivot is an up day with volume greater than any of the down days volume in the past 10 days. By highlighting these pocket pivots on your chart, the indicator helps you identify potential stealth accumulation.
In addition to blending volume with candlesticks and spotting pocket pivots, this versatile indicator provides you with an insightful table displaying key volume metrics. The table includes the average volume, average dollar volume, and the up-down volume ratio, allowing you to get a clear picture of buying and selling pressure.
Settings Include:
🔹Sensitivty Level: Normal, More, Less
🔹Volume MA Length
🔹Toggle Color based on previous close
🔹Show or hide volume info
🔹Chose candlestick colors
🔹Show or hide pocket pivots
🔹Show or hide volume info table
Don't hesitate to reach out with any questions or concerns.
We hope you enjoy!
Cheers.
Colorize Large Candles// I have written a Pine Script to re-paint large candles in a different Color.
// You can set the value that you want to use to define what is 'Large', and the script will re-paint any candle whose size is equal to or greater than your value.
// The number can be an integer (8) or a decimal (7.5).
// You can enable the size measurement to be done in one of two ways: 1) either on the Body (Open-to-Close); 2) or on the Wicks (High-to-Low) of the candle.
// The color of the re-painted candle can be set independently for Up and for Down candles. You can also set any Opacity that you want for these candles.
// I usually set the limit for the Visibility to the Second- and Minute-timeframes, as the Script produces too many Colorized Bars when using the Hour- or Day- timeframes.

Candle Stick UpdateHeikin ashi chart so powerful that you can understand trend direction easily. But sometimes, this type of chart doesn't update properly and make no sense on real time. So I made this script. You can now change candle stick style default to heikin ashi (default / modified version) on the real time default chart without switching heikin ashi chart. Enjoy traders!!! And don't forget to press the like button :)

Rally HTF Candle (Candlestick Analysis) Guaranteed WinnersRally Candle will signal when price is at the end of a Rally to the upside and thus entering a balance phase in the market (works on all markets)
This candle works very efficient when the market is either trending downwards or in range markets where price is at resistance. (i would avoid in uptrends but depends on the trader)
Also we can expect this candle to form when price is overextended as the theory of this script is when there is a turning point in momentum - this candle will appear and we can look long from this signal.
This candle will only work in Swing High areas and appear when below an moving average which can be changed in the settings.
This candle will work only work pn the HTF as it provides very good rexpectancy whereas the LTF has a slightly less expectancy (i will be publishing an intraday Rally candle)
This candle can be alerted to signal the Rally Candle when the bar is confirmed and not during.
The way i trade this candle is
1) Candle signal must be in probably area to increase efficiency.
2) Enter on the second candle after candle IS CONFIRMED
3) Set stop loss below Rally Candle or use ATR value
4) Trade with the trend ie only Bearish price action
5) This candle can catch extreme points in the market ie this candle projected when ETH hit aths $4841
6) Trading with a confluence along with the Rally is better than solely trading this candle
Please leave a comment.
If we get to 100 likes i will publish the script.

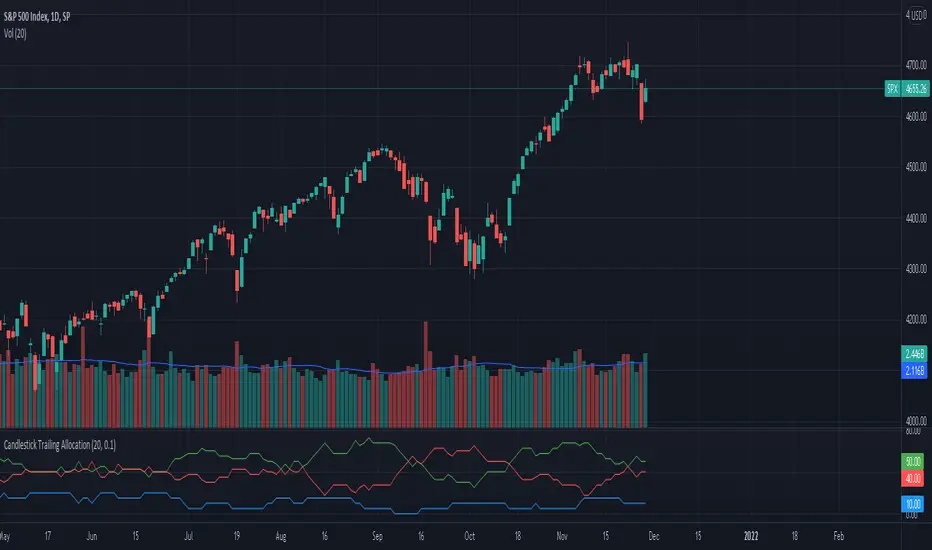
Candlestick Trailing AllocationA simple indicator that calculates the sum of 'Up'(green), 'Down'(red), and 'Doji'(near Doji) candlesticks and portrays the same in an allocation format in percentage. And since it is allocation-based, the total will never exceed 100% of the defined Length period.
The equation is Green + Red + Doji = Total Candles; where total candles = length
When calculating the allocation part, the doji candles are subtracted from the sum of green and red, and the new value is divided by the length period.
For example, the green line = (sum of all green candles - doji / 2) / length; the reason to divide doji by 2 is to eliminate the redundancy it can cause.
When the green line crosses above the red line, the number of green candles is more than red in the defined length period. Similarly, when the red line crossed above the green, there were more red candles than green in that period.
The Doji line shows if any doji or near doji candles have appeared. It acts as a form of resistance against the green and red candles.
There's also the option to change the value of the doji's weight. Default is at 0.1.
The indicator does not show trend nor momentum, even though it may replicate some of its behavior from time to time. It is purely showing the allocation of the number of candles classified as green, red, and doji within the length provided.