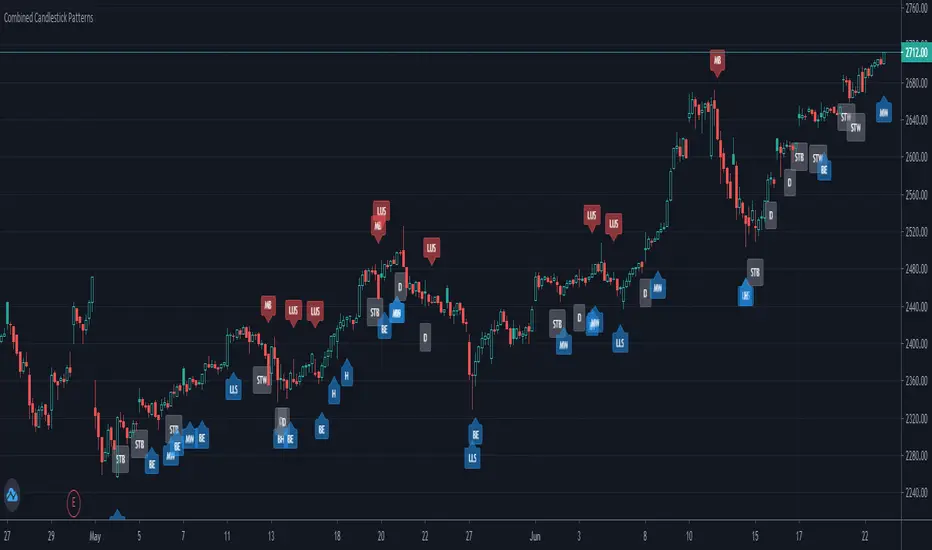
Combined Candlestick PatternsI combined all the build-in candlestick patterns scripts into one single script so anyone who does not have a Pro plan can display all the patterns in the same chart.
Leave a comment for any feedback!
Cari dalam skrip untuk "candle"
HV and IMP candle finderHV and IMP candle finder
Highest volume candle (HV) and Important candle (IMP) are usually a traces of institutional activity. We can take help of these candles to form a bias for the next trading day.
This script does the following:
1. Finds the IMP candle for a given day range with the trend of a given day, ie it finds highest volume candle between the high and low of the day and marks as IMP on the chart
2. It finds the highest volume candle for a given day and marks it.
Use case:
Spot institutional activity, accumulation, and key intraday pivot candles.
View can be made by seeing this HH and LL in these volume candles. Also by considering the closing and opening for the price the next trading session.
Notes
Best to be used on 5 min TF for after market analysis. It does get the candles in live market but it might change with time.
Works really best when delivery volume is also analysed along with it.
Made with Love.
Regards,
Jitendra Varma

Linear Regression Blend Candles [Adaptive]Regression Blend Candles
A hybrid candle system that blends standard OHLC candles with linear regression candles at a user-defined ratio. The result is a cleaner price representation that filters noise while preserving market structure. Adaptive modes automatically adjust the blend based on market conditions.
━━━━━━━━━━━━━━━━━━━━━━━━━━━━━━━━━━━━━━━━━
𝗛𝗢𝗪 𝗜𝗧 𝗪𝗢𝗥𝗞𝗦
The indicator calculates linear regression values for each OHLC component over a lookback period, then blends them with regular candle values based on your blend percentage. At 0% you see pure price action; at 100% you see full regression candles; anything between gives you a mix.
━━━━━━━━━━━━━━━━━━━━━━━━━━━━━━━━━━━━━━━━━
𝗙𝗘𝗔𝗧𝗨𝗥𝗘𝗦
◽ Blend Control
Set a fixed blend percentage or enable adaptive mode. The blend slider lets you dial in exactly how much smoothing you want—useful for finding the sweet spot between noise reduction and signal responsiveness.
◽ Adaptive Blend Modes
Let the market decide the blend ratio:
• ATR — Higher volatility increases LR blend to filter chop
• StdDev — Similar concept using standard deviation
• ATR + StdDev — Combines both volatility measures
• R-Squared — Increases blend when price fits a linear trend well (high R² = clean trend = trust the regression more)
• R² + ATR — Combines trend quality with volatility for a balanced approach
◽ R-Squared Thresholds
Fine-tune when the R² adaptive mode kicks in. Below the low threshold, blend stays at minimum. Above the high threshold, blend reaches maximum. This prevents over-smoothing during choppy, non-linear price action.
◽ Post-LR Smoothing
Apply additional smoothing to the regression values before blending:
• ALMA — Arnaud Legoux Moving Average with offset/sigma control
• Kalman — Adaptive filter that balances responsiveness and smoothness
• KAMA — Kaufman Adaptive MA that adjusts to market efficiency
◽ Advanced LR Mode
Enable weighted regression with exponential decay (emphasizes recent bars) and lag correction (extrapolates based on velocity to reduce inherent LR lag).
◽ Ghost Candles
Display faded regular candles behind the blended candles to visualize the difference and spot divergences between raw price and the smoothed representation.
━━━━━━━━━━━━━━━━━━━━━━━━━━━━━━━━━━━━━━━━━
𝗦𝗨𝗚𝗚𝗘𝗦𝗧𝗘𝗗 𝗦𝗘𝗧𝗨𝗣𝗦
𝟭. 𝗧𝗿𝗲𝗻𝗱 𝗖𝗹𝗮𝗿𝗶𝘁𝘆 (𝗦𝘄𝗶𝗻𝗴 𝗧𝗿𝗮𝗱𝗶𝗻𝗴)
• LR Lookback: 14
• Blend %: 60-70%
• Smoothing: None
• Ghost Candles: On
Use for cleaner swing identification. The higher blend percentage filters out intrabar noise while ghost candles let you see when price deviates significantly from the smoothed trend—potential reversal or continuation signals.
𝟮. 𝗔𝗱𝗮𝗽𝘁𝗶𝘃𝗲 𝗡𝗼𝗶𝘀𝗲 𝗙𝗶𝗹𝘁𝗲𝗿 (𝗜𝗻𝘁𝗿𝗮𝗱𝗮𝘆)
• LR Lookback: 10
• Adaptive Blend: On
• Mode: R² + ATR
• Min/Max Blend: 25% / 75%
• R² Thresholds: 0.3 / 0.8
Ideal for intraday trading on volatile instruments. The blend automatically increases during clean trends (high R²) and volatile moves (high ATR), then backs off during choppy consolidation to keep you closer to raw price action when the regression isn't fitting well.
𝟯. 𝗨𝗹𝘁𝗿𝗮-𝗦𝗺𝗼𝗼𝘁𝗵 (𝗛𝗶𝗴𝗵𝗲𝗿 𝗧𝗶𝗺𝗲𝗳𝗿𝗮𝗺𝗲 𝗕𝗶𝗮𝘀)
• LR Lookback: 20
• Blend %: 80%
• Smoothing: ALMA (offset 0.85, sigma 6)
• Advanced LR: On (decay 0.9, lag correction 1.5)
Maximum smoothing for identifying higher timeframe directional bias. The combination of longer lookback, high blend, ALMA smoothing, and lag correction creates a highly filtered view that cuts through noise. Best used on 4H+ charts or as a trend filter for lower timeframe entries.

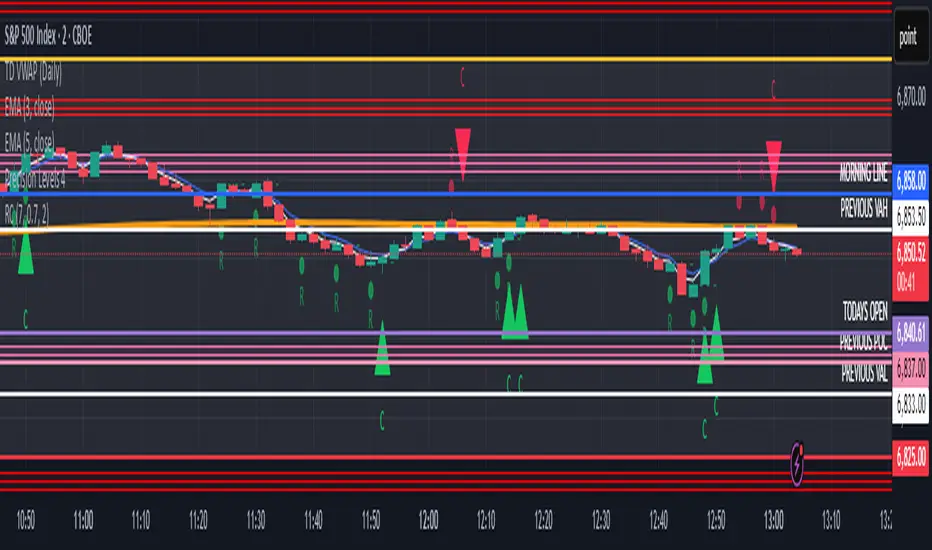
Opposite Candle Zone Identifier (v6) - Extended🔍 Opposite Candle Zone Identifier (Extended)
Opposite Candle Zone Identifier is a price-action based indicator designed to identify potential reversal or absorption zones by detecting candles that move against the surrounding trend.
The indicator highlights a central opposite candle (or group of candles) that is surrounded by candles moving in the opposite direction, both before and after the central candle.
This structure often represents areas where institutional activity, absorption, or supply/demand imbalance may occur.
📌 How the Indicator Works
The indicator analyzes price action using three configurable blocks:
1️⃣ Candles Before (Backward)
A user-defined number of candles before the central candle(s) must follow a consistent trend:
Bullish candles for a bearish zone
Bearish candles for a bullish zone
2️⃣ Central Candle(s)
The core of the pattern:
Default: 1 opposite candle
Can be increased (up to 5) to adapt the indicator to lower timeframes or noisier markets
This central block must move against the previous trend, signaling a potential shift or absorption area.
3️⃣ Candles After (Forward)
A user-defined number of candles after the central candle(s) must resume the original trend, confirming the pattern.
⚠️ The signal is confirmed only after the “after” candles are completed.
This avoids repainting and ensures structural confirmation.
📐 Zone Concept
The highlighted central candle (or candles) can be used to define a price zone:
The high and low of the central candle(s) represent a potential supply or demand zone
These zones can be used for:
Reversal areas
Reaction zones
Entry refinement
Stop placement
⚙️ Inputs & Customization
Number of candles before
Controls how many candles must follow the initial trend.
Number of candles after
Defines how many candles are required for confirmation.
Central candles count
Default is 1, but can be increased (e.g. 2) for:
Lower timeframes
More reliable structure
Reduced noise
ATR-based offset
Labels are positioned using a dynamic ATR offset to improve chart readability across different markets and timeframes.
📈 Bullish & Bearish Zones
🟢 Bullish Zone
Bearish candles before
Bullish central candle(s)
Bearish candles after
Indicates potential demand or accumulation zone
🔴 Bearish Zone
Bullish candles before
Bearish central candle(s)
Bullish candles after
Indicates potential supply or distribution zone
🧠 Best Use Cases
Works best on 15m and higher timeframes
Effective on:
Indices
Forex majors
Liquid cryptocurrencies
Can be combined with:
Trend filters (EMA, VWAP)
Support & resistance
Market structure analysis
⚠️ Notes
This indicator is confirmation-based, not predictive
Signals appear only after pattern completion
It does not repaint
Best used as a confluence tool, not as a standalone trading system
🎯 Summary
Opposite Candle Zone Identifier helps traders:
Detect opposite-direction candles within strong trends
Identify potential supply and demand zones
Adapt the pattern to different timeframes
Improve price-action based decision making

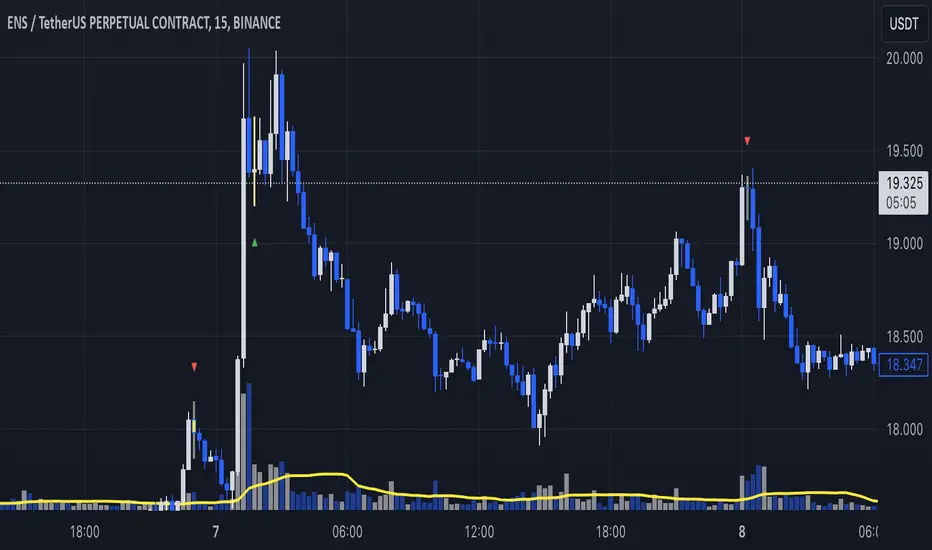
Multi-Candle Reversal ConfirmationMulti-Candle Reversal Confirmation (MCRC)
This indicator identifies potential price reversals using a 3-candle confirmation pattern. It filters out noise by requiring a significant prior trend before signaling, helping you catch turning points rather than getting trapped in choppy price action.
How It Works
The indicator uses a three-step process to confirm reversals:
Candle 1 (Rejection) - Detects a rejection candle after a sustained move. This includes hammer/shooting star patterns with long wicks, doji candles showing indecision, or stall candles with unusually small bodies.
Candle 2 (Reversal) - Confirms the candle closes in the opposite direction of the prior trend.
Candle 3 (Confirmation) - Validates the reversal by either continuing in the new direction or breaking the high/low of the previous candle.
Key Features
Requires a significant prior trend before looking for reversals (no signals in choppy, sideways markets)
Uses ATR to measure move significance, adapting to current volatility
Marks rejection candles with small circles for early awareness
Confirmed signals shown as triangles with Bull/Bear labels
Built-in alerts for all signal types
Settings
Wick to Body Ratio - How pronounced the rejection wick must be compared to the candle body (default: 2.0)
Doji Threshold - Maximum body size relative to total range to qualify as a doji (default: 0.1)
Trend Lookback - Number of candles to analyze for prior trend detection (default: 5)
Trend Strength - Percentage of lookback candles required in trend direction (default: 0.6 = 60%)
Minimum Move (ATR multiple) - How large the prior move must be before signaling (default: 1.5)
Show Bullish/Bearish - Toggle each signal type on or off
Visual Signals
Small Circle - Marks potential rejection candles (first candle in the pattern)
Green Triangle (Bull) - Confirmed bullish reversal signal
Red Triangle (Bear) - Confirmed bearish reversal signal
Alerts
Three alert options are available:
Bullish Reversal Confirmed
Bearish Reversal Confirmed
Any Reversal Confirmed
How To Set Up Alerts
Add the indicator to your chart
Right-click on the chart and select "Add Alert" (or press Alt+A)
In the Condition dropdown, select "Multi-Candle Reversal Confirmation"
Choose your preferred alert type
Set notification preferences (popup, email, sound, webhook)
Click "Create"
Tips For Best Results
Combine with key support/resistance levels for higher probability trades
Use higher timeframe trend direction as a filter
Adjust Trend Lookback based on your timeframe (higher for longer timeframes)
Increase Minimum Move ATR in volatile conditions to reduce false signals
Signals appearing near VWAP, moving averages, or prior day levels tend to be more reliable
Note: This indicator is for informational purposes only and should not be used as the sole basis for trading decisions. Always use proper risk management and consider combining with other forms of analysis.
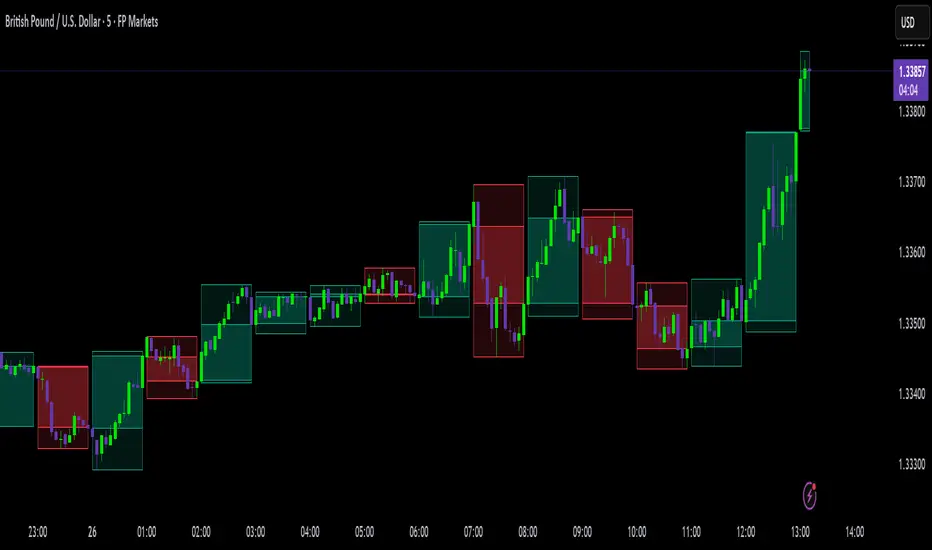
High Timeframe Candle Overlay (Configurable)HTF Candle Overlay — Read Higher Timeframe on Lower Timeframe Charts
What it does
This indicator draws each selected Higher-Timeframe (HTF) candle directly on your lower-timeframe (LTF) chart. It shows a translucent range box (HTF high–low) and an inner body box (HTF open–close), so you can track how the bigger candle is forming while you analyze lower-timeframe structure, liquidity sweeps, and intrabar reactions.
Why it’s helpful
• See where the current HTF candle opened, where price sits inside its body, and how far wicks extend—without leaving your LTF chart.
• Combine HTF context (e.g., 1H/4H) with LTF execution (e.g., 1m–15m) to spot confluence, S/R flips, and failed breaks faster.
• The overlay is locked to the price scale and anchored by bar index, so it pans/zooms exactly with your chart (no drifting while dragging).
⸻
How it works (under the hood)
• Fetches HTF OHLC via request.security.
• When a new HTF bar starts, the previous HTF boxes are frozen at the true close.
• The current HTF bar updates intrabar (so you see live formation) and is clamped to the correct span.
• Horizontal anchoring uses bar index, and a hidden price plot binds the script to the main price scale for stable zoom/pan behavior.
⸻
Inputs
• High Timeframe (HTF): Default 1H (set any TF you like).
• Show High–Low Box: On/off.
• Show Body Box (Open–Close): On/off.
• Opacity for range/body boxes.
• Bull/Bear Colors and Outline + Width.
• Max HTF Candles to Keep: Auto-deletes older boxes to maintain performance.
⸻
Usage tips
• Popular combos: view 1H or 4H candles while trading 1–15m charts.
• Turn off the range box if you only want a clean HTF body overlay.
• Pair with your session/structure tools; this indicator is visual context only (no signals or alerts).
⸻
Notes & limitations
• Non-repainting for closed HTF bars: once an HTF candle closes, its boxes are fixed. The current/in-progress HTF bar updates until it closes (expected live behavior).
• Data alignment depends on your symbol’s feed and session settings. Heikin Ashi/renko/etc. may not match classic OHLC.
• Heavy history + many boxes can affect performance; reduce “Max HTF Candles to Keep” if needed.
⸻
Disclaimer
This script is for education and charting visualization only. It does not provide financial advice, trade signals, or performance guarantees. Always do your own research and manage risk.
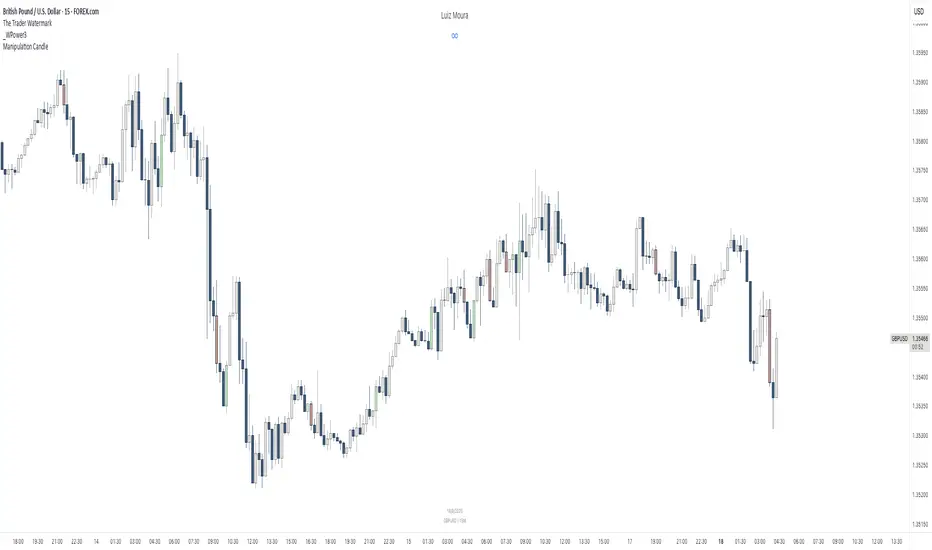
[RealEdgeFX] - Manipulation CandleOverview
The Manipulation Candle indicator highlights potential liquidity grabs and false breakouts directly on the chart. It focuses on moments when price sweeps prior highs or lows but closes in the opposite direction, suggesting a possible manipulation before a market reversal.
Core Logic
The indicator compares the current candle against the previous one and colors the bar when specific conditions are met:
Sell Manipulation (dark red)
When the current candle breaks above the previous high but then closes below the prior low.
→ This often signals a stop hunt to the upside followed by bearish intent.
Buy Manipulation (light green)
When the current candle breaks below the previous low but then closes above the prior high.
→ This suggests a liquidity sweep to the downside before bullish continuation.
Neutral candles remain uncolored to avoid clutter and keep the focus on high-impact moments.
Design Approach
Clarity: Only the candles that meet strict criteria are marked, reducing noise.
Liquidity Focused : Built for traders who want to quickly spot manipulative price action.
Non-Repainting : Once a candle is identified as manipulation, the color stays fixed.
Usage
Add it as an overlay on your chart.
Watch for green or red manipulation candles as alerts of possible reversals or liquidity events.
Combine with your own market structure or bias tools to increase accuracy.
Dominance Candle Raja Saien (Detector with Alerts)Dominance Candle Finder with Alerts by Raja Saien
This powerful indicator is designed to detect dominance candles—those strong-bodied candles that often signify momentum and trend strength. Whether you're trading breakouts, trend continuations, or reversals, this tool helps you identify key market moves in real time with optional alerts.
🔍 Features:
Automatic Detection of Dominance Candles: Highlights candles with strong body size, showing decisive market movement.
Customizable Thresholds: Adjust sensitivity according to your strategy or asset volatility.
Built-in Alerts: Get notified the moment a dominance candle forms—no need to stare at charts all day!
Multi-Timeframe Compatibility: Works on any timeframe from 1-minute to daily or higher.
📊 Use Cases:
Entry confirmation on breakouts
Trend strength analysis
Volatility surge detection
Combine with support/resistance or order block zones for powerful setups
Tip: Best used with strong support/resistance levels or price action strategies for confluence

Rapid Candle PATTERNSIndicator Title: Rapid Candle Patterns - High-Probability Signals
Description
Tired of noisy charts filled with weak and ambiguous candlestick patterns? The Rapid Candle Patterns indicator is engineered to solve this problem by moving beyond simple textbook definitions. It identifies only high-probability reversal and continuation signals by focusing on the underlying market dynamics: momentum, liquidity, and confirmation.
This is not just another pattern indicator; it's a professional-grade tool designed to help you spot truly significant price action events.
How The Logic Works & Why It's More Accurate
Each pattern in this script has been enhanced with stricter, more intelligent rules to filter out noise and reduce false signals. Here’s what makes our logic superior:
1. The Liquidity Grab Hammer & Inverted Hammer
Standard Logic: A simple hammer shows a long lower wick, suggesting buyers pushed the price back up.
Our Enhanced Logic: We don't just look for a hammer shape. Our signal is only valid if the hammer’s low takes out the low of the previous candle (a "liquidity grab" or "stop hunt").
Why It's More Accurate: This sequence is incredibly powerful. It shows that sellers attempted to push the market lower, triggered stop-loss orders below the prior low, and then were decisively overpowered by buyers who reversed the price. This isn't just a reversal; it's a failed breakdown, often trapping sellers and fueling a stronger move in the opposite direction.
2. The "True" Bullish & Bearish Harami
Standard Logic: A small candle forms within the high-low range of the previous candle. This can often be misleading if the prior candle has long wicks and a tiny body.
Our Enhanced Logic: We enforce a "dual containment" rule. For a Harami to be valid, its body must be contained within the body of the previous candle. We also ensure the Harami candle itself is not a Doji, meaning it must show some conviction.
Why It's More Accurate: This ensures you are seeing a genuine and significant contraction in momentum. It filters out scenarios where a large-bodied candle forms inside the wicks of a doji-like candle, which is not a true Harami. Our logic captures the "pregnant" pattern as it was intended—a moment of quiet consolidation before a potential new move.
3. The "Power" Bullish & Bearish Engulfing
Standard Logic: A candle's body engulfs the body of the previous candle. This is a common signal, but it often lacks follow-through.
Our Enhanced Logic: Our "Power Engulfing" requires two conditions: (1) The body must engulf the prior candle's body, AND (2) the candle must close beyond the entire high/low range of the prior candle.
Why It's More Accurate: This is the ultimate sign of confirmation. It doesn't just show that one side has won the battle for the session; it proves they had enough force to break the entire structure of the previous candle. This signifies immense momentum and dramatically increases the probability that the trend will continue in the direction of the engulfing candle.
4. The Quantified Doji
Our Logic: Instead of being a subjective pattern, a Doji is defined quantitatively. It's a candle whose body is less than or equal to a user-defined percentage (default 9%) of its total range.
Why It's More Accurate: It provides a consistent and objective measure of market indecision. Furthermore, any candle identified as a Doji is automatically disqualified from being a Hammer, ensuring clear and distinct signals.
User Customization
Toggle Patterns On/Off: Declutter your chart by only showing the patterns you want to see.
Fine-Tune Logic: Use the "Pattern Logic" settings to adjust the sensitivity of the Doji and Harami detectors to perfectly match your trading style, asset, and timeframe.
Disclaimer: This indicator is a powerful tool for identifying high-probability price action. However, no single indicator is a complete trading system. Always use these signals as part of a comprehensive strategy, combined with analysis of market structure, support/resistance levels, and other forms of confluence.

Mark specific candle (e.g. bar 20)This Pine Script indicator, "Mark specific candle (e.g. bar 20)" (short title "Mark candle"), is a simple yet powerful tool to visually highlight a particular candle on your chart.
What it does:
It marks a specific candle (e.g., the 20th, 10th, or any number you choose) counting backwards from the most recent candle on your chart. The marked candle will be colored in a subtle light grey and also feature a tiny, matching grey arrow pointing down from above it.
Why it's useful:
This indicator helps you quickly identify and track a consistent reference point in recent price action. It's great for strategies that depend on fixed look-back periods or for simply keeping an eye on a specific historical candle's position as new data comes in.
Key Features:
Adjustable Candle Number: Easily change which candle is marked (e.g., 20th, 10th, 5th) directly from the indicator settings using the "Candle Number to Mark (from end)" input.
Clear Visuals: Both the candle color and a small arrow provide a subtle, yet effective, visual cue.
How to use:
Simply add this script to your TradingView chart. Then, open the indicator's settings to set your desired candle number.

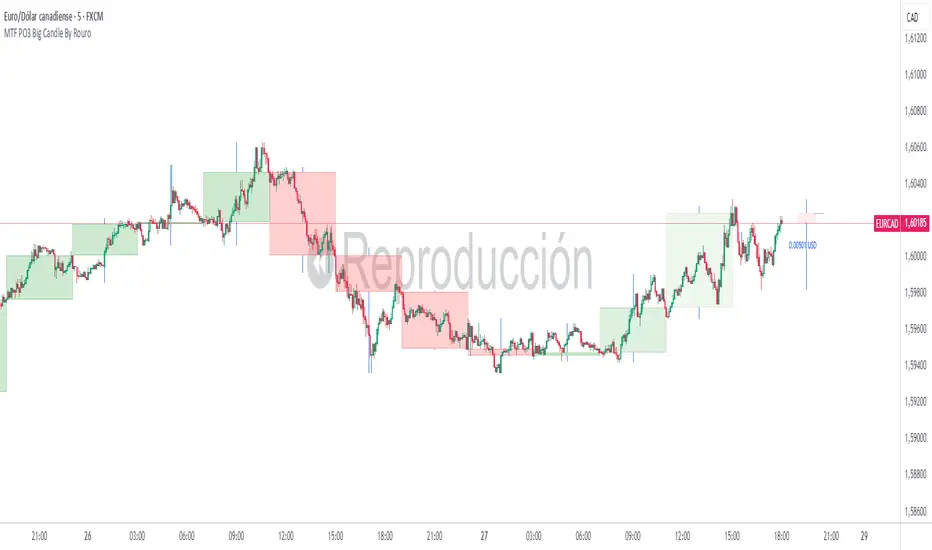
MTF PO3 Big Candle By Rouro📊 MTF PO3 Big Candle By Rouro
This indicator allows you to visualize candles from higher timeframes (HTF) directly on lower timeframe charts.
It draws:
📉 Past candles from the selected HTF.
📈 A projected current candle of a chosen timeframe, extended to the right of the chart.
It's ideal for traders who want to align decisions on lower timeframes with key HTF structures.
⚙️ Inputs & Configuration
🕐 Past Candle Timeframe
Selects the timeframe to visualize historical candles.
(e.g., 4H on a 5-minute chart)
📅 Projected Candle Timeframe
Chooses the timeframe for the current (live) candle that is drawn to the right of the chart.
(e.g., 1D)
➡️ Right Displacement (bars)
Controls how far to the right the projected candle is drawn.
🟩 Bullish Body Color
Defines the color of bullish candle bodies.
🟥 Bearish Body Color
Defines the color of bearish candle bodies.
🔵 Wick Color
Color of the high/low wicks.
🔲 Body Transparency (0–100)
Controls the transparency of the candle body fill.
📌 Show Wicks
Enables or disables drawing of the wicks on all candles.
💡 Notes
If the projected candle is from a very large timeframe (e.g., 1D) and you are on a small timeframe (e.g., 5m), the projection length is limited to avoid overlapping the chart.
All candle shapes update in real time.
The indicator is optimized for performance and includes fail-safes for TradingView's limits.
💬 Support
If you have any questions, feel free to ask in the comments.
If this indicator has been useful or valuable for your trading, please leave a comment saying so — your feedback helps the community and supports the publication process.
✅ Compliant with TradingView’s house rules: No ads, sales, links, or misleading claims.
📌 This is a visual utility tool designed to support multi-timeframe analysis.
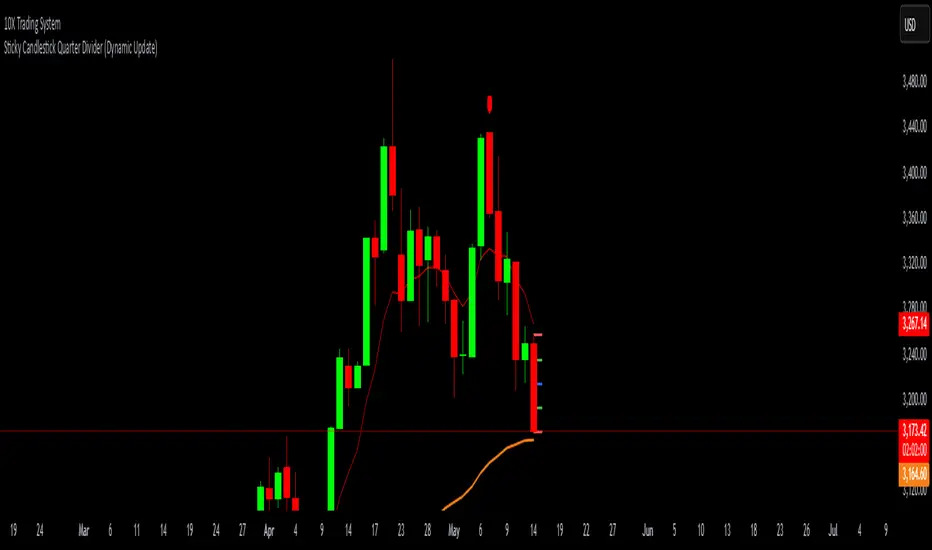
Sticky Candlestick Quarter Divider (Dynamic Update)This indicator divides the most recent candlestick into four equal parts and dynamically plots horizontal lines that move along with the latest candle.
Features:
Dynamic Sticky Lines:
The lines remain visually attached to the current candle, moving seamlessly as the chart updates, zooms, or pans.
Price Level Calculation:
Divides the candlestick into four distinct levels:
High Line (Red): Marks the highest point of the candle.
Low Line (Red): Marks the lowest point of the candle.
Midpoint Line (Blue): Marks the midpoint between high and low.
Upper Quarter Line (Green): Marks the 25% level between low and high.
Lower Quarter Line (Green): Marks the 75% level between low and high.
Real-Time Update:
The lines automatically adjust to the latest candle, maintaining accurate positioning.
Ideal for Candle Analysis:
Quickly identify key price levels and candle structure.
Suitable for analyzing trend strength and potential price reversals.
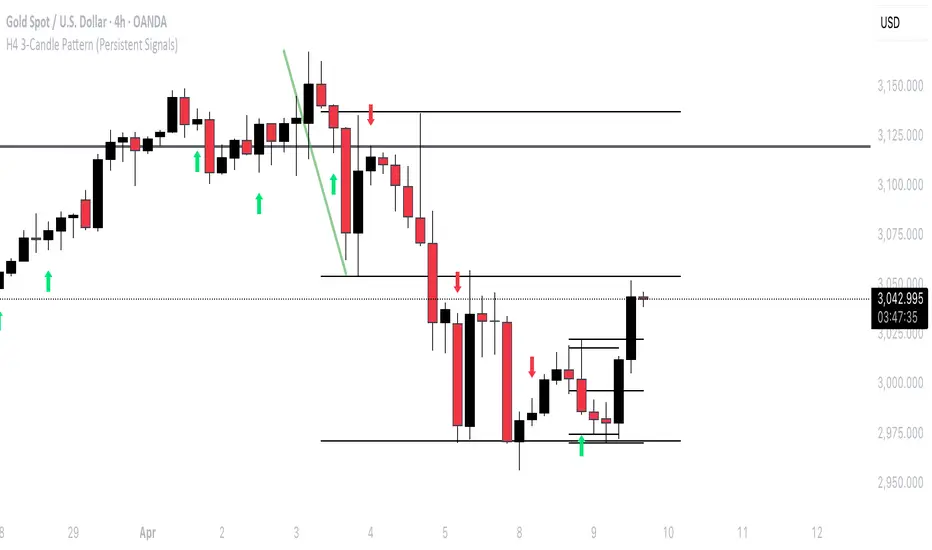
H4 3-Candle Pattern (Persistent Signals)Below is an example in Pine Script v5 that detects a pattern using the last three completed 4H candles and then plots a permanent arrow on the fourth candle (i.e. on the current bar) when the conditions are met. The arrow stays on that bar even after new bars form.
In this version, the pattern is evaluated as follows on each bar (when there are enough candles):
Bullish Pattern:
The candle three bars ago (oldest of the three) is bullish (its close is greater than its open).
The candle two bars ago closes above the high of that older candle.
The last completed candle (one bar ago) closes at or above the low of the candle two bars ago.
Bearish Pattern:
The candle three bars ago is bearish (its close is less than its open).
The candle two bars ago closes below the low of that older candle.
The last completed candle closes at or below the high of the candle two bars ago.
When the conditions are met the script draws a green up arrow below the current (fourth) candle for a bullish pattern and a red down arrow above the current candle for a bearish pattern. These arrows are drawn as regular plot symbols and remain on the chart permanently.
Copy and paste the code into TradingView’s Pine Script Editor:
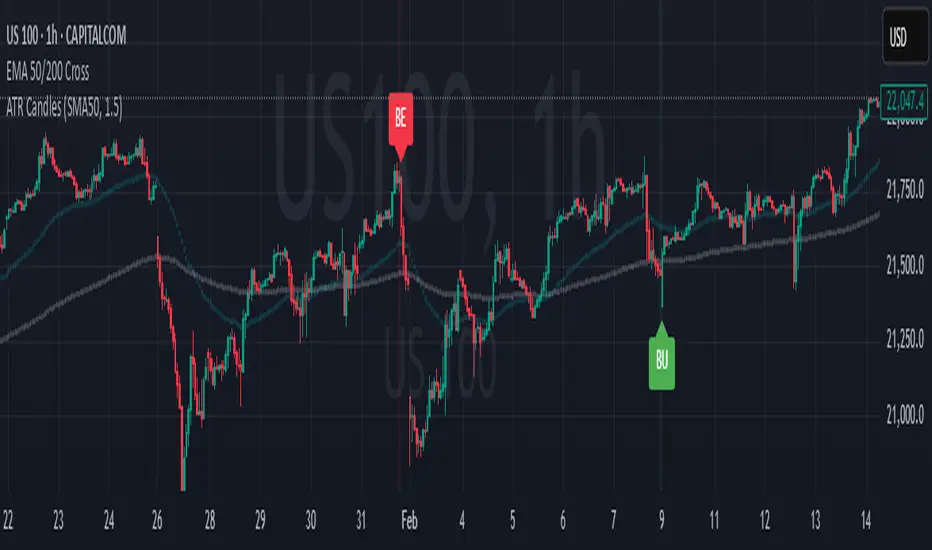
Engulfing Candles (ATR-Based)This indicator detects Engulfing Patterns with an ATR-based filtering mechanism and trend confirmation. Unlike a basic engulfing pattern indicator that only checks if a current candle engulfs the previous one, this script incorporates trend detection using either the 50-period SMA alone or a combination of 50 and 200-period SMAs to ensure that signals align with the broader trend. The indicator identifies Bullish Engulfing patterns when a strong bullish candle engulfs a smaller bearish candle in a downtrend and Bearish Engulfing patterns when a strong bearish candle engulfs a smaller bullish candle in an uptrend. It also generates alerts and visually marks these patterns with labels ("BU" for bullish and "BE" for bearish) while highlighting the background accordingly.
What sets this indicator apart from a normal engulfing indicator is its ATR-based filtering system, which ensures that only significant engulfing candles are considered. Instead of accepting any engulfing pattern, the script measures candle body size relative to 1.5x ATR (configurable) to filter out weak signals. It also differentiates between long-bodied and small-bodied candles to confirm that the engulfing pattern represents real momentum shifts. This approach reduces false signals caused by small, insignificant candles and ensures that traders focus on high-probability reversal patterns. By integrating trend-based filtering and ATR-based confirmation, this indicator provides more reliable and context-aware engulfing signals than a standard engulfing pattern detector.
Weekend Filter Candlestick [odnac]Custom Candlestick Chart with Weekend Visibility Toggle
This indicator customizes the appearance of candlesticks by using a dark gray theme for better visibility.
Additionally, it provides an option to hide weekend candles, allowing traders to focus on weekday price action.
Features:
✅ Dark gray candlestick design for a clean and minimalistic look.
✅ Weekend hiding option – Users can enable or disable weekend candles with a simple toggle.
✅ Helps traders avoid weekend noise and focus on key market movements.
How to Use:
Add the indicator to your chart.
Use the "Hide Weekend Candles" setting to toggle weekend visibility.
When enabled, weekend candles will be hidden for a cleaner chart.
When disabled, all candles, including weekends, will be displayed.
This indicator is useful for traders who prefer to analyze weekday trends without unnecessary weekend fluctuations. 🚀

HTF CandlestickHTF Candlestick
This indicator that visualizes a specific candle from a user-defined timeframe (1D, 1H, etc.) and its associated properties on the chart. Below is a detailed explanation:
1 - Inputs and Initialization:
timeframeInput: Allows the user to select the desired timeframe (e.g., daily).
pos: Adjusts the horizontal position of the drawn candle on the chart.
2 - Custom Data Type (type bar):
The bar type stores data for the open, high, low, and close (OHLC) values, as well as the start time of the candle.
It also includes graphical elements like body, wick, and start lines.
3 - Logic:
A variable b is initialized to represent the custom candle.
The script checks for changes in the selected timeframe and creates a new bar when the timeframe changes.
4 - Methods:
update(): Updates the OHLC values of the bar if a new high or low occurs.
display(): Draws the candle on the chart, including:
The candle body.
The wick (shadow).
Labels showing the open, high, and low values.
Horizontal and vertical dotted lines for visual aid.
5 - Candle Redrawing:
The script clears all graphical elements (lines, labels, boxes) for the current candle on the last bar of the chart (barstate.islast) and redraws them using the display() method.
6 - Table Display:
A small table is displayed at the right-hand side of the chart showing:
The selected timeframe.
The opening value of the candle.
The difference between the close and open prices, highlighted with the appropriate color.
Kod Açıklaması
Bu Pine Script, kullanıcı tarafından seçilen bir zaman dilimine (1D, 1H vb.) ait bir mum çubuğunu ve onun özelliklerini grafik üzerinde görselleştiren özel bir indikatördür. İşte detaylı açıklaması:
1- Girdiler ve Başlangıç:
timeframeInput: Kullanıcının istediği zaman dilimini seçmesine olanak tanır (ör. günlük).
pos: Çizilen mumun grafikte yatay pozisyonunu ayarlamak için kullanılır.
2 - Özel Veri Tipi (type bar):
bar türü, açılış, yüksek, düşük ve kapanış (OHLC) değerlerini ve mumun başlangıç zamanını saklar.
Ayrıca, grafik öğeleri için body, wick ve start gibi alanlar içerir.
3- Mantık:
b değişkeni, seçilen mum çubuğunu temsil etmek için tanımlanmıştır.
Seçilen zaman diliminde bir değişiklik olup olmadığını kontrol eder ve değişiklik olduğunda yeni bir bar oluşturur.
4 - Metotlar:
update(): Daha yüksek bir zirve veya daha düşük bir dip meydana gelirse, mumun OHLC değerlerini günceller.
display(): Grafik üzerinde mum çubuğunu çizer. Bu işlem şunları içerir:
Mum gövdesi.
Fitil (gölge).
Açılış, yüksek ve düşük değerlerini gösteren etiketler.
Görsel yardım için yatay ve dikey kesik çizgiler.
5- Mum Yeniden Çizimi:
Grafik üzerindeki tüm grafiksel elemanları (çizgiler, etiketler, kutular) temizler ve mevcut mumun son çubuğunda (barstate.islast) bunları yeniden çizer.
6 - Tablo Görüntüsü:
Grafik üzerinde sağ tarafta küçük bir tablo gösterilir. Bu tabloda:
Seçilen zaman dilimi.
Mumun açılış değeri.
Kapanış ve açılış fiyatları arasındaki fark, uygun renkte vurgulanarak gösterilir.
Bu kod, kullanıcıya belirli bir zaman dilimindeki mum çubuğunun görsel bir analizini ve temel bilgilerini sağlar.

ICT Candle Block (fadi)ICT Candle Block
When trading using ICT concepts, it is often beneficial to treat consecutive candles of the same color as a single entity. This approach helps traders identify Order Blocks, liquidity voids, and other key trading signals more effectively.
However, in situations where the market becomes choppy or moves slowly, recognizing continuous price movement can be challenging.
The ICT Candle Block indicator addresses these challenges by combining consecutive candles of the same color into a single entity. It redraws the resulting candles, making price visualization much easier and helping traders quickly identify key trading signals.
FVGs and Blocks
In the above snapshot, FVGs/Liquidity Voids, Order Blocks, and Breaker Blocks are easily identified. By analyzing the combined candles, traders can quickly determine the draw on liquidity and potential price targets using ICT concepts.
Unlike traditional higher timeframes that rigidly combine lower timeframe candles based on specific start and stop times, this indicator operates as a "mixed timeframe." It combines all buying and all selling activities into a single candle, regardless of when the transactions started and ended.
Limitations
There are currently TradingView limitations that affect the functionality of this indicator:
TradingView does not have a Candle object; therefore, this indicator relies on using boxes and lines to mimic the candles. This results in wider candles than expected, leading to misalignment with the time axis below (plotcandle is not the answer).
There is a limit on the number of objects that can be drawn on a chart. A maximum of 500 candles has been set.
A rendering issue may cause a sideways box to appear across the chart. This is a display bug in TradingView; scroll to the left until it clears.

Large Candle Marker (Threshold in Cents)This indicator, Large Candle Marker, identifies and marks candles that exceed a specified size threshold. The size can be based on either the candle's body (difference between open and close) or the total range (difference between high and low). The threshold is entered in cents for easy configuration, and the indicator highlights these significant candles directly on the chart with a orange flag. It's perfect for spotting momentum or volatility in price movements. I use it to not enter trades after a large candle.
// INSTRUCTIONS:
// 1. Input the desired candle size threshold in cents in the settings menu.
// - For example, enter "30" for 30 cents or "50" for 50 cents.
// 2. Choose the size type:
// - Select "True" to use the candle body size (difference between open and close).
// - Select "False" to use the total range size (difference between high and low).
// 3. The script will mark candles exceeding the threshold with a red marker above the candle.
// 4. Apply this indicator to any chart to identify significant candles based on the threshold.

Reptile Candle Marker with ArrowsReptile Candle Marker
The Reptile Candle Marker is a custom indicator designed to identify a specific pattern in price action, known as the "reptile candle." This pattern is characterized by a small body with long wicks on both the upper and lower sides. These candles often indicate indecision or a reversal in the market, making them useful for traders looking for potential turning points.
Key Features:
Small Body and Large Wicks: The indicator highlights candles with a small body relative to the overall candle range, accompanied by long upper and lower wicks. This is achieved by comparing the size of the wicks to the body and the overall candle range.
Volume Confirmation: The indicator ensures that the identified candles are accompanied by high volume, which serves as confirmation of the significance of the price action.
Visual Highlighting: When a "reptile" candle is detected, the body of the candle and the wicks are both colored yellow. This allows for easy identification on the chart.
Custom Wick Lines: To ensure the wicks stand out, the indicator draws yellow lines above and below the candles, representing the upper and lower wicks. These lines remain fixed in place even as the chart is scaled or moved.
How It Works:
The indicator identifies candles where:
The upper wick is longer than the body by a specified ratio.
The lower wick is longer than the body by the same ratio.
The candle's body size is small compared to the total candle range (less than 30% of the range).
The volume is significantly higher than the 20-period moving average volume, indicating increased market activity.
When these conditions are met, the indicator marks the candle by coloring its body and wicks yellow. Additionally, it draws custom yellow wick lines to visually represent the wick size.
How to Use:
This indicator is designed to highlight potential reversal points or periods of indecision in the market. Traders can use it to spot possible turning points, especially when accompanied by other technical analysis tools such as support/resistance levels or trend indicators.
Customizable Parameters:
Wick to Body Ratio: Controls the sensitivity for detecting large wicks relative to the candle body.
Volume Factor: Adjusts the threshold for identifying candles with significantly higher volume than the moving average.
David_candle length with average and candle directionThis indicator,
calculates the difference between the highest and lowest price (High-Low difference) for a specified number of periods and displays it in a table. Here are the functions and details included:
Number of Periods: The user can define the number of periods (e.g., 10) for which the High-Low differences are calculated.
Table Position: The position of the table that displays the results can be selected by the user (top left, top right, bottom left, or bottom right).
High-Low Difference per Candle: For each defined period, the difference between the highest and lowest price of the respective candle is calculated.
Candle Direction: The color of the displayed text in the table changes based on the candle direction:
Green for bullish candles (close price higher than open price).
Red for bearish candles (close price lower than open price).
White for neutral candles (close price equal to open price).
Average: Below the High-Low differences, the average value of the calculated differences is displayed in yellow text.
This indicator is useful for visually analyzing the volatility and movement range within the recent candles by highlighting the average High-Low difference.

Master Candle Breakout V1 Master Candle Breakout V1 - Indicator Description
The Master Candle Breakout V1 indicator is a powerful price action-based tool designed to help traders identify and capitalize on breakout opportunities from consolidation phases. This indicator is particularly useful for identifying master candles, which are large candles that encompass the range of subsequent candles, creating a key level of support or resistance. Once the price breaks above or below the range of the master candle, the indicator provides clear buy or sell signals, allowing traders to ride the momentum of the breakout.
Key Features:
Master Candle Detection: The indicator identifies master candles based on a user-defined period, marking them on the chart as critical breakout points.
Buy and Sell Signals: When the price breaks above the master candle's high, a buy signal is plotted. Similarly, when the price breaks below the master candle's low, a sell signal is generated. These signals are displayed on the chart with customizable shapes (diamonds, arrows, circles, crosses) and colors for easy visualization.
Stop-Loss Level Display: For risk management, the indicator calculates and plots a stop-loss level based on user-defined ticks above or below the master candle's high or low. The stop-loss value is shown as a label next to the signal, helping traders manage risk effectively.
Customizable Colors and Shapes: Users can fully customize the appearance of the signals, including the color of the buy/sell diamonds, the stop-loss label text color, and the type of shape used for the signals.
Versatile Application: The Master Candle Breakout V1 can be applied to any timeframe and market, from forex and stocks to commodities and cryptocurrencies, making it a highly versatile tool for traders of all types.
How to Use:
Master Candle Period: Define how many candles should follow the master candle for confirmation.
Stop Loss Ticks: Set the number of ticks above or below the master candle to define your stop-loss level.
Entry Signals: Once the price closes outside the high or low of the master candle, enter the trade accordingly (buy on breakouts above the high, sell on breakouts below the low).
Risk Management: Use the stop-loss level provided by the indicator to minimize losses and protect your capital.
This indicator is perfect for traders who prefer a simple, price-action-based strategy and want to avoid the clutter of traditional indicators. By focusing on the core principle of breakouts, Master Candle Breakout V1 helps traders quickly identify consolidation zones and potential breakout trades.

Bullish On Neck Candlestick patternExplanation:
1. Bullish Large Candle: The first candle is defined as bullish, where the closing price is much higher than the opening price. It also needs to have a large body (at least 60% of the total candle height).
2. Small Bearish Candle: The second candle is bearish and closes near the high of the previous bullish candle, with a relatively small body.
3. Bullish On Neck Detection: The script looks for this pattern where the bullish large candle is followed by a smaller bearish candle that closes near the first candle's high, indicating potential for a bullish breakout.
4. Plot: When the pattern is detected, the script places a green triangle above the bar to signal the bullish on neck pattern.

Indecisive CandlesAn Indecisive Candle, often referred to as a Base Candle, is a pivotal element in technical analysis, particularly for identifying institutional supply and demand zones. These candles are characterized by their small bodies and long wicks, reflecting a balance between buyers and sellers, indicating a potential pause or consolidation in the market.
To calculate whether a candle qualifies as an indecisive candle based on the criterion that its body (the absolute difference between its open and close prices) is less than or equal to 50% of the total range of the candle (the difference between its high and low prices).
Key Features:
Small Real Body: Signifies minimal movement from open to close, indicating market indecision.
Long Upper and Lower Wicks: Show that both bulls and bears attempted to control the price, but neither succeeded, leading to a standoff.
Formation Context: Typically found at the end of a strong trend or within a consolidation phase, hinting at a potential reversal or continuation pattern.
Usage in Identifying Institutional Supply and Demand:
Supply Zones: When an Indecisive Candle forms after a rally, it can mark the onset of an institutional supply zone, suggesting that large entities are starting to sell, leading to potential downward pressure.
Demand Zones: Conversely, when this candle appears after a downtrend, it often signals the emergence of a demand zone, where institutions begin to accumulate, anticipating a price increase.
Trading Strategies:
Zone Identification: Use Indecisive Candles to pinpoint key supply and demand zones on your chart, enhancing the accuracy of your support and resistance levels.
Confirmation: Look for confirmation from subsequent price action or volume spikes to validate the presence of institutional activity before making trading decisions.
Risk Management: Place stop-loss orders beyond the wicks of these candles to protect against false breakouts or continued indecision.
Conclusion:
Indecisive Candles are essential tools for traders looking to understand market sentiment and institutional behavior. By mastering their identification and interpretation, you can enhance your ability to spot high-probability trading opportunities and manage risks effectively.
