Candle Volume Profile Marker# 📊 Candle Volume Profile Marker (CVPM)
**Transform your chart analysis with precision volume profile levels on every candle!**
The Candle Volume Profile Marker displays key volume profile levels (POC, VAH, VAL) for individual candles, giving you granular insights into price acceptance and rejection zones at the micro level.
## 🎯 **Key Features**
### **Core Levels**
- **POC (Point of Control)** - The price level with highest volume concentration
- **VAH (Value Area High)** - Upper boundary of the value area
- **VAL (Value Area Low)** - Lower boundary of the value area
- **Customizable Value Area** - Adjust percentage from 50% to 90%
### **Flexible Display Options**
- **Current Candle Only** or **Historical Lookback** (1-50 candles)
- **Multiple Visual Styles** - Lines, dots, crosses, triangles, squares, diamonds
- **Smart Line Extensions** - Right only, both sides, or left only
- **4 Line Length Modes** - Normal, Short, Ultra Short, Micro (for ultra-clean charts)
- **Full Color Customization** - Colors, opacity, line width
- **Adjustable Marker Sizes** - Tiny to Large
### **Advanced Calculation Methods**
Choose your POC calculation:
- **Weighted** - Smart estimation based on volume distribution (default)
- **Close** - Uses closing price
- **Middle** - High-Low midpoint
- **VWAP** - Volume weighted average price
### **Professional Tools**
- **Real-time Info Table** - Current levels display
- **Smart Alerts** - POC crosses and Value Area breakouts
- **Highlight Current Candle** - Extended dotted lines for current levels
- **Developing Levels** - Real-time updates for active candle
## 🚀 **Why Use CVPM?**
### **Precision Trading**
- Identify exact support/resistance on each candle
- Spot volume acceptance/rejection zones
- Plan entries and exits with micro-level precision
### **Clean & Customizable**
- Lines extend only right (eliminates confusion)
- Ultra-short line options for minimal chart clutter
- Professional appearance with full customization
### **Multiple Timeframes**
- Works on any timeframe from 1-minute to monthly
- Historical analysis with adjustable lookback
- Real-time developing levels
## 📈 **Perfect For**
- **Day Traders** - Micro-level entry/exit points
- **Swing Traders** - Key levels for position management
- **Volume Analysis** - Understanding price acceptance zones
- **Support/Resistance Trading** - Precise level identification
- **Breakout Trading** - Value area breakout alerts
## ⚙️ **Easy Setup**
1. Add indicator to your chart
2. Choose your preferred visual style (lines/dots)
3. Select line extension (right-only recommended)
4. Adjust line length (try "Ultra Short" for clean charts)
5. Customize colors and enable alerts
## 🎨 **Customization Groups**
- **Display Options** - What to show and how many candles
- **Calculation** - POC method and value area percentage
- **POC Visual** - Style, color, width, length for Point of Control
- **Value Area Visual** - Style, color, width, length for VAH/VAL
- **Line Settings** - Extension direction and length modes
- **Size** - Marker sizes and opacity
## 🔔 **Built-in Alerts**
- Price crosses above/below POC
- Value Area breakouts (up/down)
- Fully customizable alert messages
## 💡 **Pro Tips**
- Use "Right Only" extension to avoid confusion about which candle owns the levels
- Try "Ultra Short" or "Micro" line modes for cleaner charts
- Enable "Highlight Current Candle" for extended reference lines
- Combine with volume indicators for enhanced analysis
- Use different colors for easy POC/VAH/VAL identification
---
**Transform your volume analysis today with the most flexible and customizable candle-level volume profile indicator available!**
*Perfect for traders who demand precision and clean, professional charts.*
Cari dalam skrip untuk "candle"

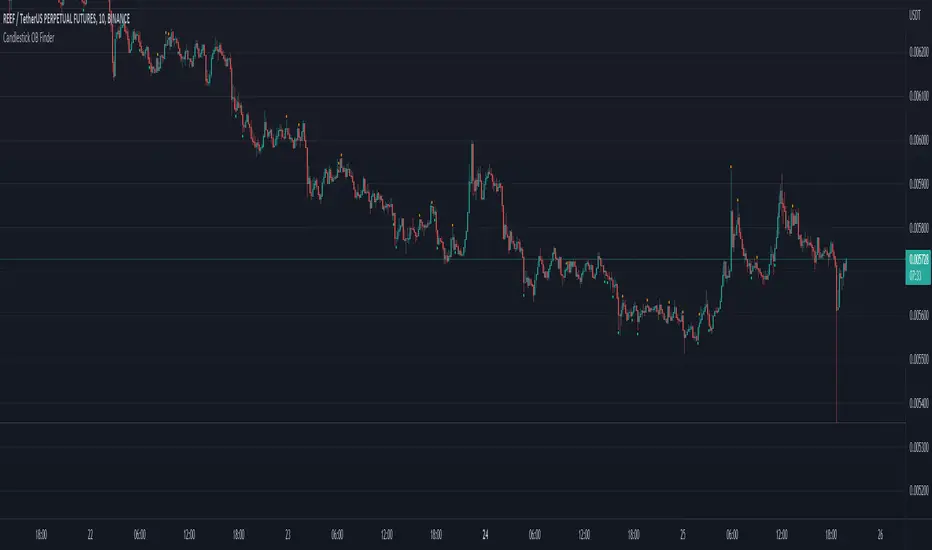
Candlestick OB FinderIntroduction
Hello, this here is a non-repainting candlestick indicator which is able to detect OB looking candlestick formations.
Usage
It can be used to confirm entries, but be aware that it produces a lot of false signals.
Somehow the swings tend to reverse at these points.
I recommend the 10–15 minutes timeframe.
I hope you enjoy this small indicator. :)
Candle Close ConfirmationTradingview doesn't provide a way to prevent unclosed candles from displaying in real time.
This script helps to reduce errors that span from reading unconfirmed candles by preventing the unconfirmed candle from displaying across all timeframes.
Ideal for traders with strategies that rely on candle confirmation signals.
NOTE: It works by drawing new candles based on the normal candles and stops just before the current unconfirmed candle, so you need to disable regular bar chart candles for this to work properly.
How to do that -
Chart Settings >
Symbols >
Candles >
Disable (Body, Borders, Wick)
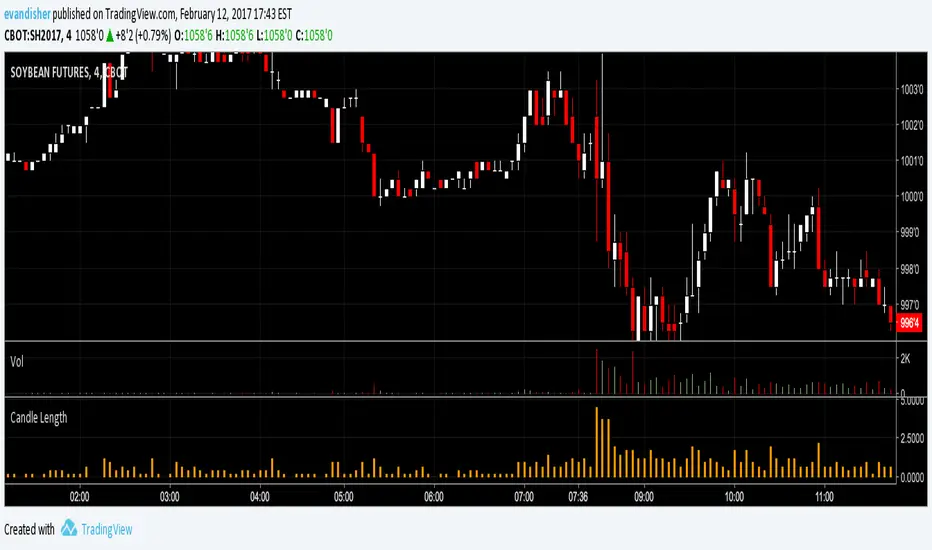
Candle Length by WiscoDishMeasure of the total candle length, including the upper and lower wicks. Works best as a histogram in my opinion. Used as a quick reference for the high minus the low of each candle.
Candle Breakout StrategyShort description (one-liner)
Candle Breakout Strategy — identifies a user-specified candle (UTC time), draws its high/low range, then enters on breakouts with configurable stop-loss, take-profit (via Risk:Reward) and optional alerts.
Full description (ready-to-paste)
Candle Breakout Strategy
Version 1.0 — Strategy script (Pine v5)
Overview
The Candle Breakout Strategy automatically captures a single "range candle" at a user-specified UTC time, draws its high/low as a visible box and dashed level lines, and waits for a breakout. When price closes above the range high it enters a Long; when price closes below the range low it enters a Short. Stop-loss is placed at the opposite range boundary and take-profit is calculated with a user-configurable Risk:Reward multiplier. Alerts for entries can be enabled.
This strategy is intended for breakout style trading where a clearly defined intraday range is established at a fixed time. It is simple, transparent and easy to adapt to multiple symbols and timeframes.
How it works (step-by-step)
On every bar the script checks the current UTC time.
When the first bar that matches the configured Target Hour:Target Minute (UTC) appears, the script records that candle’s high and low. This defines the breakout range.
A box and dashed lines are drawn on the chart to display the range and extended to the right while the range is active.
The script then waits for price to close outside the box:
Close > Range High → Long entry
Close < Range Low → Short entry
When an entry triggers:
Stop-loss = opposite range boundary (range low for longs, range high for shorts).
Take-profit = entry ± (risk × Risk:Reward). Risk is computed as the distance between entry price and stop-loss.
After entry the range becomes inactive (waitingForBreakout = false) until the next configured target time.
Inputs / Parameters
Target Hour (UTC) — the hour (0–23) in UTC when the range candle is detected.
Target Minute — minute (0–59) of the target candle.
Risk:Reward Ratio — multiplier for computing take profit from risk (0.5–10). Example: 2 means TP = entry + 2×risk.
Enable Alerts — turn on/off entry alerts (string message sent once per bar when an entry occurs).
Show Last Box Only (internal behavior) — when enabled the previous box is deleted at the next range creation so only the most recent range is visible (default behavior in the script).
Visuals & On-chart Info
A semi-transparent blue box shows the recorded range and extends to the right while active.
Dashed horizontal lines mark the range high and low.
On-chart shapes: green triangle below bar for Long signals, red triangle above bar for Short signals.
An information table (top-right) displays:
Target Time (UTC)
Active Range (Yes / No)
Range High
Range Low
Risk:Reward
Alerts
If Enable Alerts is on, the script sends an alert with the following formats when an entry occurs:
Long alert:
🟢 LONG SIGNAL
Entry Price:
Stop Loss:
Take Profit:
Short alert:
🔴 SHORT SIGNAL
Entry Price:
Stop Loss:
Take Profit:
Use TradingView's alert dialog to create alerts based on the script — select the script’s alert condition or use the alert() messages.
Recommended usage & tips
Timeframe: This strategy works on any timeframe but the definition of "candle at target time" depends on the chart timeframe. For intraday breakout styles, use 1m — 60m charts depending on the session you want to capture.
Target Time: Choose a time that is meaningful for the instrument (e.g., market open, economic release, session overlap). All times are handled in UTC.
Position Sizing: The script’s example uses strategy.percent_of_equity with 100% default — change default_qty_value or strategy settings to suit your risk management.
Filtering: Consider combining this breakout with trend filters (EMA, ADX, etc.) to reduce false breakouts.
Backtesting: Always backtest over a sufficiently large and recent sample. Pay attention to slippage and commission settings in TradingView’s strategy tester.
Known behavior & limitations
The script registers the breakout on close outside the recorded range. If you prefer intrabar breakout rules (e.g., high/low breach without close), you must adjust the condition accordingly.
The recorded range is taken from a single candle at the exact configured UTC time. If there are missing bars or the chart timeframe doesn't align, the intended candle may differ — choose the target time and chart timeframe consistently.
Only a single active position is allowed at a time (the script checks strategy.position_size == 0 before entries).
Example setups
EURUSD (Forex): Target Time 07:00 UTC — captures London open range.
Nifty / Index: Target Time 09:15 UTC — captures local session open range.
Crypto: Target Time 00:00 UTC — captures daily reset candle for breakout.
Risk disclaimer
This script is educational and provided as-is. Past performance is not indicative of future results. Use proper risk management, test on historical data, and consider slippage and commissions. Do not trade real capital without sufficient testing.
Change log
v1.0 — Initial release: range capture, box and level drawing, long/short entry by close breakout, SL at opposite boundary, TP via Risk:Reward, alerts, info table.
If you want, I can also:
Provide a short README version (2–3 lines) for the TradingView “Short description” field.
Add a couple of suggested alert templates for the TradingView alert dialog (if you want alerts that include variable placeholders).
Convert the disclaimer into multiple language versions.

Candle PlotUsed Linear Regression Candles by ugurvu
Added Regular and Heiken Ashi candles to choices
Added ability to choose timeframe but I find it does not look great when showing higher timeframes
To keep main chart less cluttered, I will add this indicator to my chart and then move a secondary indicator from the chart into it. You will need to pin the scale of the indicator to the scale of the Candle Plot.
Or, you can have the regular chart set to Regular candle and the Candle Plot set to Heiken Ashi or vice versa.

Candle Partition Statistics with IQV and Chi2NOTE: THE FORMULA IN THE CHART IS NOT PART OF THE CODE
This Pine Script calculates statistical measures for candle partitions based on whether a candle is bullish or bearish and whether the price is above or below an EMA. It evaluates statistical properties such as the Index of Qualitative Variation (IQV) and the Chi-Square (χ²) statistic to assess variations in price action.
Concept of Index of Qualitative Variation (IQV)
IQV is a statistical measure used to quantify the diversity or dispersion of categorical variables. In this script, it is used to measure how evenly the four categories of candles (green above EMA, red above EMA, green below EMA, red below EMA) are distributed.
Purpose of IQV in the Script:
IQV ranges from 0 to 1, where 0 indicates no variation (one category dominates) and 1 indicates maximum variation (categories are equally distributed).
A high IQV suggests balanced distributions of bullish/bearish candles above/below the EMA, indicating market uncertainty or mixed sentiment.
A low IQV suggests dominance of a particular candle type, indicating a strong trend.
Concept of Chi-Square (χ²) Test
Chi-square (χ²) is a statistical test that measures the difference between expected and observed frequencies of categorical data. It assesses whether short-term price behavior significantly deviates from historical trends.
Purpose of Chi-Square in the Script:
A high χ² value means that short-term candle distributions are significantly different from historical patterns, indicating potential trend shifts.
If χ² exceeds a predefined significance threshold (chi_threshold), an alert (Chi² Alert!) is triggered.
It helps traders identify periods where recent price behavior deviates from historical norms, possibly signaling trend reversals or market regime changes.
Key Takeaways:
IQV helps measure the diversity of price action, detecting whether the market is balanced or trending.
Chi-square (χ²) identifies significant deviations in short-term price behavior compared to long-term trends.
Both metrics together provide insights into whether the market is stable, trending, or shifting.
The Nasan C-score enhances trend strength by incorporating volatility. It is calculated as:
enhanced_t_s =(𝑡𝑠 × avg_movement x 100)/SMA(𝑐lose)
Key Components:
𝑡𝑠 : Measures trend strength based on price movements relative to EMA.
ts=green_EMAup_a+0.5×red_EMAup_a−(0.5×green_EMAdown_a+red_EMAdown_a)
avg_movement: The SMA of absolute close-open differences, capturing volatility.
Normalization: The division by SMA(close) adjusts the score relative to price levels.
Purpose of the Nasan C-score
Enhanced Trend Strength
It amplifies the trend strength value by factoring in volatility (price movement).
If price volatility is high, trend strength variations have a greater impact.
Volatility-Adjusted Momentum
By scaling 𝑡𝑠 with average movement, the score adjusts to changing price dynamics.
Higher price fluctuations lead to a higher score, making trend shifts more prominent.
How It Can Be Used in Trading
Higher values of Nasan C-score indicate strong bullish or bearish trends.
Comparing it with past values helps determine whether momentum is increasing or fading.
Thresholds can be set to identify significant trend shifts based on historical highs and lows.

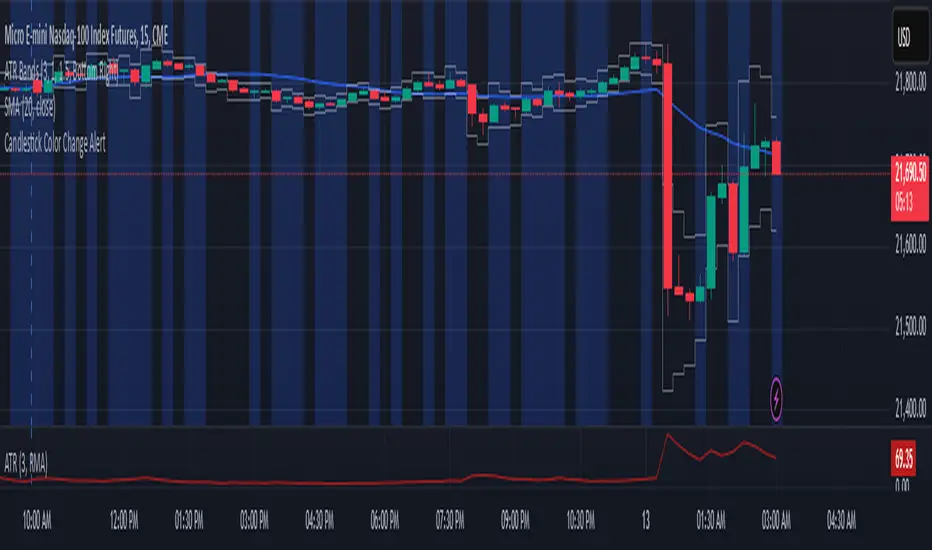
Candlestick Color Change AlertIt is an alert for change of candlestick color.
Identifies Candle Type
A candle is bullish if the closing price is higher than the opening price.
A candle is bearish if the closing price is lower than the opening price.
Detects a Color Change
The script checks if the current candle is bullish while the previous candle was bearish, or vice versa.
If a change is detected, an alert is triggered.
Triggers an Alert
Users receive an alert notification whenever a candlestick color change occurs.
Alerts can be set for popup, email, mobile push, or webhook notifications.
Visual Highlighting (Optional)
The script can also apply a background color (blue) on the chart to visually mark color changes.
Candle Gap ScannerThis code will compare the first candle with the second candle. If the highest value reached by the first candle is lower than the lowest value reached by the second candle, and this difference is greater than a percentage value that can be adjusted in the settings, it will place a red mark. Additionally, it will compare the first candle with the second candle again. If the lowest value reached by the first candle is higher than the highest value reached by the second candle, and this difference is greater than a percentage value that can be adjusted in the settings, it will place a red mark.

CANDLE RANGE THEORY (H1 Only)Hello traders.
This indicator identifies CRT candles
-Each candle is a range.
-Each candle has its own po3.
-Focus on specific times of the day. By recognizing the importance of time and price, we can capture high-quality trades. Together with HTF PD array, Look for 4-hour candles forming at specific times of the day. (1am - 5am - 9am EST)
-After the 1st candle, wait for the 2nd candle to clear the high/low of the 1st candle and then close inside the 1st candle range at a specific time (1-5-9) and look for entries in the LTF
Why choose 1 5 9 hours EST?
### **1. 1:00 AM (EST)**
- **Trading Session:** This is the time between the Tokyo (Asian) session and the Sydney (Australian) session. The Asian market is very active.
- **Characteristics:**
- Liquidity: Moderate, as only the Asian market is active.
- Volatility: Pairs involving JPY (Japanese Yen), AUD (Australian Dollar), and NZD (New Zealand Dollar) tend to have higher volatility.
- Trading Opportunities: Suitable for traders who like to trade trends or news in the Asian region.
- **Note:** Volatility may be lower than the London or New York session.
### **2. 5:00 AM (EST)**
- **Trading Session:** This is the time near the end of the Tokyo session and the London (European) session is about to open.
- **Characteristics:**
- Liquidity: Starts to increase due to the preparation of the European market.
- Volatility: This is the time between two trading sessions, there can be strong fluctuations, especially in major currency pairs such as EUR/USD, GBP/USD.
- Trading opportunities: Suitable for breakout trading strategies when liquidity increases.
- **Note:** The overlap between Tokyo and London can cause sudden fluctuations.
### **3. 9:00 AM (EST)**
- **Trading sessions:** This time is within the London session and near the beginning of the New York session.
- **Characteristics:**
- Liquidity: Very high, as this is the period between the two largest sessions – London and New York.
- Volatility: Extremely strong, especially for major currency pairs such as EUR/USD, GBP/USD, USD/JPY.
- Trading opportunities: Suitable for both news trading and trend trading, as this is the time when a lot of economic data is released (usually from the US or the European region).
- **Note:** High volatility can bring big profits, but also comes with high risks.
### **Summary of effects:**
- **1 AM (EST):** Moderate volatility, focusing on Asian currency pairs.
- **5 AM (EST):** Increased liquidity and volatility, suitable for breakout trading.
- **9 AM (EST):** High volatility and high liquidity, the best time for Forex trading.
==> How to trade, when the high/low of CRT is swept, move to LTF to wait for confirmation to enter the order
Only sell at high level and buy at discount price.
Find CE at specific important time. Trading CRT with HTF direction has better win rate.
The more inside bars, the higher the probability.
Place a partial and Move breakeven at 50% range.
Do a backtest and post your chart.

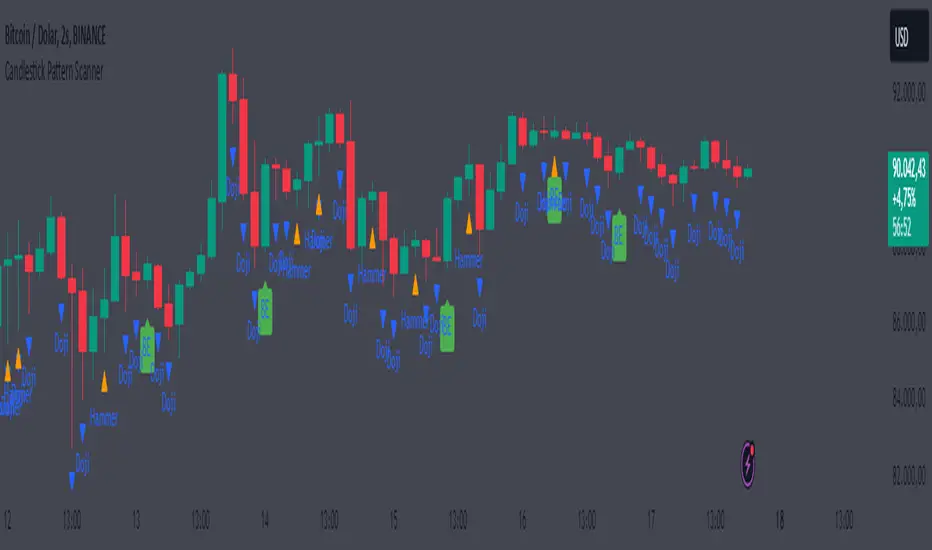
Candlestick Pattern ScannerCandlestick Pattern Scanner
This indicator identifies popular candlestick patterns on the chart and provides visual and alert-based support for traders. Based on technical analysis, it provides insights into potential trend reversals or continuation signals in price action. The following patterns are detected and marked:
1. Bullish Engulfing
Definition: Considered a strong bullish signal. A small red candle is followed by a large green candle that completely engulfs the previous one.
Chart Display: Marked with a green arrow below the price bar.
Alert Message: "Bullish Engulfing Pattern Detected!"
2. Bearish Engulfing
Definition: Considered a strong bearish signal. A small green candle is followed by a large red candle that completely engulfs the previous one.
Chart Display: Marked with a red arrow above the price bar.
Alert Message: "Bearish Engulfing Pattern Detected!"
3. Doji
Definition: Indicates indecision in the market. The candlestick has an opening and closing price that are almost the same, forming a very small body.
Chart Display: Marked with a blue triangle below the price bar.
Alert Message: "Doji Pattern Detected!"
4. Hammer
Definition: Can signal a strong bullish reversal. It has a long lower shadow and a small body, often appearing at the end of a downtrend.
Chart Display: Marked with an orange triangle below the price bar.
Alert Message: "Hammer Pattern Detected!"
5. Shooting Star
Definition: Can signal a strong bearish reversal. It has a long upper shadow and a small body, often appearing at the end of an uptrend.
Chart Display: Marked with a purple triangle above the price bar.
Alert Message: "Shooting Star Pattern Detected!"
Features:
Visual Support: Patterns are clearly marked on the chart using distinct shapes (arrows and triangles).
Alerts: Receive real-time notifications through TradingView’s alert system when a pattern is detected.
Versatility: Useful for identifying both trend reversals and continuation signals.
User-Friendly: Patterns are easily distinguishable with unique color coding.
Purpose:
This indicator helps traders identify potential reversal points or strong trend beginnings in price action. It can be used as a supportive tool in scalping, swing trading, or long-term investment strategies.
Candle AnalysisImportant Setup Note
Optimize Your Viewing Experience
To ensure the Candle Analysis Indicator displays correctly and to prevent any default chart colors from interfering with the indicator's visuals, please adjust your chart settings:
Right-Click on the Chart and select "Settings".
Navigate to the "Symbol" tab.
Set transparent default candle colors:
- Body
-Borders
- Wick
By customizing these settings, you'll experience the full visual benefits of the indicator without any overlapping colors or distractions.
Elevate your trading strategy with the Candle Analysis Indicator—a powerful tool designed to give you a focused view of the market exactly when you need it. Whether you're honing in on specific historical periods or testing new strategies, this indicator provides the clarity and control you've been looking for.
Key Features:
🔹 Custom Date Range Selection
Tailored Analysis: Choose your own start and end dates to focus on the market periods that matter most to you.
Historical Insights: Dive deep into past market movements to uncover hidden trends and patterns.
🔹 Dynamic Backtesting Simulation
Interactive Playback: Enable backtesting to simulate how the market unfolded over time.
Strategy Testing: Watch candles appear at your chosen interval, allowing you to test and refine your trading strategies in real-time scenarios.
🔹 Enhanced Visual Clarity
Focused Visualization: Only candles within your specified date range are highlighted, eliminating distractions from irrelevant data.
Distinct Candle Styling: Bullish and bearish candles are displayed with unique colors and transparency, making it easy to spot market sentiment at a glance.
🔹 User-Friendly Interface
Easy Setup: Simple input options mean you can configure the indicator quickly without any technical hassle.
Versatile Application: Compatible with various timeframes—whether you're trading intraday, daily, or weekly.
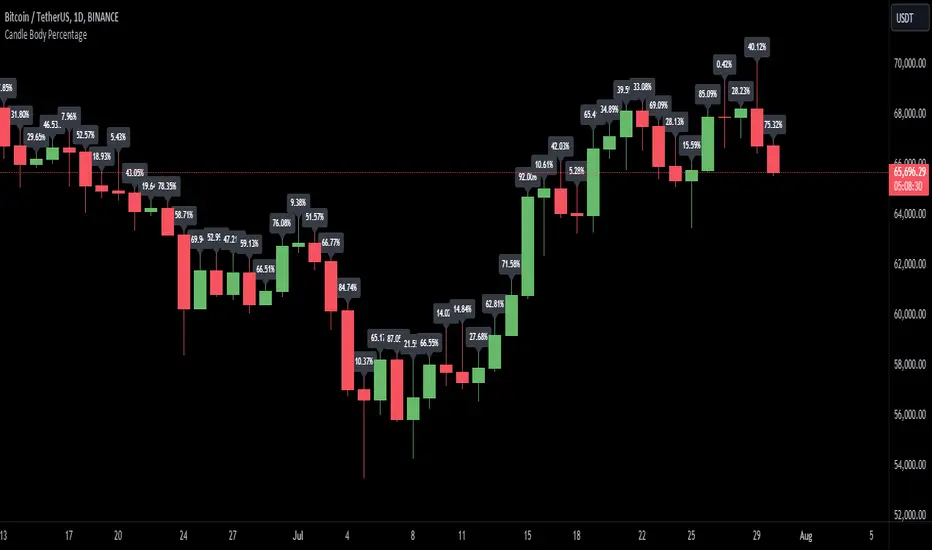
Candle Body Percentage IndicatorThe Candle Body Percentage Indicator is a custom TradingView script designed to display the percentage of the candle's body relative to the full candle length for each bar on the chart. This indicator helps traders quickly assess the strength of price movements by comparing the body (the range between the open and close prices) to the total range of the candle (the range between the high and low prices).
Features:
Body Length Calculation: The indicator calculates the absolute difference between the open and close prices to determine the body length of the candle.
Full Length Calculation: It also calculates the total length of the candle by finding the difference between the high and low prices.
Body Percentage Calculation: The body length is then divided by the full length of the candle and multiplied by 100 to get the body percentage.
Label Display: For each candle, the indicator places a label above the high of the candle showing the body percentage. The label includes the percentage value and a "%" sign for clarity.
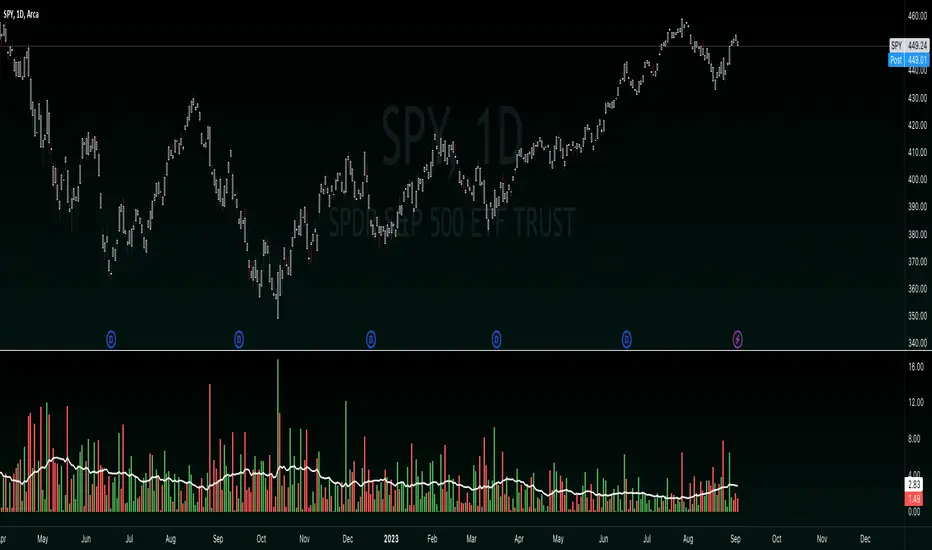
Candle volume analysis The indicator is designed for traders who are more interested in market structures and price action using volumes. Volume analysis can help traders build a clearer understanding of zones of buyer and seller interest, as well as places to capture liquidity (traders' stop levels).
Key Features:
The indicator highlights candle volumes in selected colors, where the volume is greater individually than the volumes of the trader's chosen number of preceding candles. Or the volume that is greater than the sum of volumes of the trader's chosen number of preceding candles.

Candle Size w/ SMAThis simple indicator calculates the absolute size of the candle by the open and close or high and low values and then plots it on a histogram. It also features a simple moving average with a customizable lookback to track the average candle size based on your lookback.
This indicator can be used to spot unusually large or small candles. And can also be used for testing other strategies or indicators related to candle sizes.
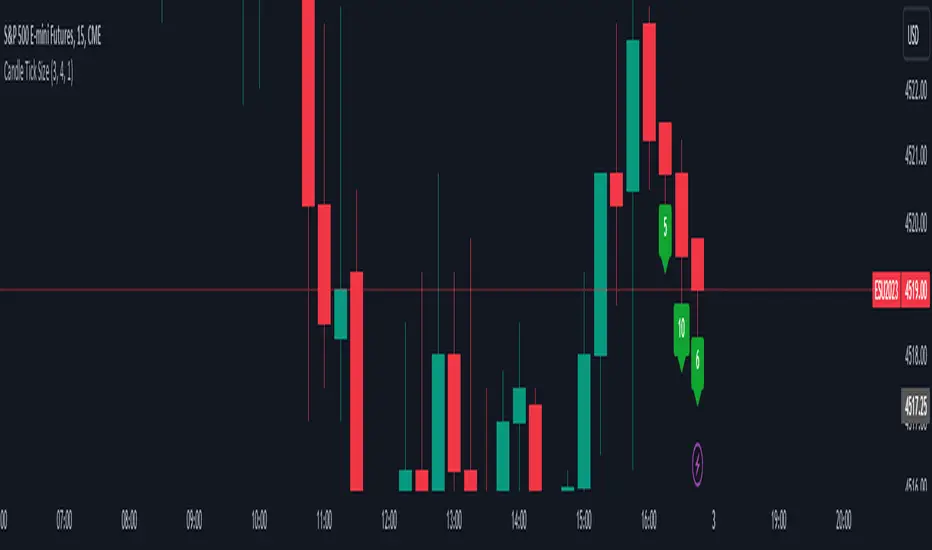
Candle Tick SizeHello everyone!
I dont think it exists, I couldnt find it any way I searched, maybe it is part of a bigger indicator. This is a really basic code, all it does, it shows the tick/pip size of the candles forming. You can adjust on how many candles should it show. Also because the code counts the point size of the candles from high to low, you can adjust that how many ticks are in one point, like for ES and NQ 4 ticks to a point, which is the basic setting. It helps me with entrys when I calculate the contract size so my risk/reward stays pretty much the same depending on the candle size for my entrys.
Candle Size Table (Big Font & Colors)Symbols: gold, oil, BTC, silver, USDJPY, GBPUSD, USDCAD, AUDUSD
Timeframes: 1m and 5m
Size of the previous candle (for each TF)
I’ll assume “size” = candle range (high − low) of the previous closed candle.

Candle Close CounterThis indicator counts how many candles have closed above, below, or exactly at a user-defined price level
starting from a specified time. It provides real-time statistics to help traders analyze price behavior
around key levels.
HOW IT WORKS:
The indicator begins counting at your chosen start time and tracks each candle's closing price relative
to your specified price level. It maintains running totals of candles that close above, below, and at
the price level, displaying this information both in a chart label and a statistics table.
PRACTICAL APPLICATIONS:
1. CONSOLIDATION ANALYSIS:
Use this tool to identify and measure consolidation patterns by placing the price level at the midpoint
of a trading range. A balanced count of candles closing above and below the midpoint suggests genuine
consolidation with no directional bias.
2. RANGE MIDPOINT MONITORING:
During consolidation phases, set the price level to the 50% retracement of the range midpoint between
the high and low. Monitor how price interacts with this level over time.
3. SUPPORT/RESISTANCE VALIDATION:
Place the price level at a key support or resistance zone and start counting from a significant market
event (news release, session open, etc.). The distribution of closes helps validate whether the level
is holding or weakening.
4. SESSION ANALYSIS:
Set the start time to the beginning of a trading session (e.g., 9:30 AM ET for regular hours) and place
the level at the opening price or previous day's close.

Candle Time Remaining (v6 Dynamic Fixed)displays the time remaining on the current candle above the printing candle. turns red when red and green when candle is green

Improved Candle Strategy (without daily squared)# Candle Pattern Trading Strategy
## Core Logic
Analyzes the last 5 candlesticks to identify "close at high" and "close at low" patterns, generating long/short signals.
## Trading Conditions
- **Long**: ≥2 bars closed at high in past 5 bars + current bar closes at high → Open long
- **Short**: ≥2 bars closed at low in past 5 bars + current bar closes at low → Open short
- **Filter**: If ≥3 doji patterns detected, skip trading
## Risk Management
- Stop Loss: Based on entry bar's high/low
- Take Profit: Risk × 2x multiplier
- Cooldown: No trading for 2 bars after entry
- Session Filter: No trading for first 5 bars after market open
## Configurable Parameters
- Lookback period, doji threshold, close proximity ratio, TP/SL ratio, cooldown bars, etc.
**Use Cases**: 1-minute and higher timeframes on stocks/futures

Candlestick Suite–(Phoenix) it colors the major Reversal candlesticks
BullEngulf or BearEngulf or Engulfing() -> DARK_ORANGE
PiercingLine or DarkCloudCover -> CYAN
BullishHarami or BearishHarami -> YELLOW
BullishInsideBar or BearishInsideBar -> WHITE

Candle Closer Levels & TP Zones📝 Description:
This indicator is designed to provide intrabar trade levels for high-speed execution strategies, such as scalping and intraday momentum trading.
🧩 Key Features:
Plots High, Low, Mid, and two Quarter Levels on the current candle only, keeping charts clean
Take Profit (TP) lines are calculated as a percentage of candle range, not fixed ticks — this makes it highly adaptable for futures like NQ/ES or volatile markets like crypto
Supports both long and short setups via a simple toggle
Customizable colors, line thickness, and length
Each TP level can be enabled or muted individually
📈 Use Case:
Apply this tool to spot candle-based breakouts or rejections. You can scale TPs dynamically based on the strength of the current candle. This is especially helpful in assets where volatility fluctuates greatly intrabar.
This is not a repackaged built-in indicator — it’s purpose-built for real-time tactical level plotting without historical noise.

Candle Body Strength CounterThis indicator measures the total bullish and bearish candle body strength over a user-defined lookback period. For each bar, it sums the absolute body sizes of bullish candles (where close > open) and bearish candles (where close < open) within the lookback window. The result is two lines: one for bullish body strength and one for bearish body strength, making it easy to spot shifts in market momentum and bias.
Adjustable lookback period (default: 20 bars)
Green line: cumulative bullish body strength
Red line: cumulative bearish body strength
Use this tool to quickly assess which side (bulls or bears) has been stronger over your chosen timeframe.
