SMC+The "SMC+" indicator is a comprehensive tool designed to overlay key Smart Money Concepts (SMC) levels, support/resistance zones, order blocks (OB), fair value gaps (FVG), and trap detection on your TradingView chart. It aims to assist traders in identifying potential areas of interest based on price action, swing structures, and volume dynamics across multiple timeframes. This indicator is fully customizable, allowing users to adjust lookback periods, colors, opacity, and sensitivity to suit their trading style.
Key Components and Functionality
1. Key Levels (Support and Resistance)
This section plots horizontal lines representing support and resistance levels based on highs and lows over three distinct lookback periods, plus daily nearest levels.
Short-Term Lookback Period (Default: 20 bars)
Plots the highest high (short_high) and lowest low (short_low) over the specified period.
Visualized as dotted lines with customizable colors (Short-Term Resistance Color, Short-Term Support Color) and opacity (Short-Term Resistance Opacity, Short-Term Support Opacity).
Adjustment Tip: Increase the lookback (e.g., to 30-50) for less frequent but stronger levels on higher timeframes, or decrease (e.g., to 10-15) for scalping on lower timeframes.
Long-Term Lookback Period (Default: 50 bars)
Plots broader support (long_low) and resistance (long_high) levels using a solid line style.
Customizable via Long-Term Resistance Color, Long-Term Support Color, and their respective opacity settings.
Adjustment Tip: Extend to 100-200 bars for swing trading or major trend analysis on daily/weekly charts.
Extra-Long Lookback Period (Default: 100 bars)
Identifies significant historical highs (extra_long_high) and lows (extra_long_low) with dashed lines.
Configurable with Extra-Long Resistance Color, Extra-Long Support Color, and opacity settings.
Adjustment Tip: Use 200-500 bars for monthly charts to capture macro-level key zones.
Daily Nearest Resistance and Support Levels
Dynamically calculates the nearest resistance (daily_res_level) and support (daily_sup_level) based on the current day’s price action relative to historical highs and lows.
Displayed with Daily Resistance Color and Daily Support Color (with opacity options).
Adjustment Tip: Works best on intraday charts (e.g., 15m, 1h) to track daily pivots; combine with volume profile for confirmation.
How It Works: These levels update dynamically as new highs/lows form, providing a visual guide to potential reversal or breakout zones.
2. SMC Inputs (Smart Money Concepts)
This section identifies swing structures, order blocks, fair value gaps, and entry signals based on SMC principles.
SMC Swing Lookback Period (Default: 12 bars)
Defines the period for detecting swing highs (smc_swing_high) and lows (smc_swing_low).
Adjustment Tip: Increase to 20-30 for smoother swings on higher timeframes; reduce to 5-10 for faster signals on lower timeframes.
Minimum Swing Size (%) (Default: 0.5%)
Filters out minor price movements to focus on significant swings.
Adjustment Tip: Raise to 1-2% for volatile markets (e.g., crypto) to avoid noise; lower to 0.2-0.3% for forex pairs with tight ranges.
Order Block Sensitivity (Default: 1.0)
Scales the size of detected order blocks (OBs) for bullish reversal (smc_ob_bull), bearish reversal (smc_ob_bear), and continuation (smc_cont_ob).
Visuals include customizable colors, opacity, border thickness, and blinking effects (e.g., SMC Bullish Reversal OB Color, SMC Bearish Reversal OB Blink Thickness).
Adjustment Tip: Increase to 1.5-2.0 for wider OBs in choppy markets; keep at 1.0 for precision in trending conditions.
Minimum FVG Size (%) (Default: 0.3%)
Sets the minimum gap size for Fair Value Gaps (fvg_high, fvg_low), displayed as boxes with Fair Value Gap Color and FVG Opacity.
Adjustment Tip: Increase to 0.5-1% for larger, more reliable gaps; decrease to 0.1-0.2% for scalping smaller inefficiencies.
How It Works:
Bullish Reversal OB: Detects a bearish candle followed by a bullish break, marking a potential demand zone.
Bearish Reversal OB: Identifies a bullish candle followed by a bearish break, marking a supply zone.
Continuation OB: Spots strong bullish momentum after a prior high, indicating a continuation zone.
FVG: Highlights bullish gaps where price may retrace to fill.
Entry Signals: Plots triangles (SMC Long Entry) when price retests an OB with a liquidity sweep or break of structure (BOS).
3. Trap Inputs
This section detects potential bull and bear traps based on price action, volume, and key level rejections.
Min Down Move for Bear Trap (%) (Default: 1.0%)
Sets the minimum drop required after a bearish OB to qualify as a trap.
Visualized with Bear Trap Color, Bear Trap Opacity, and blinking borders.
Adjustment Tip: Increase to 2-3% for stronger traps in trending markets; lower to 0.5% for ranging conditions.
Min Up Move for Bull Trap (%) (Default: 1.0%)
Sets the minimum rise required after a bullish OB to flag a trap.
Customizable with Bull Trap Color, Bull Trap Border Thickness, etc.
Adjustment Tip: Adjust similarly to bear traps based on market volatility.
Volume Lookback for Traps (Default: 5 bars)
Compares current volume to a moving average (avg_volume) to filter low-volume traps.
Adjustment Tip: Increase to 10-20 for confirmation on higher timeframes; reduce to 3 for intraday sensitivity.
How It Works:
Bear Trap: Triggers when price drops significantly after a bearish OB but reverses up with low volume or support rejection.
Bull Trap: Activates when price rises after a bullish OB but fails with low volume or resistance rejection.
Boxes highlight trap zones, resetting when price breaks out.
4. Visual Customization
Line Width (Default: 2)
Adjusts thickness of support/resistance lines.
Tip: Increase to 3-4 for visibility on cluttered charts.
Blink On (Default: Close)
Sets whether OB/FVG borders blink based on Open or Close price interaction.
Tip: Use "Open" for intraday precision; "Close" for confirmed reactions.
Colors and Opacity: Each element (OBs, FVGs, traps, key levels) has customizable colors, opacity (0-100), border thickness (1-5 or 1-7), and blink effects for dynamic visualization.
How to Use SMC+
Setup: Apply the indicator to any chart and adjust inputs based on your timeframe and market.
Key Levels: Watch for price reactions at short, long, extra-long, or daily levels for potential reversals or breakouts.
SMC Signals: Look for entry signals (triangles) near OBs or FVGs, confirmed by liquidity sweeps or BOS.
Traps: Avoid false breakouts by monitoring trap boxes, especially near key levels with low volume.
Notes:
This indicator is a visual aid and does not guarantee trading success. Combine it with other analysis tools and risk management strategies.
Performance may vary across markets and timeframes; test settings thoroughly before use.
For optimal results, experiment with lookback periods and sensitivity settings to match your trading style.
The default settings are optimal for 1 minute and 10 second time frames for small cap low float stocks.
Continuation OB are Blue.
Bullish Reversal OB color is Green
Bearish Reversal OB color is Red
FVG color is purple
Bear Trap OB is red with a green border and often appears with a Bearish Reversal OB signaling caution to a short position.
Bull trap OB is green with a Red border signaling caution to a long position.
All active OB area are highlighted and solid in color while other non active OB area are dimmed.
My personal favorite setups are when we have an active bullish reversal with an active FVG along with an active Continuation OB.
Another personal favorite is the Bearish reversal OB signaling an end to a recent uptrend.
The Trap OB detection are also a unique and Original helpful source of information.
The OB have a white boarder by default that are colored black giving a simulated blinking effect when price is acting in that zone.
The Trap OB border are colored with respect to direction of intended trap, all of which can be customized to personal style.
All vaild OB zones are shown compact in size ,a unique and original view until its no longer valid.
Cari dalam skrip untuk "charts"

Austin MTF EMA Entry PointsAustin MTF EMA Entry Points
Overview
The Austin MTF EMA Entry Points is a custom TradingView indicator designed to assist traders in identifying high-probability entry points by combining multiple time frame (MTF) analysis. It leverages exponential moving averages (EMAs) from the daily, 1-hour, and 15-minute charts to generate buy and sell signals that align with the overall trend.
This indicator is ideal for traders who:
Want to trade in the direction of the broader daily trend.
Seek precise entry points on lower time frames (1H and 15M).
Prefer using EMAs as their main trend-following tool.
How It Works
Daily Trend Filter:
The indicator calculates the 50 EMA on the daily chart.
The daily EMA acts as the primary trend filter:
If the current price is above the daily 50 EMA, the trend is bullish.
If the current price is below the daily 50 EMA, the trend is bearish.
Lower Time Frame Entry Points:
The indicator calculates the 20 EMA on both the 1-hour (1H) and 15-minute (15M) time frames.
Buy and sell signals are generated when the price aligns with the trend on all three time frames:
Buy Signal: Price is above the daily 50 EMA and also above the 20 EMA on both the 1H and 15M charts.
Sell Signal: Price is below the daily 50 EMA and also below the 20 EMA on both the 1H and 15M charts.
Visual and Alert Features:
Plot Lines:
The daily 50 EMA is plotted in yellow for easy identification of the main trend.
The 20 EMA from the 1H chart is plotted in blue, and the 15M chart's EMA is in purple for comparison.
Buy/Sell Markers:
Green "Up" arrows appear for buy signals.
Red "Down" arrows appear for sell signals.
Alerts:
Alerts notify users when a buy or sell signal is triggered, making it easier to act on trading opportunities in real-time.
How to Use the Indicator
Identify the Main Trend:
Check the relationship between the price and the daily 50 EMA (yellow line):
Only look for buy signals if the price is above the daily 50 EMA.
Only look for sell signals if the price is below the daily 50 EMA.
Wait for Lower Time Frame Alignment:
For a valid signal, ensure that the price is also above or below the 20 EMA (blue and purple lines) on both the 1H and 15M time frames:
This alignment confirms short-term momentum in the same direction as the daily trend.
Act on Signals:
Use the arrows as visual cues for entry points:
Enter long trades on green "Up" arrows.
Enter short trades on red "Down" arrows.
The alerts will notify you of these signals, so you don’t have to monitor the chart constantly.
Exit Strategy:
Use your preferred stop-loss, take-profit, or trailing stop strategy.
You can also exit trades if the price crosses back below/above the daily 50 EMA, signaling a potential reversal.
Use Cases
Swing Traders: Use the daily trend filter to trade in the direction of the dominant trend, while using 1H and 15M signals to fine-tune entries.
Day Traders: Leverage the 1H and 15M time frames to capitalize on short-term momentum while respecting the broader daily trend.
Position Traders: Monitor the indicator to determine potential reversals or significant alignment across time frames.
Customizable Inputs
The indicator includes the following inputs:
Daily EMA Length: Default is 50. Adjust this to change the length of the trend filter EMA.
Lower Time Frame EMA Length: Default is 20. Adjust this to change the short-term EMA for the 1H and 15M charts.
Time Frames: Hardcoded to "D", "60", and "15", but you can modify the script for different time frames if needed.
Example Scenarios
Buy Signal:
Price is above the daily 50 EMA.
Price crosses above the 20 EMA on both the 1H and 15M time frames.
A green "Up" arrow is displayed, and an alert is triggered.
Sell Signal:
Price is below the daily 50 EMA.
Price crosses below the 20 EMA on both the 1H and 15M time frames.
A red "Down" arrow is displayed, and an alert is triggered.
Strengths and Limitations
Strengths:
Aligns trades with the higher time frame trend for increased probability.
Uses multiple time frame analysis to identify precise entry points.
Visual signals and alerts make it easy to use in real-time.
Limitations:
May produce fewer signals in choppy or ranging markets.
Requires discipline to avoid overtrading when conditions are unclear.
Lag in EMAs could result in late entries in fast-moving markets.
Final Notes
The Austin MTF EMA Entry Points indicator is a powerful tool for traders who value multiple time frame alignment and trend-following strategies. While it simplifies decision-making, it is always recommended to backtest and practice proper risk management before using it in live markets.
Try it out and make smarter, trend-aligned trades today! 🚀

Structure Pilot Vision [Wang Indicators]Built and refined with Dave Teaches, the HTF Vision Pro supercharges the trader, providing them with the tools to approach price with a layered analysis.
Providing the trader the instruments to put on the spotlight significant zones to anticipate price deliveries
HTF CANDLE VISION
Displays up to 3 series of HTF Candles
Shows candlesticks from a higher time frame (e.g., daily, 4-hour, weekly) on a lower time frame chart (e.g., 1-hour, 15-minute). This allows traders to simultaneously observe both short-term and long-term market dynamics.
Customizable Time Frames: Users can select any higher time frame to overlay on the current chart. Common time frames include daily, weekly, and monthly candles, but other custom time frames can also be used.
Color Coding: The HTF candles are color-coded for easy differentiation from the lower time frame candles. Users can customize colors to suit their preferences.
Open, High, Low, Close (OHLC) Representation: The indicator displays the full candlestick pattern for the chosen HTF, including the open, high, low, and close values. This helps traders easily identify key price levels and trends.
Settings :
Number of candles
Space between the chart and the HTF candles
Space between candles sets
Size : from Tiny (2x regular candle size) to Large (x8 regular candle size)
Space between candles
Colors of candles, borders and wicks
Incorporating a Higher Time Frame (HTF) candle into your Lower Time Frame (LTF) chart can be immensely beneficial for traders looking to enhance their analysis and decision-making process.
Use Cases for HTF Candles on LTF Charts:
Trend Confirmation:
Use Case: A trader might be looking at a 15-minute chart (LTF) but wants to confirm if the short-term trends align with the daily trend (HTF). Plotting a daily candle on the 15-minute chart helps visualize whether the short-term movements are part of a broader, longer-term trend.
Support and Resistance Identification:
Use Case: By plotting a weekly candle on a daily chart, traders can quickly identify levels that have acted as significant support or resistance in the past on the higher time frame, which might not be as visible or influential on the daily chart alone.
Entry and Exit Points Enhancement:
Use Case: When preparing to enter a trade based on a 1-hour chart, overlaying a 4-hour candle can provide insights into potential reversal points or continuation patterns that are more significant on the higher time frame, thus refining entry and exit strategies.
Volatility and Breakout Analysis:
Use Case: Seeing how a single HTF candle (like a monthly candle on a weekly chart) closes can give traders an idea of the market's volatility or the strength behind breakouts. A long wick on the HTF candle might suggest a rejected breakout or a potential reversal.
Risk Management:
Use Case: Using an HTF candle can help set more informed stop-loss levels. For instance, if a trader uses a 4-hour candle on a 1-hour chart, they might place their stop-loss just beyond the low of the HTF candle, assuming this represents a significant level of support or resistance.
Contextual Trading Decisions:
Use Case: For scalpers or day traders, understanding where the current price action sits within the context of a higher timeframe can lead to better decision-making. For instance, trading within an HTF consolidation range might suggest less aggressive moves, while being near the top or bottom of such a range might indicate potential for larger movements.
Market Sentiment Analysis:
Use Case: The color (red for bearish, green for bullish) and size of the HTF candle can give a quick visual cue of the market sentiment over that period, helping traders assess whether they are going with or against the broader market flow.
Swing Trading:
Use Case: Swing traders might plot a weekly candle on a daily chart to align their trades with the direction of the weekly trend, ensuring they're not fighting the broader market momentum.
Educational and Visual Reference:
Use Case: For educational purposes, having an HTF candle overlay can serve as a visual reminder for students or new traders about how price movements on different time frames can influence each other, aiding in teaching concepts like "the trend is your friend."
Wang use cases :
The way it is intended to be used is as follow
If you trade the 1 min chart and have a set of 5 min HTF candles plotted on your charts it could be used as follow :
As long as the 5 min keep providing close below the last 5 min candle if you're short you're safe ... if the 5 min candle stop closing below the last ones and start giving up-close you should consider closing your trade
Another use of HTF Candle is to find fractals responsible (up or down internal mouv before the breakout that creates a new zone). This fractal acts as supply and demand zone responsible for maintening the trend or for a reversal.
See examples below :
These fractals are interesting zones because they often cause the price to react, so following a flip in the fractal, you can take a short in bearish zones and a long in bullish zones. Fractals are easier to detect thanks to the HTF candles function, and allow you to enter positions with greater confidence. They can be used in the same way as the 70%, 50% and 30% interest zones, or they can be used simultaneously.
Use with zones :
▫️ VERTICAL BARS VISION ▫️
The vertical bars provide a view of market fractality: on a low time frame chart, they show the size of a candle in a higher time frame, and thus give a better understanding of the price fractality essential to the strategy we use.
Example :
For your information, when you modify data in the vertical bars or HTF candles parameters, the two are synchronized automatically.
The Vertical HTF Candle Closures Indicator is a simple yet effective tool that helps traders visually track the closing times of higher time frame (HTF) candles (such as 4H, 1H, 15M) on a lower time frame chart (e.g., 1-minute).
This feature plots vertical lines on the chart at the exact closure time of each selected HTF, allowing traders to quickly recognize key moments when the HTF candles close, or better yet when we trade above / below the last one and reverse ''sweepy sweepy'' .
Its more like a vertical and more micro visualisation than the HTF Candles.
Wang usage :
its a great tool to be able to reverse engineer what's in a HTFcandle precisely its a good combination with HTF candle projections to train the eyes of the traders about Whats is inside a candle that formed on the higher time frame
Limitation & know issues :
The chart may become cluttered with too many lines if multiple time frames are selected. Adjusting the line style or disabling certain time frames can help reduce visual noise.
On low time frame (<30s), some bar may notshow exactly on time (e.g : in 10sec timeframe, the 15min bar can be displayed at 01:15:10 instead of 01:15:00).
Because of the data provider and the interpreter of Trading View, if there is not data for a candle, Trading view just "skip" the candle. Sometime, those skip are on the candle that goes to 15min, 1 hour or 4 hour. As this is a Trading View issue. There is pretty much nothing we can do.
Some users may experience vertical bars at 1am, 5am, 9am ... instead of 0am, 4am, 8am ... That is because of the difference between the Timezone set on the chart and the timezone of the market they trade. Vertical bar will always refer to the symbol displayed

3-Bar (Outside Bar) Scanner with Table Display# 3-Bar (Outside Bar) Scanner with Table Display
## Overview
The **3-Bar (Outside Bar) Scanner with Table Display** is a custom TradingView indicator designed for traders who utilize **The Strat** methodology. This indicator scans for **3-bar (Outside Bar)** patterns across multiple symbols and displays the results in a convenient table format directly on your chart.
## Purpose
- **Efficient Multi-Symbol Scanning**: Monitor up to four symbols simultaneously for 3-bar patterns without the need to switch between charts.
- **Real-Time Updates**: The table dynamically updates with new price data, providing immediate insights into potential trading opportunities.
- **Visual Clarity**: Displays whether a 3-bar is bullish ("3 Up") or bearish ("3 Down"), helping you quickly interpret market sentiment.
## How It Works
- **Data Retrieval**: The indicator uses `request.security()` to fetch high, low, open, and close prices for the specified symbols and timeframe.
- **3-Bar Detection**:
- **Outside Bar Criteria**: Checks if the current candle's high is higher than the previous candle's high and the current low is lower than the previous low.
- **Direction Determination**:
- **"3 Up"**: If the candle closes higher than it opens (bullish candle).
- **"3 Down"**: If the candle closes lower than it opens (bearish candle).
- **Table Display**:
- The table shows the **Symbol**, **Timeframe**, and **State** ("3 Up", "3 Down", or blank if no pattern detected).
- Customizable colors and positioning to fit your chart's aesthetics.
## Best Use Cases
- **Rapid Market Analysis**: Ideal for traders needing a quick overview of multiple assets for potential 3-bar setups.
- **Strategic Decision-Making**: Helps identify key reversal or continuation patterns in alignment with **The Strat** principles.
- **Scalable Monitoring**: By utilizing TradingView's multi-chart layouts, you can expand monitoring beyond four symbols.
## Instructions for Use
### Adding the Indicator to Your Chart
1. **Copy the Code**: Use the provided Pine Script code for the indicator.
2. **Create a New Indicator**:
- In TradingView, click on **Pine Editor** at the bottom of the platform.
- Paste the code into the editor.
3. **Save and Add to Chart**:
- Click **Save** and give your indicator a name.
- Click **Add to Chart** to apply it.
### Customizing the Inputs
- **Symbols**:
- **Symbol 1**: Leave blank to use the current chart's symbol or enter a specific symbol (e.g., `AAPL`).
- **Symbol 2 to Symbol 4**: Enter additional symbols or leave them blank.
- **Timeframe**: Select your desired timeframe (e.g., `D` for Daily, `60` for 60-minute).
- **Table Colors**:
- Customize header and data colors for better visibility against your chart background.
### Interpreting the Table
- **Symbol**: Displays the symbol without the exchange prefix for clarity.
- **Timeframe**: Shows the timeframe applied to the analysis.
- **State**:
- **"3 Up"**: A bullish outside bar where the candle closed higher than it opened.
- **"3 Down"**: A bearish outside bar where the candle closed lower than it opened.
- **Blank**: No 3-bar pattern detected on the latest candle.
### Monitoring More Than Four Symbols
- **Multi-Chart Layout**:
- Use TradingView's multi-chart feature to display multiple charts within a single workspace.
- Apply the indicator to each chart. For example:
- **Four-Chart Grid**: Monitor up to 16 symbols by setting up four charts, each with the indicator tracking four symbols.
- **Steps**:
1. Arrange your workspace into a multi-chart layout.
2. Add the indicator to each chart.
3. Input different symbols into the indicator on each chart.
## Example Usage
Suppose you want to monitor the following symbols on a Daily timeframe:
- **Symbol 1**: *(Leave blank to use the current chart's symbol, e.g., `SPY`)*
- **Symbol 2**: `AAPL`
- **Symbol 3**: `TSLA`
- **Symbol 4**: `AMZN`
After adding the indicator and entering these symbols:
- **SPY**: The table shows "3 Up" in the State column, indicating a bullish outside bar.
- **AAPL**: No 3-bar pattern detected; the State column is blank.
- **TSLA**: The table shows "3 Down," indicating a bearish outside bar.
- **AMZN**: The table shows "3 Up," indicating another bullish outside bar.
This setup allows you to quickly assess which symbols are exhibiting significant patterns that may warrant further analysis or action.
## Notes
- **Customization**: Feel free to adjust the table's position and colors to suit your preferences.
- **Limitations**:
- Be aware of TradingView's limitations on `request.security()` calls, which may vary based on your subscription plan.
- The indicator is designed to monitor up to four symbols per instance due to these limitations.
- **Scalability**:
- By using multi-chart layouts, you can effectively monitor more symbols without overloading a single chart.
- This approach allows you to scale up your monitoring capabilities to fit your trading strategy.
## Conclusion
The **3-Bar (Outside Bar) Scanner with Table Display** is a valuable tool for traders who utilize **The Strat** methodology. It streamlines the process of identifying key 3-bar patterns across multiple symbols and timeframes, enhancing your ability to make informed trading decisions quickly.
By integrating this indicator into your trading routine, you can:
- Stay alert to significant market movements.
- Reduce the time spent manually scanning charts.
- Increase efficiency in executing your trading strategy.
---
Feel free to share this indicator with the Strat community. Feedback and suggestions are welcome to further enhance its functionality. Happy trading!

Forex Macro Metrics [MacroGlide]"Forex Macro Metrics " is a powerful tool for analyzing macroeconomic metrics, designed to help traders make more informed decisions in the forex market. This indicator displays key economic indicators such as interest rates, money supply (M1 and M2), unemployment rate, and government debt for various currencies and their pairs, allowing users to assess the macroeconomic differences between the base and quote currencies.
Key Features:
• Interest Rates Display: Includes interest rates for major world currencies with the ability to show the differential between the base and quote currencies.
• Money Supply Analysis (M1 and M2): Displays the money supply for both the base and quote currencies, including differential calculations.
• Unemployment Rate: Compares the unemployment rates between currencies, showing the differences on the chart.
• Government Debt: Shows government debt levels for the base and quote currencies with differential calculations.
• Customizable Options: Enable/disable specific metrics and adjust colors for better visual clarity.
How to Use:
• Select a Currency Pair: Apply the indicator to your chart and choose the desired currency pair. The indicator will automatically load the relevant data for the base and quote currencies.
• Adjust Display Settings: Use the indicator settings to enable or disable specific metrics and their differentials.
• Analyze the Data: Compare the economic conditions of the two currencies through the charts and identify potential trading opportunities based on macroeconomic differences.
Methodology:
The indicator uses economic data available through TradingView tickers to calculate the values of the base and quote currencies. Differentials are calculated by subtracting the values of the quote currency from the base currency, allowing for a visual assessment of their differences. The displayed data includes historical changes, helping to identify trends and potential reversal points.
Originality and Usefulness:
"Forex Macro Metrics " is a unique tool that combines several key macroeconomic indicators into one comprehensive indicator. This simplifies the analysis process for traders looking to understand the fundamental differences between currencies. Using this approach provides an advantage in assessing long-term trends and potential shifts in currency pairs driven by changes in macroeconomic conditions.
Charts:
The indicator displays data in the form of lines and areas on the chart, with interest rates shown as lines for the base and quote currencies, accompanied by an area representing the differential. For money supply (M1 and M2), lines are drawn for each currency, with areas highlighting the differences. Similarly, the unemployment rate and government debt are displayed with clear visual separation of the data and their differentials, making it easy to compare and analyze the macroeconomic conditions of the currencies involved.
Enjoy the game!
ICT Watermark | FluxxDescription:
The watermark indicator is designed to enhance the visual presentation of your trading charts by adding customizable watermarks. This tool allows you to overlay essential information, such as ticker symbols, timeframes, dates, and custom text, directly onto your charts. While providing larger text options then all other watermarks currently available.
Key Features:
Customizable Watermarks: Users can enable up to two watermarks with adjustable text content, color, size, and position.
Dynamic Information Display: Option to display real-time symbol and timeframe details, as well as the current date.
Flexible Placement: Watermarks can be positioned at the top, middle, or bottom of the chart, and aligned to the left, center, or right.
Multiple Size Options: Includes a variety of text sizes, making the text larger than any other watermark out there!
Use Cases:
Branding: Add your name or brand to your charts for a personalized touch.
Clarity: Overlay important chart details without obstructing the main content, helping in presentations or shared analysis.
This indicator is original and valuable for traders who seek to enhance the clarity and professionalism of their charts. It is particularly useful for those who create educational content or wish to maintain consistent chart branding.
[SGM Geometric Brownian Motion]Description:
This indicator uses Geometric Brownian Motion (GBM) simulations to predict possible price trajectories of a financial asset. It helps traders visualize potential price movements, assess risks, and make informed decisions.
Geometric Brownian Motion:
Geometric Brownian Motion is an extension of standard Brownian motion (or Wiener process) used to model the random behavior of particles in physics. In finance, this concept is used to model the evolution of asset prices over time in a continuous manner. The basic idea is that the price of an asset does not only change randomly but also exponentially depending on certain parameters.
Basic formula
The formula for the evolution of the price of an asset S(t) under MBG is given by the following stochastic differential equation:
𝑑𝑆(𝑡) = 𝜇𝑆(𝑡)𝑑𝑡 + 𝜎𝑆(𝑡)𝑑𝑊(𝑡)
where:
S(t) is the price of the asset at time
μ is the expected growth rate (or drift).
σ is the volatility of the price of the asset.
dW(t) represents the noise term, i.e. the standard Brownian motion.
Explanations of the terms
Expected growth rate (μ):
This is the expected average return on the asset. If you think your asset will grow by 5% per year,
μ will be 0.05.
Volatility (σ):
It is a measure of the uncertainty or risk associated with the asset. If the asset price varies a lot, σ will be high.
Noise term (dW(t)):
It represents the randomness of the price change, modeled by a Wiener process.
Features:
Customizable number of simulations: Choose the number of price trajectories to simulate to get a better estimate of future movements.
Adjustable simulation length: Set the duration of the simulations in number of periods to adapt the indicator to your trading horizons.
Trajectory display: Visualize the simulated price trajectories directly on the chart to better understand possible future scenarios.
Dispersion calculations: Display the distribution of simulated final prices to assess dispersion and potential variations.
Sharpe ratio distribution: Analyze the risk-adjusted performance of simulations using the Sharpe ratio distribution.
Risk Statistics: Get key risk metrics like maximum drawdown, average return, and Value at Risk (VaR) at different confidence levels.
User Inputs:
Number of Simulations: 200 by default.
Simulation Length: 10 periods by default.
Brownian Motion Transparency: Adjust the transparency of simulated lines for better visualization.
Brownian Motion Display: Enable or disable the display of simulated paths.
Brownian Dispersion Display: Display the distribution of simulated final prices.
Sharpe Dispersion Display: Display the distribution of Sharpe ratios.
Customizable Colors: Choose colors for lines and tables.
Usage:
Configure Settings: Adjust the number of simulations, simulation length, and display preferences to suit your needs.
Analyze Simulated Paths: Simulated path lines appear on the chart, representing possible price developments.
Review Dispersion Charts: Review the charts to understand the distribution of final prices and Sharpe ratios, as well as key risk statistics. This indicator is ideal for traders looking to anticipate future price movements and assess the associated risks. With its detailed simulations and dispersion analyses, it provides valuable insight into the financial markets.
HTF CandlesHTF Candles Indicator (High Time Frame Candles for Low Time Frame Charts)
Overview:
This indicator plots High Time Frame (HTF) candle boxes on Lower Time Frame (LTF) charts. The purpose is to provide traders with a visual representation of (HTF) candlestick movements on a lower timeframe (LTF) within a specified interval.
Usage:
Traders can utilize this indicator to gain insights into HTF candle movements on LTF charts. It helps in identifying the range, direction, and bodies of candles from a higher timeframe perspective.
HTF Candle Box Formation:
The script identifies the start of a new interval on the HTF by monitoring changes in the specified timeframe (Interval).
For each new interval, it records key data points, including the open, high, low, and bar index.
The indicator then uses this information to draw a box on the LTF chart, encapsulating the HTF candle's high and low.
Candle Body Representation:
Users can choose to include the candle body in the box (BodyCandleBox).
If selected, the script draws an additional box representing the HTF candle body, from the open to the previous bar's close.
Color Customization:
Traders can customize box colors for long and short candles on the HTF.
Boxes can be transparent or filled with a specified color.
Multiple Timeframes:
The script supports multiple timeframes simultaneously, allowing traders to overlay HTF candle boxes from different intervals on the same chart.
Configurable options (Interval, Interval1, Interval2) provide flexibility in selecting additional timeframes.
Note:
Understanding the visual representation of HTF candles on LTF charts can aid traders in making more informed decisions, especially when considering the interplay between different timeframes.

Intraday Volatility Bands [Honestcowboy]The Intraday Volatility Bands aims to provide a better alternative to ATR in the calculation of targets or reversal points.
How are they different from ATR based bands?
While ATR and other measures of volatility base their calculations on the previous bars on the chart (for example bars 1954 to 1968). The volatility used in these bands measure expected volatility during that time of the day.
Why would you take this approach?
Markets behave different during certain times of the day, also called sessions.
Here are a couple examples.
Asian Session (generally low volatility)
London Session (bigger volatility starts)
New York Session (overlap of New York with London creates huge volatility)
Generally when using bands or channel type indicators intraday they do not account for the upcoming sessions. On London open price will quickly spike through a bollinger band and it will take some time for the bands to adjust to new volatility.
This script will show expected volatility targets at the start of each new bar and will not adjust during the bar. It already knows what price is expected to do at this time of day.
Script also plots arrows when price breaches either the top or bottom of the bands. You can also set alerts for when this occurs. These are non repainting as the script knows the level at start of the bar and does not change.
🔷 CALCULATION
Think of this script like an ATR but instead it uses past days data instead of previous bars data. Charts below should visualise this more clearly:
The scripts measure of volatility is based on a simple high-low.
The script also counts the number of bars that exist in a day on your current timeframe chart. After knowing that number it creates the matrix used in it's calculations and data storage.
See how it works perfectly on a lower timeframe chart below:
Getting this right was the hardest part, check the coding if you are interested in this type of stuff. I commented every step in the coding process.
🔷 SETTINGS
Every setting of the script has a tooltip but I provided a breakdown here:
Some more examples of different charts:

LNL Trend SystemLNL Trend System is an ATR based day trading system specifically designed for intra-day traders and scalpers. The System works on any chart time frame & can be applied to any market. The study consist of two components - the Trend Line and the Stop Line. Trend System is based on a special ATR calculation that is achieved by combining the previous values of the 13 EMA in relation to the ATR which creates a line of deviations that visually look similar to the basic moving average but actually produce very different results ESPECIALLY in sideways market.
Trend Line:
Trend Line is a simple line which is basically a fast gauge represented by the 13 EMA that can change the color based on the current trend structure defined by multiple averages (8,13,21,34 EMAs). Trend Line is there to simply add the confluence for the current trend. Colors of the line are pretty much self-explanatory. Whenever the line turns red it states that the current structure is bearish. Vice versa for green line. Gray line represents neutral market structure.
Stop Line:
Stop Line is an ATR deviaton line with special calculation based on the previous bar ATRs and position of the price in relation to the current and previous values of 13 EMA. As already stated, this creates an ATR deviation marker either above or below the price that trails the price up or down until they touch. Whenever the price comes into the Stop Line it means it is making an ATR expansion move up or down .This touch will usually resolve into a reaction (a bounce) which provides trade opportunities.
Trend Bars:
When turned ON, Trend Bars can provide additional confulence of the current trend alongside with the Trend Line color. Trend Bars are based on the DMI and ADX indicators. Whenever the DMI is bearish and ADX is above 20 the candles paint themselfs red. And vice versa applies for the green candles and bullish DMI. Whenever the ADX falls below the 20, candles are netural (Gray) which means there is no real trend in place at the moment.
Trend Mode:
There are total of 5 different trend modes available. Each mode is visualizing different ATR settings which provides either aggressive or more conservative approach. The more tigher the mode, the more closer the distance between the price and the Stop Line. First two modes were designed for slower markets, whereas the "Loose" and "FOMC" modes are more suitable for products with high volatility.
Trend Modes:
1. Tight
Ideal for the slowest markets. Slowest market can be any market with unusually small average true range values or just simply a market that does have a personality of a "sleeper". Tight Mode can be also used for aggresive entries in the most ridiculous trends. Sometimes price will barely pullback to the Trend Line not even the Stop Line.
2. Normal
Normal Mode is the golden mean between the modes. "Normal" provides the ideal ATR lengths for the most used markets such as S&P Futures (ES) or SPY, AAPL and plenty of other highly popular stocks. More often than not, the length of this mode is respected considering there is no breaking news or high impact market event scheduled.
3. Loose
The "Loose" mode is basically a normal mode but a little bit more loose. This mode is useful whenever the ATRs jump higher than usual or during the days of highly anticipated news events. This mode is also better suited for more active markets such as NQ futures.
4. FOMC
The FOMC mode is called FOMC for a reason. This mode provides the maximum amount of wiggle room between the price and the Stop Line. This mode was designed for the extreme volatility, breaking news events or post-FOMC trading. If the market quiets down, this mode will not get the Stop Line touch as frequently as othete modes, thus it is not very useful to run this on markets with the average volatlity. Although never properly tested, perhaps the FOMC mode can find its value in the crypto market?
5. The Net
The net mode is basically a combination of all modes into one stop line system which creates "the net" effect. The Net provides the widest Stop Line zone which can be mainly appreciated by traders that like to use scale-in scale-out methods for their trading. Not to mention the visual side of the indicator which looks pretty great with the net mode on.
HTF (Higher Time Frame) Trend System:
The system also includes additional higher time frame (HTF) trend system. This can be set to any time frame by manual HTF mode. HTF mode set to "auto" will automatically choose the best suitable higher time frame trend system based on how appropriate the aggregation is. For everything below 5min the HTF Trend System will stay on 5min. Anything between 5-15min = 30min. 30min - 120min will turn on the 240min. 180min and higher will result in Daily time frame. Anything above the Daily will result in Weekly HTF aggregation, above W = Monthly, above M = Quarterly.
Background Clouds:
In terms of visualization, each trend system is fully customizable through the inputs settings. There is also an option to turn on/off the background clouds behind the stop lines. These clouds can make the charts more clean & visible.
Tips & Tricks:
1. Different Trend Modes
Try out different modes in different markets. There is no one single mode that will fit to everyone on the same type of market. I myself actually prefer more Loose than the Normal.
2. Stop Line Mirroring
Whenever the Stop Lines start to mirror each other (there is one above the price and one below) this means the price is entering a ranging sideways market. It does not matter which Stop Line will the price touch first. They can both be faded until one of them flips.
3. Signs of the Ranging Market
Watch out for signs of ranging market. Whenever the Trend System looses its colors whether on trend line or trend bars, if everything turns neutral (gray) that is usually a solid indication of a range type action for the following moments. Also as already stated before, the Stop Line mirroring is a good sign of the range market.
4. Trailing Tool, Trend System as an Additional Study?
In case you are not a fan of the colorful green / red charts & candles. You can switch all of them off and just leave the Stop Line on. This way you can use the benefits of the trend system and still use other studies on top of that. Similarly as the Parabolic SAR is often used.
5. The Flip Setup
One of my favorite trades is the Flip Setup on the 5min charts. Whenever the Stop Line is broken , the very first opposing touch after the Trend System flips is a usually a highly participated touch. If there is a strong reaction, this means this is likely a beginning of a new trend. Once I am in the position i like to trail the Stop Line on the 1min charts.
Hope it helps.

Historical AverageThis indicator calculates the sum of all past candles for each new candle.
For the second candle of the chart, the indicator shows the average of the first two candles. For the 10th candle, it's the average of the last ten candles.
Simple Moving Averages (SMAa) calculate the average of a specific timeframe (e.g. SMA200 for the last 200 candles). The historical moving average is an SMA 2 at the second candle, an SMA3 for the third candle, an SMA10 for the tenth, an SMA200 for the 200th candle etc.
Settings:
You can set the multiplier to move the Historical Moving Average along the price axis.
You can show two Historical Moving Averages with different multipliers.
You can add fibonacci multipliers to the Historical Moving Average.
This indicator works best on charts with a lot of historical data.
Recommended charts:
INDEX:BTCUSD
BLX
But you can use it e.g. on DJI or any other chart as well.
High Impact NewsDo you have a difficult time remembering high-impact news events throughout the trading week? Now there is an indicator that allows the user to put labels directly on their charts at specific times in the future so news events won’t sneak up on the user.
Description
The “High Impact News” TradingView indicator by Infinity Trading gives the user complete control of three labels that can be set to any time and day of the trading week, even in the future. Each label can be displayed at a specific time, on a unique day of the week, and with custom text. Also, each label has a choice of over 20 emojis to display on the chart along with user-defined text. The text color and size can be independently adjusted.
The position of the labels on the chart can be easily moved up or down with 5 built-in presents: Current Week High, Current Day High, Current Price, Current Day Low, and Current Week Low. Additionally, each label has a separate buffer that allows the users to move the label up or down in increments of five. All of these user-controls ensure the labels are exactly where the user wants them on their charts.
Limitations
This indicator displays labels in the future. TradingView sets a limit of 500 bars/candles in the future you can interact on. This TradingView limit means that labels can only be drawn 500 candles in the future on any timeframe. On larger timeframes this is not a problem and one trading week can easily display any labels. But on smaller timeframes labels multiple days in the future will exceed the 500 candle limit. When a label exceeds the 500 candle limit the indicator will have a temporary error. THIS IS NOT A PROBLEM. Simply go back to a higher timeframe or wait until the label is within 500 candles. All of your Settings will be saved! This is just a limit placed by TradingView that cannot be overwritten.
Important Notice
As stated above, this indicator draws labels in the future on your charts. To achieve future labels, this indicator draws labels in the present and shifts them to the right (which is the future) certain number of bars. Please be aware of the following characteristics of this indicator:
Labels will not appear until after midnight EST on Monday of each trading week
Labels will not appear over the weekends
Labels set to “Monday” won’t appear until midnight EST on Monday (or later)
Labels set to “Tuesday” through “Friday” won’t appear until the time specified in the Settings on Monday. For example, a FOMC label set to 2pm EST on Wednesday will not appear on the chart until 2pm EST on Monday
On 1-Hour or 2-Hour charts, please note that labels with a non-hour time will be shifted slightly so they appear on the chart. For example, a label at 8:15 am on the 5-min chart will be adjusted to 8:00 am on the 1-Hour chart so the label will appear
The above characteristics are a result of having to draw the labels at a specified time (of the trading week) and then calculating how many bars it takes to get the label to the correct time in the future.

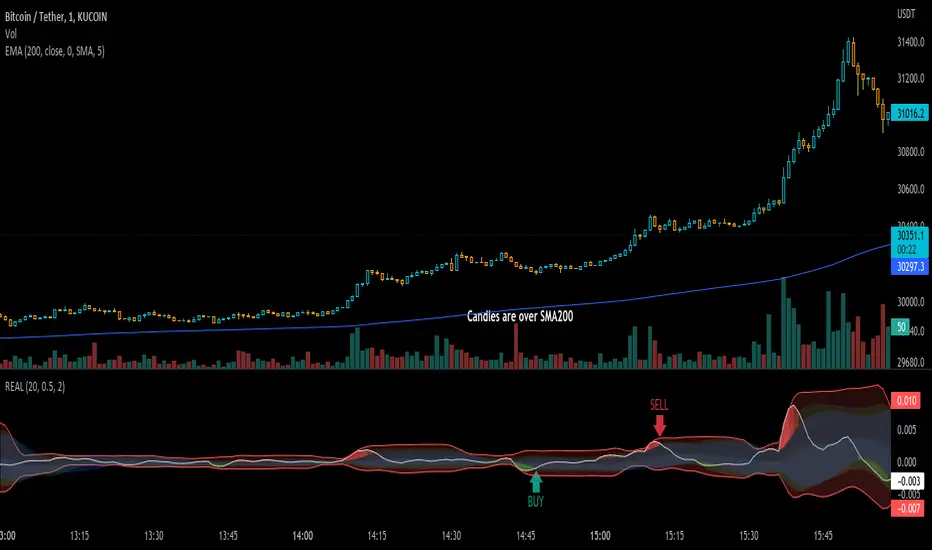
Real IndicatorReal indicator is an indicator to convert ohlcv charts to one oscilator!
there is an effective thing in all charts: "Volume", and I used this thing to mix it by price
Buy: on crossing above to Bollinger-lower-band (on Up-trends)
Sell: on crossing under Bollinger-upper-band (on Down-Trends)
use an SMA-200 to determine trends ;)
Delta Volume Columns Pro [LucF]█ OVERVIEW
This indicator displays volume delta information calculated with intrabar inspection on historical bars, and feed updates when running in realtime. It is designed to run in a pane and can display either stacked buy/sell volume columns or a signal line which can be calculated and displayed in many different ways.
Five different models are offered to reveal different characteristics of the calculated volume delta information. Many options are offered to visualize the calculations, giving you much leeway in morphing the indicator's visuals to suit your needs. If you value delta volume information, I hope you will find the time required to master Delta Volume Columns Pro well worth the investment. I am confident that if you combine a proper understanding of the indicator's information with an intimate knowledge of the volume idiosyncrasies on the markets you trade, you can extract useful market intelligence using this tool.
█ WARNINGS
1. The indicator only works on markets where volume information is available,
Please validate that your symbol's feed carries volume information before asking me why the indicator doesn't plot values.
2. When you refresh your chart or re-execute the script on the chart, the indicator will repaint because elapsed realtime bars will then recalculate as historical bars.
3. Because the indicator uses different modes of calculation on historical and realtime bars, it's critical that you understand the differences between them. Details are provided further down.
4. Calculations using intrabar inspection on historical bars can only be done from some chart timeframes. See further down for a list of supported timeframes.
If the chart's timeframe is not supported, no historical volume delta will display.
█ CONCEPTS
Chart bars
Three different types of bars are used in charts:
1. Historical bars are bars that have already closed when the script executes on them.
2. The realtime bar is the current, incomplete bar where a script is running on an open market. There is only one active realtime bar on your chart at any given time.
The realtime bar is where alerts trigger.
3. Elapsed realtime bars are bars that were calculated when they were realtime bars but have since closed.
When a script re-executes on a chart because the browser tab is refreshed or some of its inputs are changed, elapsed realtime bars are recalculated as historical bars.
Why does this indicator use two modes of calculation?
Historical bars on TradingView charts contain OHLCV data only, which is insufficient to calculate volume delta on them with any level of precision. To mine more detailed information from those bars we look at intrabars , i.e., bars from a smaller timeframe (we call it the intrabar timeframe ) that are contained in one chart bar. If your chart Is running at 1D on a 24x7 market for example, most 1D chart bars will contain 24 underlying 1H bars in their dilation. On historical bars, this indicator looks at those intrabars to amass volume delta information. If the intrabar is up, its volume goes in the Buy bin, and inversely for the Sell bin. When price does not move on an intrabar, the polarity of the last known movement is used to determine in which bin its volume goes.
In realtime, we have access to price and volume change for each update of the chart. Because a 1D chart bar can be updated tens of thousands of times during the day, volume delta calculations on those updates is much more precise. This precision, however, comes at a price:
— The script must be running on the chart for it to keep calculating in realtime.
— If you refresh your chart you will lose all accumulated realtime calculations on elapsed realtime bars, and the realtime bar.
Elapsed realtime bars will recalculate as historical bars, i.e., using intrabar inspection, and the realtime bar's calculations will reset.
When the script recalculates elapsed realtime bars as historical bars, the values on those bars will change, which means the script repaints in those conditions.
— When the indicator first calculates on a chart containing an incomplete realtime bar, it will count ALL the existing volume on the bar as Buy or Sell volume,
depending on the polarity of the bar at that point. This will skew calculations for that first bar. Scripts have no access to the history of a realtime bar's previous updates,
and intrabar inspection cannot be used on realtime bars, so this is the only to go about this.
— Even if alerts only trigger upon confirmation of their conditions after the realtime bar closes, they are repainting alerts
because they would perhaps not have calculated the same way using intrabar inspection.
— On markets like stocks that often have different EOD and intraday feeds and volume information,
the volume's scale may not be the same for the realtime bar if your chart is at 1D, for example,
and the indicator is using an intraday timeframe to calculate on historical bars.
— Any chart timeframe can be used in realtime mode, but plots that include moving averages in their calculations may require many elapsed realtime bars before they can calculate.
You might prefer drastically reducing the periods of the moving averages, or using the volume columns mode, which displays instant values, instead of the line.
Volume Delta Balances
This indicator uses a variety of methods to evaluate five volume delta balances and derive other values from those balances. The five balances are:
1 — On Bar Balance : This is the only balance using instant values; it is simply the subtraction of the Sell volume from the Buy volume on the bar.
2 — Average Balance : Calculates a distinct EMA for both the Buy and Sell volumes, and subtracts the Sell EMA from the Buy EMA.
3 — Momentum Balance : Starts by calculating, separately for both Buy and Sell volumes, the difference between the same EMAs used in "Average Balance" and
an SMA of double the period used for the "Average Balance" EMAs. The difference for the Sell side is subtracted from the difference for the Buy side,
and an RSI of that value is calculated and brought over the −50/+50 scale.
4 — Relative Balance : The reference values used in the calculation are the Buy and Sell EMAs used in the "Average Balance".
From those, we calculate two intermediate values using how much the instant Buy and Sell volumes on the bar exceed their respective EMA — but with a twist.
If the bar's Buy volume does not exceed the EMA of Buy volume, a zero value is used. The same goes for the Sell volume with the EMA of Sell volume.
Once we have our two intermediate values for the Buy and Sell volumes exceeding their respective MA, we subtract them. The final "Relative Balance" value is an ALMA of that subtraction.
The rationale behind using zero values when the bar's Buy/Sell volume does not exceed its EMA is to only take into account the more significant volume.
If both instant volume values exceed their MA, then the difference between the two is the signal's value.
The signal is called "relative" because the intermediate values are the difference between the instant Buy/Sell volumes and their respective MA.
This balance flatlines when the bar's Buy/Sell volumes do not exceed their EMAs, which makes it useful to spot areas where trader interest dwindles, such as consolidations.
The smaller the period of the final value's ALMA, the more easily you will see the balance flatline. These flat zones should be considered no-trade zones.
5 — Percent Balance : This balance is the ALMA of the ratio of the "On Bar Balance" value, i.e., the volume delta balance on the bar (which can be positive or negative),
over the total volume for that bar.
From the balances and marker conditions, two more values are calculated:
1 — Marker Bias : It sums the up/down (+1/‒1) occurrences of the markers 1 to 4 over a period you define, so it ranges from −4 to +4, times the period.
Its calculation will depend on the modes used to calculate markers 3 and 4.
2 — Combined Balances : This is the sum of the bull/bear (+1/−1) states of each of the five balances, so it ranges from −5 to +5.
█ FEATURES
The indicator has two main modes of operation: Columns and Line .
Columns
• In Columns mode you can display stacked Buy/Sell volume columns.
• The buy section always appears above the centerline, the sell section below.
• The top and bottom sections can be colored independently using eight different methods.
• The EMAs of the Buy/Sell values can be displayed (these are the same EMAs used to calculate the "Average Balance").
Line
• Displays one of seven signals: the five balances or one of two complementary values, i.e., the "Marker Bias" or the "Combined Balances".
• You can color the line and its fill using independent calculation modes to pack more information in the display.
You can thus appraise the state of 3 different values using the line itself, its color and the color of its fill.
• A "Divergence Levels" feature will use the line to automatically draw expanding levels on divergence events.
Default settings
Using the indicator's default settings, this is the information displayed:
• The line is calculated on the "Average Balance".
• The line's color is determined by the bull/bear state of the "Percent Balance".
• The line's fill gradient is determined by the advances/declines of the "Momentum Balance".
• The orange divergence dots are calculated using discrepancies between the polarity of the "On Bar Balance" and the chart's bar.
• The divergence levels are determined using the line's level when a divergence occurs.
• The background's fill gradient is calculated on advances/declines of the "Marker Bias".
• The chart bars are colored using advances/declines of the "Relative Balance". Divergences are shown in orange.
• The intrabar timeframe is automatically determined from the chart's timeframe so that a minimum of 50 intrabars are used to calculate volume delta on historical bars.
Alerts
The configuration of the marker conditions explained further is what determines the conditions that will trigger alerts created from this script. Note that simply selecting the display of markers does not create alerts. To create an alert on this script, you must use ALT-A from the chart. You can create multiple alerts triggering on different conditions from this same script; simply configure the markers so they define the trigger conditions for each alert before creating the alert. The configuration of the script's inputs is saved with the alert, so from then on you can change them without affecting the alert. Alert messages will mention the marker(s) that triggered the specific alert event. Keep in mind, when creating alerts on small chart timeframes, that discrepancies between alert triggers and markers displayed on your chart are to be expected. This is because the alert and your chart are running two distinct instances of the indicator on different servers and different feeds. Also keep in mind that while alerts only trigger on confirmed conditions, they are calculated using realtime calculation mode, which entails that if you refresh your chart and elapsed realtime bars recalculate as historical bars using intrabar inspection, markers will not appear in the same places they appeared in realtime. So it's important to understand that even though the alert conditions are confirmed when they trigger, these alerts will repaint.
Let's go through the sections of the script's inputs.
Columns
The size of the Buy/Sell columns always represents their respective importance on the bar, but the coloring mode for tops and bottoms is independent. The default setup uses a standard coloring mode where the Buy/Sell columns are always in the bull/bear color with a higher intensity for the winning side. Seven other coloring modes allow you to pack more information in the columns. When choosing to color the top columns using a bull/bear gradient on "Average Balance", for example, you will have bull/bear colored tops. In order for the color of the bottom columns to continue to show the instant bar balance, you can then choose the "On Bar Balance — Dual Solid Colors" coloring mode to make those bars the color of the winning side for that bar. You can display the averages of the Buy and Sell columns. If you do, its coloring is controlled through the "Line" and "Line fill" sections below.
Line and Line fill
You can select the calculation mode and the thickness of the line, and independent calculations to determine the line's color and fill.
Zero Line
The zero line can display dots when all five balances are bull/bear.
Divergences
You first select the detection mode. Divergences occur whenever the up/down direction of the signal does not match the up/down polarity of the bar. Divergences are used in three components of the indicator's visuals: the orange dot, colored chart bars, and to calculate the divergence levels on the line. The divergence levels are dynamic levels that automatically build from the line's values on divergence events. On consecutive divergences, the levels will expand, creating a channel. This implementation of the divergence levels corresponds to my view that divergences indicate anomalies, hesitations, points of uncertainty if you will. It precludes any attempt to identify a directional bias to divergences. Accordingly, the levels merely take note of divergence events and mark those points in time with levels. Traders then have a reference point from which they can evaluate further movement. The bull/bear/neutral colors used to plot the levels are also congruent with this view in that they are determined by the line's position relative to the levels, which is how I think divergences can be put to the most effective use. One of the coloring modes for the line's fill uses advances/declines in the line after divergence events.
Background
The background can show a bull/bear gradient on six different calculations. As with other gradients, you can adjust its brightness to make its importance proportional to how you use it in your analysis.
Chart bars
Chart bars can be colored using seven different methods. You have the option of emptying the body of bars where volume does not increase, as does my TLD indicator, and you can choose whether you want to show divergences.
Intrabar Timeframe
This is the intrabar timeframe that will be used to calculate volume delta using intrabar inspection on historical bars. You can choose between four modes. The three "Auto-steps" modes calculate, from the chart's timeframe, the intrabar timeframe where the said number of intrabars will make up the dilation of chart bars. Adjustments are made for non-24x7 markets. "Fixed" mode allows you to select the intrabar timeframe you want. Checking the "Show TF" box will display in the lower-right corner the intrabar timeframe used at any given moment. The proper selection of the intrabar timeframe is important. It must achieve maximal granularity to produce precise results while not unduly slowing down calculations, or worse, causing runtime errors. Note that historical depth will vary with the intrabar timeframe. The smaller the timeframe, the shallower historical plots you will be.
Markers
Markers appear when the required condition has been confirmed on a closed bar. The configuration of the markers when you create an alert is what determines when the alert will trigger. Five markers are available:
• Balances Agreement : All five balances are either bullish or bearish.
• Double Bumps : A double bump is two consecutive up/down bars with +/‒ volume delta, and rising Buy/Sell volume above its average.
• Divergence confirmations : A divergence is confirmed up/down when the chosen balance is up/down on the previous bar when that bar was down/up, and this bar is up/down.
• Balance Shifts : These are bull/bear transitions of the selected signal.
• Marker Bias Shifts : Marker bias shifts occur when it crosses into bull/bear territory.
Periods
Allows control over the periods of the different moving averages used to calculate the balances.
Volume Discrepancies
Stock exchanges do not report the same volume for intraday and daily (or higher) resolutions. Other variations in how volume information is reported can also occur in other markets, namely Forex, where volume irregularities can even occur between different intraday timeframes. This will cause discrepancies between the total volume on the bar at the chart's timeframe, and the total volume calculated by adding the volume of the intrabars in that bar's dilation. This does not necessarily invalidate the volume delta information calculated from intrabars, but it tells us that we are using partial volume data. A mechanism to detect chart vs intrabar timeframe volume discrepancies is provided. It allows you to define a threshold percentage above which the background will indicate a difference has been detected.
Other Settings
You can control here the display of the gray dot reminder on realtime bars, and the display of error messages if you are using a chart timeframe that is not greater than the fixed intrabar timeframe, when you use that mode. Disabling the message can be useful if you only use realtime mode at chart timeframes that do not support intrabar inspection.
█ RAMBLINGS
On Volume Delta
Volume is arguably the best complement to interpret price action, and I consider volume delta to be the most effective way of processing volume information. In periods of low-volatility price consolidations, volume will typically also be lower than normal, but slight imbalances in the trend of the buy/sell volume balance can sometimes help put early odds on the direction of the break from consolidation. Additionally, the progression of the volume imbalance can help determine the proximity of the breakout. I also find volume delta and the number of divergences very useful to evaluate the strength of trends. In trends, I am looking for "slow and steady", i.e., relatively low volatility and pauses where price action doesn't look like world affairs are being reassessed. In my personal mythology, this type of trend is often more resilient than high-volatility breakouts, especially when volume balance confirms the general agreement of traders signaled by the low-volatility usually accompanying this type of trend. The volume action on pauses will often help me decide between aggressively taking profits, tightening a stop or going for a longer-term movement. As for reversals, they generally occur in high-volatility areas where entering trades is more expensive and riskier. While the identification of counter-trend reversals fascinates many traders to no end, they represent poor opportunities in my view. Volume imbalances often precede reversals, but I prefer to use volume delta information to identify the areas following reversals where I can confirm them and make relatively low-cost entries with better odds.
On "Buy/Sell" Volume
Buying or selling volume are misnomers, as every unit of volume transacted is both bought and sold by two different traders. While this does not keep me from using the terms, there is no such thing as “buy only” or “sell only” volume. Trader lingo is riddled with peculiarities.
Divergences
The divergence detection method used here relies on a difference between the direction of a signal and the polarity (up/down) of a chart bar. When using the default "On Bar Balance" to detect divergences, however, only the bar's volume delta is used. You may wonder how there can be divergences between buying/selling volume information and price movement on one bar. This will sometimes be due to the calculation's shortcomings, but divergences may also occur in instances where because of order book structure, it takes less volume to increase the price of an asset than it takes to decrease it. As usual, divergences are points of interest because they reveal imbalances, which may or may not become turning points. To your pattern-hungry brain, the divergences displayed by this indicator will — as they do on other indicators — appear to often indicate turnarounds. My opinion is that reality is generally quite sobering and I have no reliable information that would tend to prove otherwise. Exercise caution when using them. Consequently, I do not share the overwhelming enthusiasm of traders in identifying bullish/bearish divergences. For me, the best course of action when a divergence occurs is to wait and see what happens from there. That is the rationale underlying how my divergence levels work; they take note of a signal's level when a divergence occurs, and it's the signal's behavior from that point on that determines if the post-divergence action is bullish/bearish.
Superfluity
In "The Bed of Procrustes", Nassim Nicholas Taleb writes: To bankrupt a fool, give him information . This indicator can display lots of information. While learning to use a new indicator inevitably requires an adaptation period where we put it through its paces and try out all its options, once you have become used to it and decide to adopt it, rigorously eliminate the components you don't use and configure the remaining ones so their visual prominence reflects their relative importance in your analysis. I tried to provide flexible options for traders to control this indicator's visuals for that exact reason — not for window dressing.
█ LIMITATIONS
• This script uses a special characteristic of the `security()` function allowing the inspection of intrabars — which is not officially supported by TradingView.
It has the advantage of permitting a more robust calculation of volume delta than other methods on historical bars, but also has its limits.
• Intrabar inspection only works on some chart timeframes: 3, 5, 10, 15 and 30 minutes, 1, 2, 3, 4, 6, and 12 hours, 1 day, 1 week and 1 month.
The script’s code can be modified to run on other resolutions.
• When the difference between the chart’s timeframe and the intrabar timeframe is too great, runtime errors will occur. The Auto-Steps selection mechanisms should avoid this.
• All volume is not created equally. Its source, components, quality and reliability will vary considerably with sectors and instruments.
The higher the quality, the more reliably volume delta information can be used to guide your decisions.
You should make it your responsibility to understand the volume information provided in the data feeds you use. It will help you make the most of volume delta.
█ NOTES
For traders
• The Data Window shows key values for the indicator.
• While this indicator displays some of the same information calculated in my Delta Volume Columns ,
I have elected to make it a separate publication so that traders continue to have a simpler alternative available to them. Both code bases will continue to evolve separately.
• All gradients used in this indicator determine their brightness intensities using advances/declines in the signal—not their relative position in a pre-determined scale.
• Volume delta being relative, by nature, it is particularly well-suited to Forex markets, as it filters out quite elegantly the cyclical volume data characterizing the sector.
If you are interested in volume delta, consider having a look at my other "Delta Volume" indicators:
• Delta Volume Realtime Action displays realtime volume delta and tick information on the chart.
• Delta Volume Candles builds volume delta candles on the chart.
• Delta Volume Columns is a simpler version of this indicator.
For coders
• I use the `f_c_gradientRelativePro()` from the PineCoders Color Gradient Framework to build my gradients.
This function has the advantage of allowing begin/end colors for both the bull and bear colors. It also allows us to define the number of steps allowed for each gradient.
I use this to modulate the gradients so they perform optimally on the combination of the signal used to calculate advances/declines,
but also the nature of the visual component the gradient applies to. I use fewer steps for choppy signals and when the gradient is used on discrete visual components
such as volume columns or chart bars.
• I use the PineCoders Coding Conventions for Pine to write my scripts.
• I used functions modified from the PineCoders MTF Selection Framework for the selection of timeframes.
█ THANKS TO:
— The devs from TradingView's Pine and other teams, and the PineCoders who collaborate with them. They are doing amazing work,
and much of what this indicator does could not be done without their recent improvements to Pine.
— A guy called Kuan who commented on a Backtest Rookies presentation of their Volume Profile indicator using a `for` loop.
This indicator started from the intrabar inspection technique illustrated in Kuan's snippet.
— theheirophant , my partner in the exploration of the sometimes weird abysses of `security()`’s behavior at intrabar timeframes.
— midtownsk8rguy , my brilliant companion in mining the depths of Pine graphics.

Market State Intelligence [Interakktive]Market State Intelligence (MSI) is a diagnostic market-context indicator that reveals how the market is behaving — not where price "should" go.
MSI does not generate buy/sell signals. Instead, it classifies market conditions into clear behavioural regimes by continuously measuring:
- DRIVE (directional effort)
- OPPOSITION (absorption / resistance)
- STABILITY (structural persistence)
MSI is designed to answer three practical questions:
- What state is the market in right now?
- Is energy building, releasing, or decaying?
- Is participation aligned with price, or opposing it?
█ WHAT MSI DOES
MSI operates as a real-time regime classification engine that processes each closed bar through three independent measurement systems:
DRIVE — Directional Effort (0–100)
- Displacement efficiency (net progress vs total path)
- Range expansion quality (actual range vs expected ATR range)
- Body dominance (body vs candle range)
OPPOSITION — Absorption / Resistance (0–100)
- Wick pressure (rejection relative to attempt)
- Effort–result gap (high effort, low progress)
- Reversal density (counter-moves frequency)
STABILITY — Persistence (0–100)
- Condition persistence (how long conditions hold)
- Variance score (flip frequency)
- Follow-through consistency (reaction continuity)
These three forces feed a deterministic classifier with hysteresis (anti-flicker) to identify five regimes:
COMPRESSION — low drive, low opposition, higher stability (pressure building, direction unclear)
EXPANSION — high drive, low opposition (directional energy release)
TREND — medium-high drive, higher stability, low-medium opposition (healthy continuation)
DISTRIBUTION — medium drive, high opposition (effort absorbed; progress blocked)
TRANSITION — rapidly rising opposition, low stability (regime breakdown / uncertainty)
█ WHAT MSI DOES NOT DO
- No buy/sell signals, entries/exits, or performance claims
- No prediction of future direction
- No repainting: calculations use closed-bar data only
MSI is a market state layer intended to support your execution framework.
█ VISUAL SYSTEM
MSI uses a layered visual grammar designed to remain readable on live charts:
Regime Ribbon
A thin horizontal band showing the current regime via colour. Ribbon opacity reflects regime confidence (stronger confidence = more visible).
Pressure Envelope (core visual)
A soft corridor around price that expands with Drive and becomes more visible as Opposition increases. This visualises "pressure thickness" around current action (not a volatility band for entries).
Structural Memory
Faint background stains appear where regimes previously failed (e.g., expansion collapsing into absorption). These are behavioural context zones showing where market intention was rejected — not support/resistance.
Regime Change Markers (optional)
Subtle labels appear when regimes transition after confirmation. Useful for replay and education.
Effort Halo (optional)
Candle highlighting when Opposition materially exceeds Drive, indicating absorption/inefficiency.
█ HUD PANEL
The HUD displays:
- Current regime name + colour indicator
- A context gate showing whether conditions are aligned with long-bias or short-bias context (not an entry/exit system)
█ REGIME LEGEND
When enabled, displays:
- A one-line definition of the current regime
- Live Drive / Opposition / Stability values for interpretation
█ TIME-TO-DECISION METER
A visual pressure gauge that tends to fill during Compression (energy building) and drain during Expansion (energy releasing). It is a state-tracking meter, not a timing tool.
█ SETTINGS
MSI — Settings
- Preset Mode: Scalper / Swing / Position
- Analysis Mode (Minimal): ON = subtle visuals, OFF = full intensity
- Regime Ribbon, Structural Memory, HUD Panel, Time-to-Decision Meter, Effort Halo
MSI — Visual Options
- Show Regime Changes: Labels when regime transitions occur
- Show Regime Legend: Definition and live values display
- Panel Position: Move the entire panel anywhere on chart
MSI — Advanced (Tuning)
- Sensitivity (0.5–2.0)
- Smoothing (0.5–2.0)
- Memory Decay (0.5–2.0)
- Visual Intensity (Low / Medium / High)
█ PRESETS EXPLAINED
Scalper
Higher sensitivity + lower smoothing + faster memory decay. Best for 1m–15m monitoring.
Swing (default)
Balanced behaviour. Best for 15m–4H analysis.
Position
Lower sensitivity + higher smoothing + slower memory decay. Best for 4H–1D macro context.
█ STRUCTURAL MEMORY
When a regime fails (example: Expansion → Distribution), MSI creates a memory imprint:
- Fixed stain window (preset dependent)
- Strength decays over time
- Limited to a maximum number of imprints to reduce chart clutter
These zones represent behavioural rejection, not levels.
█ SUITABLE MARKETS
MSI is designed for Forex, Crypto, Indices, Stocks, and Commodities.
Works from intraday to Daily, with particularly strong readability on 15m–4H.
█ DISCLAIMER
This indicator is for educational and informational purposes only. It does not constitute financial advice, trading recommendations, or solicitation. Trading involves substantial risk. Always use proper risk management and make independent decisions.

XAU Seasonality + Setup Quality + Month Strength | WarRoomXYZXAU Seasonality Engine is a technical analysis indicator developed for the study of recurring, calendar-based behavior on XAUUSD (Gold).
The tool blends month-of-year seasonality statistics with higher-timeframe context and a setup-quality gate to help users observe when market conditions historically lean strong, weak, or neutral — and how strict trade selection should be during each regime.
Indicator Concept
An indicator for XAUUSD that combines:
1. Seasonality Regime (Month-of-Year Bias)
► Classifies the current month as Strong / Weak / Neutral based on either:
• Preset months (user-defined)
or
• Auto mode (computed from historical monthly performance)
► Strong months suggest a bullish tailwind (not a signal).
► Weak months suggest headwind / caution and require stricter setup quality.
2. Monthly Performance Engine (Under the Hood)
► Uses the symbol’s monthly timeframe data to compute, per calendar month:
• Average monthly return (%)
• Win rate (%) — how often that month closes positive
• Month Strength Score (0–100) — a blended score derived from performance data
► The score is designed to provide a relative strength snapshot of seasonality by month.
3. Month Strength Histogram
► Plots a histogram (0–100) of the current month’s strength score.
• Higher bars = historically stronger month tendency
• Lower bars = historically weaker month tendency
► Optional horizontal reference lines mark “strong” and “weak” zones to make regimes obvious at a glance.
4. Setup Quality Meter (Confluence Filter)
► The indicator calculates a Setup Quality Score (0–100) using market structure and momentum components, such as:
• EMA trend alignment
• Momentum confirmation (EMA fast vs slow)
• Structure break confirmation (BOS)
• Liquidity sweep behavior
• Candle confirmation logic
► This score is intended as a trade-selectivity filter , not a trade executor.
5. Adaptive Rules for Weak Months (Strict Mode)
► When the indicator detects a weak seasonal regime, conditions automatically tighten:
• The A+ threshold increases (adaptive thresholding)
• Optional rule: Weak months require BOS + Sweep + FVG simultaneously before any A+ condition is considered valid
This forces the user into “higher-quality-only” behavior during historically weaker seasonal periods.
🔹1 Visual Components Included
• Seasonality regime label (Strong / Weak / Neutral)
• Optional background shading based on regime
• Month Strength Score histogram (0–100)
• Current month stats: Avg return + win rate
• Setup Quality Meter value (0–100)
• Adaptive A+ threshold display
• Weak-month confluence gate status (BOS / Sweep / FVG pass/fail)
• Optional alerts when strict criteria are met
➣What Means in the XAU Indicator
🔹 Definition (in THIS indicator)
Win Rate = the percentage of historical months that closed positive for the same calendar month.
It is NOT:
trade win rate ❌
signal accuracy ❌
It is a s tatistical seasonality metric .
How It’s Calculated
For each calendar month (January, February, etc.), the indicator:
1.Looks at historical monthly candles (Monthly timeframe).
2. Counts how many times that month:
•Closed higher than it opened (or higher than previous month close).
3. Divides:
Number of positive months
÷
Total number of observed months
× 100
Example: September
If over the last 20 years:
September closed green 14 times
September closed red 6 times
Then:
Win Rate = (14 / 20) × 100 = 70%
That’s what you see as in the dashboard.
What the Win Rate Is Used For
1️⃣ Part of the Month Strength Score
The indicator blends:
•Average Monthly Return (%) → measures magnitude
•Win Rate (%) → measures consistency
Combined into:
Month Strength Score (0–100)
This avoids a common trap:
•A month with 1 huge rally but many losses ≠ reliable
•A month with steady positive closes = higher quality environment
What Win Rate Tells You
High Win Rate (e.g. 65–75%)
•Gold more often closes higher in this month
•Continuation is statistically more likely
•Pullbacks are more likely to resolve in trend direction
Low Win Rate (e.g. 35–45%)
•Gold more often fails to close higher
•More chop, deeper retracements, false breakouts
•Continuation trades statistically struggle
What It Does NOT Tell You
🚫 It does NOT mean:
•“You will win 70% of your trades”
•“Every setup in this month works”
•“Direction is guaranteed”
Seasonality is context, not prediction.
Why This Is Powerful When Combined With Your System
On its own, win rate is just data.
But in your indicator, it’s used to:
•🔒 Raise the A+ threshold in weak months
•🧠 Force BOS + Sweep + FVG confluence
•❌ Block marginal setups automatically
So instead of guessing:
-“Why is gold so choppy this month?”
You know:
-“This month historically underperforms SO I must be stricter.”
➣What Means in the XAU Seasonality Indicator
🔹 Definition (in THIS indicator)
Avg Monthly Return = the average percentage gain or loss of XAUUSD for a specific calendar month, calculated across many years.
It measures magnitude , not frequency.
It is NOT:
•trade profit ❌
•expected return for the next month ❌
•guaranteed performance ❌
It is a historical seasonality tendency.
How It’s Calculated
For each calendar month (January, February, etc.), the indicator:
1.Takes every historical occurrence of that month.
2.Calculates the percentage change of the monthly candle:
(Monthly Close − Previous Monthly Close)
÷ Previous Monthly Close × 100
3. Adds all those percentage changes together.
4. Divides by the total number of observations.
Example: September
Assume over 20 years:
+2.4%, +1.1%, −0.6%, +3.0%, +1.8%, ...
If the sum of all September returns = +28% across 20 years:
Avg Monthly Return = +1.40%
That’s the number displayed in the indicator.
What Avg Monthly Return Is Used For
1️⃣ Measuring Strength of Movement
•Win Rate → “How often does it close green?”
•Avg Monthly Return → “How big are the moves when it works?”
Both are needed.
A month can:
•Win often but move very little
•Move a lot but only occasionally
The indicator combines both to avoid misleading conclusions.
How to Interpret Avg Monthly Return
Positive Avg Return (e.g. +0.8% to +2.0%)
•Gold tends to expand during this month
•Continuation phases are more likely
•Pullbacks are often absorbed
Near-Zero Avg Return (e.g. −0.2% to +0.2%)
•Market is statistically balanced
•Expect chop, rotations, false breaks
•Continuation is less reliable
Negative Avg Return (e.g. −0.5% or worse)
•Downward pressure or heavy mean reversion
•Rallies often fade
•Risk of aggressive stop hunts
What Avg Monthly Return Does NOT Mean
🚫 It does NOT mean:
•“Price will move +1.4% this month”
•“You should buy because the number is positive”
•“This is a guaranteed edge”
It describes historical behavior, not future certainty.
Why Avg Monthly Return Matters More Than People Think
Two months can have the same win rate but behave very differently:
Example:
Month Win Rate Avg Return Reality
Month A 65% +0.2% Small, choppy wins
Month B 55% +1.6% Fewer wins, but strong expansions
Your indicator would rank Month B as stronger, which is correct for continuation-based strategies.
How It Feeds the Month Strength Score
The indicator blends:
•60% Avg Monthly Return (normalized)
•40% Win Rate
This means:
•Big moves matter more than small consistency
•But consistency still matters enough to prevent distortion
Result:
Month Strength Score (0–100)
Which is then used to:
•tighten or relax A+ thresholds
•activate weak-month strict rules
•control trade frequency
🔹2. Intended Use
The indicator is designed as a discretionary analysis tool to support study of:
• seasonal bias and calendar tendencies
• relative strength/weakness across months
• how strict trade selection should be across different regimes
• confluence behavior when seasonal conditions are unfavorable
The tool does not generate forecasts, does not guarantee outcomes, and should not be relied upon as a stand-alone decision mechanism.
🔹3.How to Use XAU Seasonality Engine
Recommended charts: XAUUSD, intraday (5m–15m) with a HTF context (1H–4H).
1. Identify the Seasonal Regime
• Strong month → you can allow more continuation bias (still require structure).
• Neutral month → trade normally, standard criteria.
• Weak month → tighten selection, demand clean A+ conditions only.
2. Read the Month Strength Histogram
• If the score is high (e.g., 70+), the month has historically shown stronger tendency.
• If the score is low (e.g., 40 and below), expect slower conditions, deeper pullbacks, or more chop — and reduce marginal trades.
3. Use the Setup Quality Meter as the Gate
► In normal/strong months:
• A+ threshold is moderate (e.g., 70)
► In weak months:
• A+ threshold is higher (e.g., 80+)
• Optional strict mode: must also pass BOS + Sweep + FVG alignment
4. Example Trade Logic (Framework, Not Signals)
► Bullish framework in a Strong Month:
• Seasonal regime = Strong (tailwind)
• Structure supports bullish continuation (trend alignment)
• Sweep occurs into demand / liquidity grab
• Setup Quality reaches A+ threshold
• Entry: confirmation candle or retrace to key level
• SL: beyond sweep low / invalidation
• TP: nearest liquidity / prior highs / HTF level
► Weak Month rule-set (Strict Mode):
• Seasonal regime = Weak (headwind)
• Only consider trades if:
✅ BOS confirms direction
✅ Sweep occurs and rejects cleanly
✅ FVG exists recently (or is mitigated if you choose that model)
✅ Setup Quality exceeds the elevated adaptive threshold
If any one is missing → no trade
This is not meant to “predict” gold — it’s meant to enforce discipline when seasonality historically underperforms.
🔹4.Limitations and User Responsibility
► The indicator does not represent financial advice or imply performance expectations.
► Seasonality is statistical tendency, not certainty — macro conditions can override it.
► Results vary by broker feed, timeframe, and settings.
► Users should test thoroughly in simulation before applying to live markets.
► All trading decisions, risk management, and execution remain solely the responsibility of the user.
🔹5. Alerts
Optional alerts can notify when:
• a new month begins and the seasonal regime changes
• A+ criteria are met
• weak-month strict conditions pass (BOS + Sweep + FVG)
Alerts are informational only and do not constitute actionable recommendations.
Disclaimer
This script is provided for informational and educational purposes only . It does not provide financial, investment, or trading advice, and it does not guarantee profits or future performance. All decisions made based on this script are solely the responsibility of the user.
This script does not execute trades, manage risk, or replace the need for trader discretion. Market behavior can change quickly, and past behavior detected by the script does not ensure similar future outcomes.
Users should test the script on demo or simulation environments before applying it to live markets and must maintain full responsibility for their own risk management, position sizing, and trade execution.
Trading involves risk, and losses can exceed deposits. By using this script, you acknowledge that you understand and accept all associated risks.

ORB Fusion🎯 CORE INNOVATION: INSTITUTIONAL ORB FRAMEWORK WITH FAILED BREAKOUT INTELLIGENCE
ORB Fusion represents a complete institutional-grade Opening Range Breakout system combining classic Market Profile concepts (Initial Balance, day type classification) with modern algorithmic breakout detection, failed breakout reversal logic, and comprehensive statistical tracking. Rather than simply drawing lines at opening range extremes, this system implements the full trading methodology used by professional floor traders and market makers—including the critical concept that failed breakouts are often higher-probability setups than successful breakouts .
The Opening Range Hypothesis:
The first 30-60 minutes of trading establishes the day's value area —the price range where the majority of participants agree on fair value. This range is formed during peak information flow (overnight news digestion, gap reactions, early institutional positioning). Breakouts from this range signal directional conviction; failures to hold breakouts signal trapped participants and create exploitable reversals.
Why Opening Range Matters:
1. Information Aggregation : Opening range reflects overnight news, pre-market sentiment, and early institutional orders. It's the market's initial "consensus" on value.
2. Liquidity Concentration : Stop losses cluster just outside opening range. Breakouts trigger these stops, creating momentum. Failed breakouts trap traders, forcing reversals.
3. Statistical Persistence : Markets exhibit range expansion tendency —when price accepts above/below opening range with volume, it often extends 1.0-2.0x the opening range size before mean reversion.
4. Institutional Behavior : Large players (market makers, institutions) use opening range as reference for the day's trading plan. They fade extremes in rotation days and follow breakouts in trend days.
Historical Context:
Opening Range Breakout methodology originated in commodity futures pits (1970s-80s) where floor traders noticed consistent patterns: the first 30-60 minutes established a "fair value zone," and directional moves occurred when this zone was violated with conviction. J. Peter Steidlmayer formalized this observation in Market Profile theory, introducing the "Initial Balance" concept—the first hour (two 30-minute periods) defining market structure.
📊 OPENING RANGE CONSTRUCTION
Four ORB Timeframe Options:
1. 5-Minute ORB (0930-0935 ET):
Captures immediate market direction during "opening drive"—the explosive first few minutes when overnight orders hit the tape.
Use Case:
• Scalping strategies
• High-frequency breakout trading
• Extremely liquid instruments (ES, NQ, SPY)
Characteristics:
• Very tight range (often 0.2-0.5% of price)
• Early breakouts common (7 of 10 days break within first hour)
• Higher false breakout rate (50-60%)
• Requires sub-minute chart monitoring
Psychology: Captures panic buyers/sellers reacting to overnight news. Range is small because sample size is minimal—only 5 minutes of price discovery. Early breakouts often fail because they're driven by retail FOMO rather than institutional conviction.
2. 15-Minute ORB (0930-0945 ET):
Balances responsiveness with statistical validity. Captures opening drive plus initial reaction to that drive.
Use Case:
• Day trading strategies
• Balanced scalping/swing hybrid
• Most liquid instruments
Characteristics:
• Moderate range (0.4-0.8% of price typically)
• Breakout rate ~60% of days
• False breakout rate ~40-45%
• Good balance of opportunity and reliability
Psychology: Includes opening panic AND the first retest/consolidation. Sophisticated traders (institutions, algos) start expressing directional bias. This is the "Goldilocks" timeframe—not too reactive, not too slow.
3. 30-Minute ORB (0930-1000 ET):
Classic ORB timeframe. Default for most professional implementations.
Use Case:
• Standard intraday trading
• Position sizing for full-day trades
• All liquid instruments (equities, indices, futures)
Characteristics:
• Substantial range (0.6-1.2% of price)
• Breakout rate ~55% of days
• False breakout rate ~35-40%
• Statistical sweet spot for extensions
Psychology: Full opening auction + first institutional repositioning complete. By 10:00 AM ET, headlines are digested, early stops are hit, and "real" directional players reveal themselves. This is when institutional programs typically finish their opening positioning.
Statistical Advantage: 30-minute ORB shows highest correlation with daily range. When price breaks and holds outside 30m ORB, probability of reaching 1.0x extension (doubling the opening range) exceeds 60% historically.
4. 60-Minute ORB (0930-1030 ET) - Initial Balance:
Steidlmayer's "Initial Balance"—the foundation of Market Profile theory.
Use Case:
• Swing trading entries
• Day type classification
• Low-frequency institutional setups
Characteristics:
• Wide range (0.8-1.5% of price)
• Breakout rate ~45% of days
• False breakout rate ~25-30% (lowest)
• Best for trend day identification
Psychology: Full first hour captures A-period (0930-1000) and B-period (1000-1030). By 10:30 AM ET, all early positioning is complete. Market has "voted" on value. Subsequent price action confirms (trend day) or rejects (rotation day) this value assessment.
Initial Balance Theory:
IB represents the market's accepted value area . When price extends significantly beyond IB (>1.5x IB range), it signals a Trend Day —strong directional conviction. When price remains within 1.0x IB, it signals a Rotation Day —mean reversion environment. This classification completely changes trading strategy.
🔬 LTF PRECISION TECHNOLOGY
The Chart Timeframe Problem:
Traditional ORB indicators calculate range using the chart's current timeframe. This creates critical inaccuracies:
Example:
• You're on a 5-minute chart
• ORB period is 30 minutes (0930-1000 ET)
• Indicator sees only 6 bars (30min ÷ 5min/bar = 6 bars)
• If any 5-minute bar has extreme wick, entire ORB is distorted
The Problem Amplifies:
• On 15-minute chart with 30-minute ORB: Only 2 bars sampled
• On 30-minute chart with 30-minute ORB: Only 1 bar sampled
• Opening spike or single large wick defines entire range (invalid)
Solution: Lower Timeframe (LTF) Precision:
ORB Fusion uses `request.security_lower_tf()` to sample 1-minute bars regardless of chart timeframe:
```
For 30-minute ORB on 15-minute chart:
- Traditional method: Uses 2 bars (15min × 2 = 30min)
- LTF Precision: Requests thirty 1-minute bars, calculates true high/low
```
Why This Matters:
Scenario: ES futures, 15-minute chart, 30-minute ORB
• Traditional ORB: High = 5850.00, Low = 5842.00 (range = 8 points)
• LTF Precision ORB: High = 5848.50, Low = 5843.25 (range = 5.25 points)
Difference: 2.75 points distortion from single 15-minute wick hitting 5850.00 at 9:31 AM then immediately reversing. LTF precision filters this out by seeing it was a fleeting wick, not a sustained high.
Impact on Extensions:
With inflated range (8 points vs 5.25 points):
• 1.5x extension projects +12 points instead of +7.875 points
• Difference: 4.125 points (nearly $200 per ES contract)
• Breakout signals trigger late; extension targets unreachable
Implementation:
```pinescript
getLtfHighLow() =>
float ha = request.security_lower_tf(syminfo.tickerid, "1", high)
float la = request.security_lower_tf(syminfo.tickerid, "1", low)
```
Function returns arrays of 1-minute high/low values, then finds true maximum and minimum across all samples.
When LTF Precision Activates:
Only when chart timeframe exceeds ORB session window:
• 5-minute chart + 30-minute ORB: LTF used (chart TF > session bars needed)
• 1-minute chart + 30-minute ORB: LTF not needed (direct sampling sufficient)
Recommendation: Always enable LTF Precision unless you're on 1-minute charts. The computational overhead is negligible, and accuracy improvement is substantial.
⚖️ INITIAL BALANCE (IB) FRAMEWORK
Steidlmayer's Market Profile Innovation:
J. Peter Steidlmayer developed Market Profile in the 1980s for the Chicago Board of Trade. His key insight: market structure is best understood through time-at-price (value area) rather than just price-over-time (traditional charts).
Initial Balance Definition:
IB is the price range established during the first hour of trading, subdivided into:
• A-Period : First 30 minutes (0930-1000 ET for US equities)
• B-Period : Second 30 minutes (1000-1030 ET)
A-Period vs B-Period Comparison:
The relationship between A and B periods forecasts the day:
B-Period Expansion (Bullish):
• B-period high > A-period high
• B-period low ≥ A-period low
• Interpretation: Buyers stepping in after opening assessed
• Implication: Bullish continuation likely
• Strategy: Buy pullbacks to A-period high (now support)
B-Period Expansion (Bearish):
• B-period low < A-period low
• B-period high ≤ A-period high
• Interpretation: Sellers stepping in after opening assessed
• Implication: Bearish continuation likely
• Strategy: Sell rallies to A-period low (now resistance)
B-Period Contraction:
• B-period stays within A-period range
• Interpretation: Market indecisive, digesting A-period information
• Implication: Rotation day likely, stay range-bound
• Strategy: Fade extremes, sell high/buy low within IB
IB Extensions:
Professional traders use IB as a ruler to project price targets:
Extension Levels:
• 0.5x IB : Initial probe outside value (minor target)
• 1.0x IB : Full extension (major target for normal days)
• 1.5x IB : Trend day threshold (classifies as trending)
• 2.0x IB : Strong trend day (rare, ~10-15% of days)
Calculation:
```
IB Range = IB High - IB Low
Bull Extension 1.0x = IB High + (IB Range × 1.0)
Bear Extension 1.0x = IB Low - (IB Range × 1.0)
```
Example:
ES futures:
• IB High: 5850.00
• IB Low: 5842.00
• IB Range: 8.00 points
Extensions:
• 1.0x Bull Target: 5850 + 8 = 5858.00
• 1.5x Bull Target: 5850 + 12 = 5862.00
• 2.0x Bull Target: 5850 + 16 = 5866.00
If price reaches 5862.00 (1.5x), day is classified as Trend Day —strategy shifts from mean reversion to trend following.
📈 DAY TYPE CLASSIFICATION SYSTEM
Four Day Types (Market Profile Framework):
1. TREND DAY:
Definition: Price extends ≥1.5x IB range in one direction and stays there.
Characteristics:
• Opens and never returns to IB
• Persistent directional movement
• Volume increases as day progresses (conviction building)
• News-driven or strong institutional flow
Frequency: ~20-25% of trading days
Trading Strategy:
• DO: Follow the trend, trail stops, let winners run
• DON'T: Fade extremes, take early profits
• Key: Add to position on pullbacks to previous extension level
• Risk: Getting chopped in false trend (see Failed Breakout section)
Example: FOMC decision, payroll report, earnings surprise—anything creating one-sided conviction.
2. NORMAL DAY:
Definition: Price extends 0.5-1.5x IB, tests both sides, returns to IB.
Characteristics:
• Two-sided trading
• Extensions occur but don't persist
• Volume balanced throughout day
• Most common day type
Frequency: ~45-50% of trading days
Trading Strategy:
• DO: Take profits at extension levels, expect reversals
• DON'T: Hold for massive moves
• Key: Treat each extension as a profit-taking opportunity
• Risk: Holding too long when momentum shifts
Example: Typical day with no major catalysts—market balancing supply and demand.
3. ROTATION DAY:
Definition: Price stays within IB all day, rotating between high and low.
Characteristics:
• Never accepts outside IB
• Multiple tests of IB high/low
• Decreasing volume (no conviction)
• Classic range-bound action
Frequency: ~25-30% of trading days
Trading Strategy:
• DO: Fade extremes (sell IB high, buy IB low)
• DON'T: Chase breakouts
• Key: Enter at extremes with tight stops just outside IB
• Risk: Breakout finally occurs after multiple failures
Example: [/b> Pre-holiday trading, summer doldrums, consolidation after big move.
4. DEVELOPING:
Definition: Day type not yet determined (early in session).
Usage: Classification before 12:00 PM ET when IB extension pattern unclear.
ORB Fusion's Classification Algorithm:
```pinescript
if close > ibHigh:
ibExtension = (close - ibHigh) / ibRange
direction = "BULLISH"
else if close < ibLow:
ibExtension = (ibLow - close) / ibRange
direction = "BEARISH"
if ibExtension >= 1.5:
dayType = "TREND DAY"
else if ibExtension >= 0.5:
dayType = "NORMAL DAY"
else if close within IB:
dayType = "ROTATION DAY"
```
Why Classification Matters:
Same setup (bullish ORB breakout) has opposite implications:
• Trend Day : Hold for 2.0x extension, trail stops aggressively
• Normal Day : Take profits at 1.0x extension, watch for reversal
• Rotation Day : Fade the breakout immediately (likely false)
Knowing day type prevents catastrophic errors like fading a trend day or holding through rotation.
🚀 BREAKOUT DETECTION & CONFIRMATION
Three Confirmation Methods:
1. Close Beyond Level (Recommended):
Logic: Candle must close above ORB high (bull) or below ORB low (bear).
Why:
• Filters out wicks (temporary liquidity grabs)
• Ensures sustained acceptance above/below range
• Reduces false breakout rate by ~20-30%
Example:
• ORB High: 5850.00
• Bar high touches 5850.50 (wick above)
• Bar closes at 5848.00 (inside range)
• Result: NO breakout signal
vs.
• Bar high touches 5850.50
• Bar closes at 5851.00 (outside range)
• Result: BREAKOUT signal confirmed
Trade-off: Slightly delayed entry (wait for close) but much higher reliability.
2. Wick Beyond Level:
Logic: [/b> Any touch of ORB high/low triggers breakout.
Why:
• Earliest possible entry
• Captures aggressive momentum moves
Risk:
• High false breakout rate (60-70%)
• Stop runs trigger signals
• Requires very tight stops (difficult to manage)
Use Case: Scalping with 1-2 point profit targets where any penetration = trade.
3. Body Beyond Level:
Logic: [/b> Candle body (close vs open) must be entirely outside range.
Why:
• Strictest confirmation
• Ensures directional conviction (not just momentum)
• Lowest false breakout rate
Example: Trade-off: [/b> Very conservative—misses some valid breakouts but rarely triggers on false ones.
Volume Confirmation Layer:
All confirmation methods can require volume validation:
Volume Multiplier Logic: Rationale: [/b> True breakouts are driven by institutional activity (large size). Volume spike confirms real conviction vs. stop-run manipulation.
Statistical Impact: [/b>
• Breakouts with volume confirmation: ~65% success rate
• Breakouts without volume: ~45% success rate
• Difference: 20 percentage points edge
Implementation Note: [/b>
Volume confirmation adds complexity—you'll miss breakouts that work but lack volume. However, when targeting 1.5x+ extensions (ambitious goals), volume confirmation becomes critical because those moves require sustained institutional participation.
Recommended Settings by Strategy: [/b>
Scalping (1-2 point targets): [/b>
• Method: Close
• Volume: OFF
• Rationale: Quick in/out doesn't need perfection
Intraday Swing (5-10 point targets): [/b>
• Method: Close
• Volume: ON (1.5x multiplier)
• Rationale: Balance reliability and opportunity
Position Trading (full-day holds): [/b>
• Method: Body
• Volume: ON (2.0x multiplier)
• Rationale: Must be certain—large stops require high win rate
🔥 FAILED BREAKOUT SYSTEM
The Core Insight: [/b>
Failed breakouts are often more profitable [/b> than successful breakouts because they create trapped traders with predictable behavior.
Failed Breakout Definition: [/b>
A breakout that:
1. Initially penetrates ORB level with confirmation
2. Attracts participants (volume spike, momentum)
3. Fails to extend (stalls or immediately reverses)
4. Returns inside ORB range within N bars
Psychology of Failure: [/b>
When breakout fails:
• Breakout buyers are trapped [/b>: Bought at ORB high, now underwater
• Early longs reduce: Take profit, fearful of reversal
• Shorts smell blood: See failed breakout as reversal signal
• Result: Cascade of selling as trapped bulls exit + new shorts enter
Mirror image for failed bearish breakouts (trapped shorts cover + new longs enter).
Failure Detection Parameters: [/b>
1. Failure Confirmation Bars (default: 3): [/b>
How many bars after breakout to confirm failure?
Logic: Settings: [/b>
• 2 bars: Aggressive failure detection (more signals, more false failures)
• 3 bars Balanced (default)
• 5-10 bars: Conservative (wait for clear reversal)
Why This Matters:
Too few bars: You call "failed breakout" when price is just consolidating before next leg.
Too many bars: You miss the reversal entry (price already back in range).
2. Failure Buffer (default: 0.1 ATR): [/b>
How far inside ORB must price return to confirm failure?
Formula: Why Buffer Matters: clear rejection [/b> (not just hovering at level).
Settings: [/b>
• 0.0 ATR: No buffer, immediate failure signal
• 0.1 ATR: Small buffer (default) - filters noise
• [b>0.2-0.3 ATR: Large buffer - only dramatic failures count
Example: Reversal Entry System: [/b>
When failure confirmed, system generates complete reversal trade:
For Failed Bull Breakout (Short Reversal): [/b>
Entry: [/b> Current close when failure confirmed
Stop Loss: [/b> Extreme high since breakout + 0.10 ATR padding
Target 1: [/b> ORB High - (ORB Range × 0.5)
Target 2: Target 3: [/b> ORB High - (ORB Range × 1.5)
Example:
• ORB High: 5850, ORB Low: 5842, Range: 8 points
• Breakout to 5853, fails, reverses to 5848 (entry)
• Stop: 5853 + 1 = 5854 (6 point risk)
• T1: 5850 - 4 = 5846 (-2 points, 1:3 R:R)
• T2: 5850 - 8 = 5842 (-6 points, 1:1 R:R)
• T3: 5850 - 12 = 5838 (-10 points, 1.67:1 R:R)
[b>Why These Targets? [/b>
• T1 (0.5x ORB below high): Trapped bulls start panic
• T2 (1.0x ORB = ORB Mid): Major retracement, momentum fully reversed
• T3 (1.5x ORB): Reversal extended, now targeting opposite side
Historical Performance: [/b>
Failed breakout reversals in ORB Fusion's tracking system show:
• Win Rate: 65-75% (significantly higher than initial breakouts)
• Average Winner: 1.2x ORB range
• Average Loser: 0.5x ORB range (protected by stop at extreme)
• Expectancy: Strongly positive even with <70% win rate
Why Failed Breakouts Outperform: [/b>
1. Information Advantage: You now know what price did (failed to extend). Initial breakout trades are speculative; reversal trades are reactive to confirmed failure.
2. Trapped Participant Pressure: Every trapped bull becomes a seller. This creates sustained pressure.
3. Stop Loss Clarity: Extreme high is obvious stop (just beyond recent high). Breakout trades have ambiguous stops (ORB mid? Recent low? Too wide or too tight).
4. Mean Reversion Edge: Failed breakouts return to value (ORB mid). Initial breakouts try to escape value (harder to sustain).
Critical Insight: [/b>
"The best trade is often the one that trapped everyone else."
Failed breakouts create asymmetric opportunity because you're trading against [/b> trapped participants rather than with [/b> them. When you see a failed breakout signal, you're seeing real-time evidence that the market rejected directional conviction—that's exploitable.
📐 FIBONACCI EXTENSION SYSTEM
Six Extension Levels: [/b>
Extensions project how far price will travel after ORB breakout. Based on Fibonacci ratios + empirical market behavior.
1. 1.272x (27.2% Extension): [/b>
Formula: [/b> ORB High/Low + (ORB Range × 0.272)
Psychology: [/b> Initial probe beyond ORB. Early momentum + trapped shorts (on bull side) covering.
Probability of Reach: [/b> ~75-80% after confirmed breakout
Trading: [/b>
• First resistance/support after breakout
• Partial profit target (take 30-50% off)
• Watch for rejection here (could signal failure in progress)
Why 1.272? [/b> Related to harmonic patterns (1.272 is √1.618). Empirically, markets often stall at 25-30% extension before deciding whether to continue or fail.
2. 1.5x (50% Extension):
Formula: [/b> ORB High/Low + (ORB Range × 0.5)
Psychology: [/b> Breakout gaining conviction. Requires sustained buying/selling (not just momentum spike).
Probability of Reach: [/b> ~60-65% after confirmed breakout
Trading: [/b>
• Major partial profit (take 50-70% off)
• Move stops to breakeven
• Trail remaining position
Why 1.5x? [/b> Classic halfway point to 2.0x. Markets often consolidate here before final push. If day type is "Normal," this is likely the high/low for the day.
3. 1.618x (Golden Ratio Extension): [/b>
Formula: [/b> ORB High/Low + (ORB Range × 0.618)
Psychology: [/b> Strong directional day. Institutional conviction + retail FOMO.
Probability of Reach: [/b> ~45-50% after confirmed breakout
Trading: [/b>
• Final partial profit (close 80-90%)
• Trail remainder with wide stop (allow breathing room)
Why 1.618? [/b> Fibonacci golden ratio. Appears consistently in market geometry. When price reaches 1.618x extension, move is "mature" and reversal risk increases.
4. 2.0x (100% Extension): [/b>
Formula: ORB High/Low + (ORB Range × 1.0)
Psychology: [/b> Trend day confirmed. Opening range completely duplicated.
Probability of Reach: [/b> ~30-35% after confirmed breakout
Trading: Why 2.0x? [/b> Psychological level—range doubled. Also corresponds to typical daily ATR in many instruments (opening range ~ 0.5 ATR, daily range ~ 1.0 ATR).
5. 2.618x (Super Extension):
Formula: [/b> ORB High/Low + (ORB Range × 1.618)
Psychology: [/b> Parabolic move. News-driven or squeeze.
Probability of Reach: [/b> ~10-15% after confirmed breakout
[b>Trading: Why 2.618? [/b> Fibonacci ratio (1.618²). Rare to reach—when it does, move is extreme. Often precedes multi-day consolidation or reversal.
6. 3.0x (Extreme Extension): [/b>
Formula: [/b> ORB High/Low + (ORB Range × 2.0)
Psychology: [/b> Market melt-up/crash. Only in extreme events.
[b>Probability of Reach: [/b> <5% after confirmed breakout
Trading: [/b>
• Close immediately if reached
• These are outlier events (black swans, flash crashes, squeeze-outs)
• Holding for more is greed—take windfall profit
Why 3.0x? [/b> Triple opening range. So rare it's statistical noise. When it happens, it's headline news.
Visual Example:
ES futures, ORB 5842-5850 (8 point range), Bullish breakout:
• ORB High : 5850.00 (entry zone)
• 1.272x : 5850 + 2.18 = 5852.18 (first resistance)
• 1.5x : 5850 + 4.00 = 5854.00 (major target)
• 1.618x : 5850 + 4.94 = 5854.94 (strong target)
• 2.0x : 5850 + 8.00 = 5858.00 (trend day)
• 2.618x : 5850 + 12.94 = 5862.94 (extreme)
• 3.0x : 5850 + 16.00 = 5866.00 (parabolic)
Profit-Taking Strategy:
Optimal scaling out at extensions:
• Breakout entry at 5850.50
• 30% off at 1.272x (5852.18) → +1.68 points
• 40% off at 1.5x (5854.00) → +3.50 points
• 20% off at 1.618x (5854.94) → +4.44 points
• 10% off at 2.0x (5858.00) → +7.50 points
[b>Average Exit: Conclusion: [/b> Scaling out at extensions produces 40% higher expectancy than holding for home runs.
📊 GAP ANALYSIS & FILL PSYCHOLOGY
[b>Gap Definition: [/b>
Price discontinuity between previous close and current open:
• Gap Up : Open > Previous Close + noise threshold (0.1 ATR)
• Gap Down : Open < Previous Close - noise threshold
Why Gaps Matter: [/b>
Gaps represent unfilled orders [/b>. When market gaps up, all limit buy orders between yesterday's close and today's open are never filled. Those buyers are "left behind." Psychology: they wait for price to return ("fill the gap") so they can enter. This creates magnetic pull [/b> toward gap level.
Gap Fill Statistics (Empirical): [/b>
• Gaps <0.5% [/b>: 85-90% fill within same day
• Gaps 0.5-1.0% [/b>: 70-75% fill within same day, 90%+ within week
• Gaps >1.0% [/b>: 50-60% fill within same day (major news often prevents fill)
Gap Fill Strategy: [/b>
Setup 1: Gap-and-Go
Gap opens, extends away from gap (doesn't fill).
• ORB confirms direction away from gap
• Trade WITH ORB breakout direction
• Expectation: Gap won't fill today (momentum too strong)
Setup 2: Gap-Fill Fade
Gap opens, but fails to extend. Price drifts back toward gap.
• ORB breakout TOWARD gap (not away)
• Trade toward gap fill level
• Target: Previous close (gap fill complete)
Setup 3: Gap-Fill Rejection
Gap fills (touches previous close) then rejects.
• ORB breakout AWAY from gap after fill
• Trade away from gap direction
• Thesis: Gap filled (orders executed), now resume original direction
[b>Example: Scenario A (Gap-and-Go):
• ORB breaks upward to $454 (away from gap)
• Trade: LONG breakout, expect continued rally
• Gap becomes support ($452)
Scenario B (Gap-Fill):
• ORB breaks downward through $452.50 (toward gap)
• Trade: SHORT toward gap fill at $450.00
• Target: $450.00 (gap filled), close position
Scenario C (Gap-Fill Rejection):
• Price drifts to $450.00 (gap filled) early in session
• ORB establishes $450-$451 after gap fill
• ORB breaks upward to $451.50
• Trade: LONG breakout (gap is filled, now resume rally)
ORB Fusion Integration: [/b>
Dashboard shows:
• Gap type (Up/Down/None)
• Gap size (percentage)
• Gap fill status (Filled ✓ / Open)
This informs setup confidence:
• ORB breakout AWAY from unfilled gap: +10% confidence (gap becomes support/resistance)
• ORB breakout TOWARD unfilled gap: -10% confidence (gap fill may override ORB)
[b>📈 VWAP & INSTITUTIONAL BIAS [/b>
[b>Volume-Weighted Average Price (VWAP): [/b>
Average price weighted by volume at each price level. Represents true "average" cost for the day.
[b>Calculation: Institutional Benchmark [/b>: Institutions (mutual funds, pension funds) use VWAP as performance benchmark. If they buy above VWAP, they underperformed; below VWAP, they outperformed.
2. [b>Algorithmic Target [/b>: Many algos are programmed to buy below VWAP and sell above VWAP to achieve "fair" execution.
3. [b>Support/Resistance [/b>: VWAP acts as dynamic support (price above) or resistance (price below).
[b>VWAP Bands (Standard Deviations): [/b>
• [b>1σ Band [/b>: VWAP ± 1 standard deviation
- Contains ~68% of volume
- Normal trading range
- Bounces common
• [b>2σ Band [/b>: VWAP ± 2 standard deviations
- Contains ~95% of volume
- Extreme extension
- Mean reversion likely
ORB + VWAP Confluence: [/b>
Highest-probability setups occur when ORB and VWAP align:
Bullish Confluence: [/b>
• ORB breakout upward (bullish signal)
• Price above VWAP (institutional buying)
• Confidence boost: +15%
Bearish Confluence: [/b>
• ORB breakout downward (bearish signal)
• Price below VWAP (institutional selling)
• Confidence boost: +15%
[b>Divergence Warning:
• ORB breakout upward BUT price below VWAP
• Conflict: Breakout says "buy," VWAP says "sell"
• Confidence penalty: -10%
• Interpretation: Retail buying but institutions not participating (lower quality breakout)
📊 MOMENTUM CONTEXT SYSTEM
[b>Innovation: Candle Coloring by Position
Rather than fixed support/resistance lines, ORB Fusion colors candles based on their [b>relationship to ORB :
[b>Three Zones: [/b>
1. Inside ORB (Blue Boxes): [/b>
[b>Calculation:
• Darker blue: Near extremes of ORB (potential breakout imminent)
• Lighter blue: Near ORB mid (consolidation)
[b>Trading: [/b> Coiled spring—await breakout.
[b>2. Above ORB (Green Boxes):
[b>Calculation: 3. Below ORB (Red Boxes):
Mirror of above ORB logic.
[b>Special Contexts: [/b>
[b>Breakout Bar (Darkest Green/Red): [/b>
The specific bar where breakout occurs gets maximum color intensity regardless of distance. This highlights the pivotal moment.
[b>Failed Breakout Bar (Orange/Warning): [/b>
When failed breakout is confirmed, that bar gets orange/warning color. Visual alert: "reversal opportunity here."
[b>Near Extension (Cyan/Magenta Tint): [/b>
When price is within 0.5 ATR of an extension level, candle gets tinted cyan (bull) or magenta (bear). Indicates "target approaching—prepare to take profit."
[b>Why Visual Context? [/b>
Traditional indicators show lines. ORB Fusion shows [b>context-aware momentum [/b>. Glance at chart:
• Lots of blue? Consolidation day (fade extremes).
• Progressive green? Trend day (follow).
• Green then orange? Failed breakout (reversal setup).
This visual language communicates market state instantly—no interpretation needed.
🎯 TRADE SETUP GENERATION & GRADING [/b>
[b>Algorithmic Setup Detection: [/b>
ORB Fusion continuously evaluates market state and generates current best trade setup with:
• Action (LONG / SHORT / FADE HIGH / FADE LOW / WAIT)
• Entry price
• Stop loss
• Three targets
• Risk:Reward ratio
• Confidence score (0-100)
• Grade (A+ to D)
[b>Setup Types: [/b>
[b>1. ORB LONG (Bullish Breakout): [/b>
[b>Trigger: [/b>
• Bullish ORB breakout confirmed
• Not failed
[b>Parameters:
• Entry: Current close
• Stop: ORB mid (protects against failure)
• T1: ORB High + 0.5x range (1.5x extension)
• T2: ORB High + 1.0x range (2.0x extension)
• T3: ORB High + 1.618x range (2.618x extension)
[b>Confidence Scoring:
[b>Trigger: [/b>
• Bearish breakout occurred
• Failed (returned inside ORB)
[b>Parameters: [/b>
• Entry: Close when failure confirmed
• Stop: Extreme low since breakout + 0.10 ATR
• T1: ORB Low + 0.5x range
• T2: ORB Low + 1.0x range (ORB mid)
• T3: ORB Low + 1.5x range
[b>Confidence Scoring:
[b>Trigger:
• Inside ORB
• Close > ORB mid (near high)
[b>Parameters: [/b>
• Entry: ORB High (limit order)
• Stop: ORB High + 0.2x range
• T1: ORB Mid
• T2: ORB Low
[b>Confidence Scoring: [/b>
Base: 40 points (lower base—range fading is lower probability than breakout/reversal)
[b>Use Case: [/b> Rotation days. Not recommended on normal/trend days.
[b>6. FADE LOW (Range Trade):
Mirror of FADE HIGH.
[b>7. WAIT:
[b>Trigger: [/b>
• ORB not complete yet OR
• No clear setup (price in no-man's-land)
[b>Action: [/b> Observe, don't trade.
[b>Confidence: [/b> 0 points
[b>Grading System:
```
Confidence → Grade
85-100 → A+
75-84 → A
65-74 → B+
55-64 → B
45-54 → C
0-44 → D
```
[b>Grade Interpretation: [/b>
• [b>A+ / A: High probability setup. Take these trades.
• [b>B+ / B [/b>: Decent setup. Trade if fits system rules.
• [b>C [/b>: Marginal setup. Only if very experienced.
• [b>D [/b>: Poor setup or no setup. Don't trade.
[b>Example Scenario: [/b>
ES futures:
• ORB: 5842-5850 (8 point range)
• Bullish breakout to 5851 confirmed
• Volume: 2.0x average (confirmed)
• VWAP: 5845 (price above VWAP ✓)
• Day type: Developing (too early, no bonus)
• Gap: None
[b>Setup: [/b>
• Action: LONG
• Entry: 5851
• Stop: 5846 (ORB mid, -5 point risk)
• T1: 5854 (+3 points, 1:0.6 R:R)
• T2: 5858 (+7 points, 1:1.4 R:R)
• T3: 5862.94 (+11.94 points, 1:2.4 R:R)
[b>Confidence: LONG with 55% confidence.
Interpretation: Solid setup, not perfect. Trade it if your system allows B-grade signals.
[b>📊 STATISTICS TRACKING & PERFORMANCE ANALYSIS [/b>
[b>Real-Time Performance Metrics: [/b>
ORB Fusion tracks comprehensive statistics over user-defined lookback (default 50 days):
[b>Breakout Performance: [/b>
• [b>Bull Breakouts: [/b> Total count, wins, losses, win rate
• [b>Bear Breakouts: [/b> Total count, wins, losses, win rate
[b>Win Definition: [/b> Breakout reaches ≥1.0x extension (doubles the opening range) before end of day.
[b>Example: [/b>
• ORB: 5842-5850 (8 points)
• Bull breakout at 5851
• Reaches 5858 (1.0x extension) by close
• Result: WIN
[b>Failed Breakout Performance: [/b>
• [b>Total Failed Breakouts [/b>: Count of breakouts that failed
• [b>Reversal Wins [/b>: Count where reversal trade reached target
• [b>Failed Reversal Win Rate [/b>: Wins / Total Failed
[b>Win Definition for Reversals: [/b>
• Failed bull → reversal short reaches ORB mid
• Failed bear → reversal long reaches ORB mid
[b>Extension Tracking: [/b>
• [b>Average Extension Reached [/b>: Mean of maximum extension achieved across all breakout days
• [b>Max Extension Overall [/b>: Largest extension ever achieved in lookback period
[b>Example: 🎨 THREE DISPLAY MODES
[b>Design Philosophy: [/b>
Not all traders need all features. Beginners want simplicity. Professionals want everything. ORB Fusion adapts.
[b>SIMPLE MODE: [/b>
[b>Shows: [/b>
• Primary ORB levels (High, Mid, Low)
• ORB box
• Breakout signals (triangles)
• Failed breakout signals (crosses)
• Basic dashboard (ORB status, breakout status, setup)
• VWAP
[b>Hides: [/b>
• Session ORBs (Asian, London, NY)
• IB levels and extensions
• ORB extensions beyond basic levels
• Gap analysis visuals
• Statistics dashboard
• Momentum candle coloring
• Narrative dashboard
[b>Use Case: [/b>
• Traders who want clean chart
• Focus on core ORB concept only
• Mobile trading (less screen space)
[b>STANDARD MODE:
[b>Shows Everything in Simple Plus: [/b>
• Session ORBs (Asian, London, NY)
• IB levels (high, low, mid)
• IB extensions
• ORB extensions (1.272x, 1.5x, 1.618x, 2.0x)
• Gap analysis and fill targets
• VWAP bands (1σ and 2σ)
• Momentum candle coloring
• Context section in dashboard
• Narrative dashboard
[b>Hides: [/b>
• Advanced extensions (2.618x, 3.0x)
• Detailed statistics dashboard
[b>Use Case: [/b>
• Most traders
• Balance between information and clarity
• Covers 90% of use cases
[b>ADVANCED MODE:
[b>Shows Everything:
• All session ORBs
• All IB levels and extensions
• All ORB extensions (including 2.618x and 3.0x)
• Full gap analysis
• VWAP with both 1σ and 2σ bands
• Momentum candle coloring
• Complete statistics dashboard
• Narrative dashboard
• All context metrics
[b>Use Case: [/b>
• Professional traders
• System developers
• Those who want maximum information density
[b>Switching Modes: [/b>
Single dropdown input: "Display Mode" → Simple / Standard / Advanced
Entire indicator adapts instantly. No need to toggle 20 individual settings.
📖 NARRATIVE DASHBOARD
[b>Innovation: Plain-English Market State [/b>
Most indicators show data. ORB Fusion explains what the data [b>means [/b>.
[b>Narrative Components: [/b>
[b>1. Phase: [/b>
• "📍 Building ORB..." (during ORB session)
• "📊 Trading Phase" (after ORB complete)
• "⏳ Pre-Market" (before ORB session)
[b>2. Status (Current Observation): [/b>
• "⚠️ Failed breakout - reversal likely"
• "🚀 Bullish momentum in play"
• "📉 Bearish momentum in play"
• "⚖️ Consolidating in range"
• "👀 Monitoring for setup"
[b>3. Next Level:
Tells you what to watch for:
• "🎯 1.5x @ 5854.00" (next extension target)
• "Watch ORB levels" (inside range, await breakout)
[b>4. Setup: [/b>
Current trade setup + grade:
• "LONG " (bullish breakout, A-grade)
• "🔥 SHORT REVERSAL " (failed bull breakout, A+-grade)
• "WAIT " (no setup)
[b>5. Reason: [/b>
Why this setup exists:
• "ORB Bullish Breakout"
• "Failed Bear Breakout - High Probability Reversal"
• "Range Fade - Near High"
[b>6. Tip (Market Insight):
Contextual advice:
• "🔥 TREND DAY - Trail stops" (day type is trending)
• "🔄 ROTATION - Fade extremes" (day type is rotating)
• "📊 Gap unfilled - magnet level" (gap creates target)
• "📈 Normal conditions" (no special context)
[b>Example Narrative:
```
📖 ORB Narrative
━━━━━━━━━━━━━━━━
Phase | 📊 Trading Phase
Status | 🚀 Bullish momentum in play
Next | 🎯 1.5x @ 5854.00
📈 Setup | LONG
Reason | ORB Bullish Breakout
💡 Tip | 🔥 TREND DAY - Trail stops
```
[b>Glance Interpretation: [/b>
"We're in trading phase. Bullish breakout happened (momentum in play). Next target is 1.5x extension at 5854. Current setup is LONG with A-grade. It's a trend day, so trail stops (don't take early profits)."
Complete market state communicated in 6 lines. No interpretation needed.
[b>Why This Matters:
Beginner traders struggle with "So what?" question. Indicators show lines and signals, but what does it mean [/b>? Narrative dashboard bridges this gap.
Professional traders benefit too—rapid context assessment during fast-moving markets. No time to analyze; glance at narrative, get action plan.
🔔 INTELLIGENT ALERT SYSTEM
[b>Four Alert Types: [/b>
[b>1. Breakout Alert: [/b>
[b>Trigger: [/b> ORB breakout confirmed (bull or bear)
[b>Message: [/b>
```
🚀 ORB BULLISH BREAKOUT
Price: 5851.00
Volume Confirmed
Grade: A
```
[b>Frequency: [/b> Once per bar (prevents spam)
[b>2. Failed Breakout Alert: [/b>
[b>Trigger: [/b> Breakout fails, reversal setup generated
[b>Message: [/b>
```
🔥 FAILED BULLISH BREAKOUT!
HIGH PROBABILITY SHORT REVERSAL
Entry: 5848.00
Stop: 5854.00
T1: 5846.00
T2: 5842.00
Historical Win Rate: 73%
```
[b>Why Comprehensive? [/b> Failed breakout alerts include complete trade plan. You can execute immediately from alert—no need to check chart.
[b>3. Extension Alert:
[b>Trigger: [/b> Price reaches extension level for first time
[b>Message: [/b>
```
🎯 Bull Extension 1.5x reached @ 5854.00
```
[b>Use: [/b> Profit-taking reminder. When extension hit, consider scaling out.
[b>4. IB Break Alert: [/b>
[b>Trigger: [/b> Price breaks above IB high or below IB low
[b>Message: [/b>
```
📊 IB HIGH BROKEN - Potential Trend Day
```
[b>Use: [/b> Day type classification. IB break suggests trend day developing—adjust strategy to trend-following mode.
[b>Alert Management: [/b>
Each alert type can be enabled/disabled independently. Prevents notification overload.
[b>Cooldown Logic: [/b>
Alerts won't fire if same alert type triggered within last bar. Prevents:
• "Breakout" alert every tick during choppy breakout
• Multiple "extension" alerts if price oscillates at level
Ensures: One clean alert per event.
⚙️ KEY PARAMETERS EXPLAINED
[b>Opening Range Settings: [/b>
• [b>ORB Timeframe [/b> (5/15/30/60 min): Duration of opening range window
- 30 min recommended for most traders
• [b>Use RTH Only [/b> (ON/OFF): Only trade during regular trading hours
- ON recommended (avoids thin overnight markets)
• [b>Use LTF Precision [/b> (ON/OFF): Sample 1-minute bars for accuracy
- ON recommended (critical for charts >1 minute)
• [b>Precision TF [/b> (1/5 min): Timeframe for LTF sampling
- 1 min recommended (most accurate)
[b>Session ORBs: [/b>
• [b>Show Asian/London/NY ORB [/b> (ON/OFF): Display multi-session ranges
- OFF in Simple mode
- ON in Standard/Advanced if trading 24hr markets
• [b>Session Windows [/b>: Time ranges for each session ORB
- Defaults align with major session opens
[b>Initial Balance: [/b>
• [b>Show IB [/b> (ON/OFF): Display Initial Balance levels
- ON recommended for day type classification
• [b>IB Session Window [/b> (0930-1030): First hour of trading
- Default is standard for US equities
• [b>Show IB Extensions [/b> (ON/OFF): Project IB extension targets
- ON recommended (identifies trend days)
• [b>IB Extensions 1-4 [/b> (0.5x, 1.0x, 1.5x, 2.0x): Extension multipliers
- Defaults are Market Profile standard
[b>ORB Extensions: [/b>
• [b>Show Extensions [/b> (ON/OFF): Project ORB extension targets
- ON recommended (defines profit targets)
• [b>Enable Individual Extensions [/b> (1.272x, 1.5x, 1.618x, 2.0x, 2.618x, 3.0x)
- Enable 1.272x, 1.5x, 1.618x, 2.0x minimum
- Disable 2.618x and 3.0x unless trading very volatile instruments
[b>Breakout Detection:
• [b>Confirmation Method [/b> (Close/Wick/Body):
- Close recommended (best balance)
- Wick for scalping
- Body for conservative
• [b>Require Volume Confirmation [/b> (ON/OFF):
- ON recommended (increases reliability)
• [b>Volume Multiplier [/b> (1.0-3.0):
- 1.5x recommended
- Lower for thin instruments
- Higher for heavy volume instruments
[b>Failed Breakout System: [/b>
• [b>Enable Failed Breakouts [/b> (ON/OFF):
- ON strongly recommended (highest edge)
• [b>Bars to Confirm Failure [/b> (2-10):
- 3 bars recommended
- 2 for aggressive (more signals, more false failures)
- 5+ for conservative (fewer signals, higher quality)
• [b>Failure Buffer [/b> (0.0-0.5 ATR):
- 0.1 ATR recommended
- Filters noise during consolidation near ORB level
• [b>Show Reversal Targets [/b> (ON/OFF):
- ON recommended (visualizes trade plan)
• [b>Reversal Target Mults [/b> (0.5x, 1.0x, 1.5x):
- Defaults are tested values
- Adjust based on average daily range
[b>Gap Analysis:
• [b>Show Gap Analysis [/b> (ON/OFF):
- ON if trading instruments that gap frequently
- OFF for 24hr markets (forex, crypto—no gaps)
• [b>Gap Fill Target [/b> (ON/OFF):
- ON to visualize previous close (gap fill level)
[b>VWAP:
• [b>Show VWAP [/b> (ON/OFF):
- ON recommended (key institutional level)
• [b>Show VWAP Bands [/b> (ON/OFF):
- ON in Standard/Advanced
- OFF in Simple
• [b>Band Multipliers (1.0σ, 2.0σ):
- Defaults are standard
- 1σ = normal range, 2σ = extreme
[b>Day Type: [/b>
• [b>Show Day Type Analysis [/b> (ON/OFF):
- ON recommended (critical for strategy adaptation)
• [b>Trend Day Threshold [/b> (1.0-2.5 IB mult):
- 1.5x recommended
- When price extends >1.5x IB, classifies as Trend Day
[b>Enhanced Visuals:
• [b>Show Momentum Candles [/b> (ON/OFF):
- ON for visual context
- OFF if chart gets too colorful
• [b>Show Gradient Zone Fills [/b> (ON/OFF):
- ON for professional look
- OFF for minimalist chart
• [b>Label Display Mode [/b> (All/Adaptive/Minimal):
- Adaptive recommended (shows nearby labels only)
- All for information density
- Minimal for clean chart
• [b>Label Proximity [/b> (1.0-5.0 ATR):
- 3.0 ATR recommended
- Labels beyond this distance are hidden (Adaptive mode)
[b>🎓 PROFESSIONAL USAGE PROTOCOL [/b>
[b>Phase 1: Learning the System (Week 1) [/b>
[b>Goal: [/b> Understand ORB concepts and dashboard interpretation
[b>Setup: [/b>
• Display Mode: STANDARD
• ORB Timeframe: 30 minutes
• Enable ALL features (IB, extensions, failed breakouts, VWAP, gap analysis)
• Enable statistics tracking
[b>Actions: [/b>
• Paper trade ONLY—no real money
• Observe ORB formation every day (9:30-10:00 AM ET for US markets)
• Note when ORB breakouts occur and if they extend
• Note when breakouts fail and reversals happen
• Watch day type classification evolve during session
• Track statistics—which setups are working?
[b>Key Learning: [/b>
• How often do breakouts reach 1.5x extension? (typically 50-60% of confirmed breakouts)
• How often do breakouts fail? (typically 30-40%)
• Which setup grade (A/B/C) actually performs best? (should see A-grade outperforming)
• What day type produces best results? (trend days favor breakouts, rotation days favor fades)
[b>Phase 2: Parameter Optimization (Week 2) [/b>
[b>Goal: [/b> Tune system to your instrument and timeframe
[b>ORB Timeframe Selection:
• Run 5 days with 15-minute ORB
• Run 5 days with 30-minute ORB
• Compare: Which captures better breakouts on your instrument?
• Typically: 30-minute optimal for most, 15-minute for very liquid (ES, SPY)
[b>Volume Confirmation Testing:
• Run 5 days WITH volume confirmation
• Run 5 days WITHOUT volume confirmation
• Compare: Does volume confirmation increase win rate?
• If win rate improves by >5%: Keep volume confirmation ON
• If no improvement: Turn OFF (avoid missing valid breakouts)
[b>Failed Breakout Bars:
[b>Goal: [/b> Develop personal trading rules based on system signals
[b>Setup Selection Rules: [/b>
Define which setups you'll trade:
• [b>Conservative: [/b> Only A+ and A grades
• [b>Balanced: [/b> A+, A, B+ grades
• [b>Aggressive: [/b> All grades B and above
Test each approach for 5-10 trades, compare results.
[b>Position Sizing by Grade: [/b>
Consider risk-weighting by setup quality:
• A+ grade: 100% position size
• A grade: 75% position size
• B+ grade: 50% position size
• B grade: 25% position size
Example: If max risk is $1000/trade:
• A+ setup: Risk $1000
• A setup: Risk $750
• B+ setup: Risk $500
This matches bet sizing to edge.
[b>Day Type Adaptation: [/b>
Create rules for different day types:
Trend Days:
• Take ALL breakout signals (A/B/C grades)
• Hold for 2.0x extension minimum
• Trail stops aggressively (1.0 ATR trail)
• DON'T fade—reversals unlikely
Rotation Days:
• ONLY take failed breakout reversals
• Ignore initial breakout signals (likely to fail)
• Take profits quickly (0.5x extension)
• Focus on fade setups (Fade High/Fade Low)
Normal Days:
• Take A/A+ breakout signals only
• Take ALL failed breakout reversals (high probability)
• Target 1.0-1.5x extensions
• Partial profit-taking at extensions
Time-of-Day Rules: [/b>
Breakouts at different times have different probabilities:
10:00-10:30 AM (Early Breakout):
• ORB just completed
• Fresh breakout
• Probability: Moderate (50-55% reach 1.0x)
• Strategy: Conservative position sizing
10:30-12:00 PM (Mid-Morning):
• Momentum established
• Volume still healthy
• Probability: High (60-65% reach 1.0x)
• Strategy: Standard position sizing
12:00-2:00 PM (Lunch Doldrums):
• Volume dries up
• Whipsaw risk increases
• Probability: Low (40-45% reach 1.0x)
• Strategy: Avoid new entries OR reduce size 50%
2:00-4:00 PM (Afternoon Session):
• Late-day positioning
• EOD squeezes possible
• Probability: Moderate-High (55-60%)
• Strategy: Watch for IB break—if trending all day, follow
[b>Phase 4: Live Micro-Sizing (Month 2) [/b>
[b>Goal: [/b> Validate paper trading results with minimal risk
[b>Setup: [/b>
• 10-20% of intended full position size
• Take ONLY A+ and A grade setups
• Follow stop loss and targets religiously
[b>Execution: [/b>
• Execute from alerts OR from dashboard setup box
• Entry: Close of signal bar OR next bar market order
• Stop: Use exact stop from setup (don't widen)
• Targets: Scale out at T1/T2/T3 as indicated
[b>Tracking: [/b>
• Log every trade: Entry, Exit, Grade, Outcome, Day Type
• Calculate: Win rate, Average R-multiple, Max consecutive losses
• Compare to paper trading results (should be within 15%)
[b>Red Flags: [/b>
• Win rate <45%: System not suitable for this instrument/timeframe
• Major divergence from paper trading: Execution issues (slippage, late entries, emotional exits)
• Max consecutive losses >8: Hitting rough patch OR market regime changed
[b>Phase 5: Scaling Up (Months 3-6)
[b>Goal: [/b> Gradually increase to full position size
[b>Progression: [/b>
• Month 3: 25-40% size (if micro-sizing profitable)
• Month 4: 40-60% size
• Month 5: 60-80% size
• Month 6: 80-100% size
[b>Milestones Required to Scale Up: [/b>
• Minimum 30 trades at current size
• Win rate ≥48%
• Profit factor ≥1.2
• Max drawdown <20%
• Emotional control (no revenge trading, no FOMO)
[b>Advanced Techniques:
[b>Multi-Timeframe ORB: Assumes first 30-60 minutes establish value. Violation: Market opens after major news, price discovery continues for hours (opening range meaningless).
2. [b>Volume Indicates Conviction: ES, NQ, RTY, SPY, QQQ—high liquidity, clean ORB formation, reliable extensions
• [b>Large-Cap Stocks: AAPL, MSFT, TSLA, NVDA (>$5B market cap, >5M daily volume)
• [b>Liquid Futures: CL (crude oil), GC (gold), 6E (EUR/USD), ZB (bonds)—24hr markets benefit from session ORBs
• [b>Major Forex Pairs: [/b> EUR/USD, GBP/USD, USD/JPY—London/NY session ORBs work well
[b>Performs Poorly On: [/b>
• [b>Illiquid Stocks: <$1M daily volume, wide spreads, gappy price action
• [b>Penny Stocks: [/b> Manipulated, pump-and-dump, no real price discovery
• [b>Low-Volume ETFs: Exotic sector ETFs, leveraged products with thin volume
• [b>Crypto on Sketchy Exchanges: Wash trading, spoofing invalidates volume analysis
• [b>Earnings Days: [/b> ORB completes before earnings release, then completely resets (useless)
• Binary Event Days: FDA approvals, court rulings—discontinuous price action
[b>Known Weaknesses: [/b>
• [b>Slow Starts: ORB doesn't complete until 10:00 AM (30-min ORB). Early morning traders have no signals for 30 minutes. Consider using 15-minute ORB if this is problematic.
• [b>Failure Detection Lag: [/b> Failed breakout requires 3+ bars to confirm. By the time system signals reversal, price may have already moved significantly back inside range. Manual traders watching in real-time can enter earlier.
• [b>Extension Overshoot: [/b> System projects extensions mathematically (1.5x, 2.0x, etc.). Actual moves may stop short (1.3x) or overshoot (2.2x). Extensions are targets, not magnets.
• [b>Day Type Misclassification: [/b> Early in session, day type is "Developing." By the time it's classified definitively (often 11:00 AM+), half the day is over. Strategy adjustments happen late.
• [b>Gap Assumptions: [/b> System assumes gaps want to fill. Strong trend days never fill gaps (gap becomes support/resistance forever). Blindly trading toward gaps can backfire on trend days.
• [b>Volume Data Quality: Forex doesn't have centralized volume (uses tick volume as proxy—less reliable). Crypto volume is often fake (wash trading). Volume confirmation less effective on these instruments.
• [b>Multi-Session Complexity: [/b> When using Asian/London/NY ORBs simultaneously, chart becomes cluttered. Requires discipline to focus on relevant session for current time.
[b>Risk Factors: [/b>
• [b>Opening Gaps: Large gaps (>2%) can create distorted ORBs. Opening range might be unusually wide or narrow, making extensions unreliable.
• [b>Low Volatility Environments:[/b> When VIX <12, opening ranges can be tiny (0.2-0.3%). Extensions are equally tiny. Profit targets don't justify commission/slippage.
• [b>High Volatility Environments:[/b> When VIX >30, opening ranges are huge (2-3%+). Extensions project unrealistic targets. Failed breakouts happen faster (volatility whipsaw).
• [b>Algorithm Dominance:[/b> In heavily algorithmic markets (ES during overnight session), ORB levels can be manipulated—algos pin price to ORB high/low intentionally. Breakouts become stop-runs rather than genuine directional moves.
[b>⚠️ RISK DISCLOSURE[/b>
Trading futures, stocks, options, forex, and cryptocurrencies involves substantial risk of loss and is not suitable for all investors. Opening Range Breakout strategies, while based on sound market structure principles, do not guarantee profits and can result in significant losses.
The ORB Fusion indicator implements professional trading concepts including Opening Range theory, Market Profile Initial Balance analysis, Fibonacci extensions, and failed breakout reversal logic. These methodologies have theoretical foundations but past performance—whether backtested or live—is not indicative of future results.
Opening Range theory assumes the first 30-60 minutes of trading establish a meaningful value area and that breakouts from this range signal directional conviction. This assumption may not hold during:
• Major news events (FOMC, NFP, earnings surprises)
• Market structure changes (circuit breakers, trading halts)
• Low liquidity periods (holidays, early closures)
• Algorithmic manipulation or spoofing
Failed breakout detection relies on patterns of trapped participant behavior. While historically these patterns have shown statistical edges, market conditions change. Institutional algorithms, changing market structure, or regime shifts can reduce or eliminate edges that existed historically.
Initial Balance classification (trend day vs rotation day vs normal day) is a heuristic framework, not a deterministic prediction. Day type can change mid-session. Early classification may prove incorrect as the day develops.
Extension projections (1.272x, 1.5x, 1.618x, 2.0x, etc.) are probabilistic targets derived from Fibonacci ratios and empirical market behavior. They are not "support and resistance levels" that price must reach or respect. Markets can stop short of extensions, overshoot them, or ignore them entirely.
Volume confirmation assumes high volume indicates institutional participation and conviction. In algorithmic markets, volume can be artificially high (HFT activity) or artificially low (dark pools, internalization). Volume is a proxy, not a guarantee of conviction.
LTF precision sampling improves ORB accuracy by using 1-minute bars but introduces additional data dependencies. If 1-minute data is unavailable, inaccurate, or delayed, ORB calculations will be incorrect.
The grading system (A+/A/B+/B/C/D) and confidence scores aggregate multiple factors (volume, VWAP, day type, IB expansion, gap context) into a single assessment. This is a mechanical calculation, not artificial intelligence. The system cannot adapt to unprecedented market conditions or events outside its programmed logic.
Real trading involves slippage, commissions, latency, partial fills, and rejected orders not present in indicator calculations. ORB Fusion generates signals at bar close; actual fills occur with delay. Opening range forms during highest volatility (first 30 minutes)—spreads widen, slippage increases. Execution quality significantly impacts realized results.
Statistics tracking (win rates, extension levels reached, day type distribution) is based on historical bars in your lookback window. If lookback is small (<50 bars) or market regime changed, statistics may not represent future probabilities.
Users must independently validate system performance on their specific instruments, timeframes, and broker execution environment. Paper trade extensively (100+ trades minimum) before risking capital. Start with micro position sizing (5-10% of intended size) for 50+ trades to validate execution quality matches expectations.
Never risk more than you can afford to lose completely. Use proper position sizing (0.5-2% risk per trade maximum). Implement stop losses on every single trade without exception. Understand that most retail traders lose money—sophisticated indicators do not change this fundamental reality. They systematize analysis but cannot eliminate risk.
The developer makes no warranties regarding profitability, suitability, accuracy, reliability, or fitness for any purpose. Users assume full responsibility for all trading decisions, parameter selections, risk management, and outcomes.
By using this indicator, you acknowledge that you have read, understood, and accepted these risk disclosures and limitations, and you accept full responsibility for all trading activity and potential losses.
[b>═══════════════════════════════════════════════════════════════════════════════[/b>
[b>CLOSING STATEMENT[/b>
[b>═══════════════════════════════════════════════════════════════════════════════[/b>
Opening Range Breakout is not a trick. It's a framework. The first 30-60 minutes reveal where participants believe value lies. Breakouts signal directional conviction. Failures signal trapped participants. Extensions define profit targets. Day types dictate strategy. Failed breakouts create the highest-probability reversals.
ORB Fusion doesn't predict the future—it identifies [b>structure[/b>, detects [b>breakouts[/b>, recognizes [b>failures[/b>, and generates [b>probabilistic trade plans[/b> with defined risk and reward.
The edge is not in the opening range itself. The edge is in recognizing when the market respects structure (follow breakouts) versus when it violates structure (fade breakouts). The edge is in detecting failures faster than discretionary traders. The edge is in systematic classification that prevents catastrophic errors—like fading a trend day or holding through rotation.
Most indicators draw lines. ORB Fusion implements a complete institutional trading methodology: Opening Range theory, Market Profile classification, failed breakout intelligence, Fibonacci projections, volume confirmation, gap psychology, and real-time performance tracking.
Whether you're a beginner learning market structure or a professional seeking systematic ORB implementation, this system provides the framework.
"The market's first word is its opening range. Everything after is commentary." — ORB Fusion

Liquidity Sweep Reentry ToolkitHere’s a clear breakdown of what your Liquidity Sweep Reentry Toolkit script does, and how you can use it on your charts:
🔎 Script Breakdown
1. Visual Controls (Inputs)
• : Master toggle to turn all visuals on/off.
• : Show labels when a liquidity sweep + ChoCh condition occurs.
• : Plot green/red triangles for bullish/bearish reentry signals.
• : Prevent multiple signals within the same swing.
• : Show HH/HL/LL/LH market structure letters.
• : Slider to adjust how dim the background of HH/HL/LL/LH labels appear.
2. Core Conditions
• Defines simple bullish () and bearish () candles.
• is a placeholder for your Change of Character logic.
3. Sweep Detection
• : Detects when price makes a new high compared to the last 5 bars.
• : Detects when price makes a new low compared to the last 5 bars.
4. Restriction Flags
• Tracks whether a sweep signal has already triggered in the current swing.
• Resets when sweeps end, so new signals can appear.
5. Composite Triggers
• : Fires when bullish candle + buy-side sweep + ChoCh condition align.
• : Fires when bearish candle + sell-side sweep + ChoCh condition align.
6. Visual Labels
• Gold labels mark “BS Sweep + ChoCh” or “SS Sweep + ChoCh” events.
• Green triangle below bar = bullish reentry.
• Red triangle above bar = bearish reentry.
• Blue HH/HL/LL/LH labels narrate market structure pivots, with adjustable transparency.
7. Alerts
• Alerts can be set for bullish or bearish sweep reentry triggers, so you get notified when conditions align.
📘 How to Use It
1. Apply to Chart
Add the script to your TradingView chart (works best on intraday timeframes like 5‑minute).
2. Configure Visuals
• Use the Visual Controls panel to toggle features on/off.
• Adjust the Label Transparency slider to dim or brighten the HH/HL/LL/LH labels.
3. Interpret Signals
• Gold labels show when a sweep + ChoCh condition occurs.
• Triangles mark potential reentry points (green = bullish, red = bearish).
• HH/HL/LL/LH labels narrate market structure shifts for clarity.
4. Set Alerts
• Use the built‑in alert conditions to get notified when bullish or bearish sweep reentry triggers fire.
👉 In short: this toolkit helps you spot liquidity sweeps, confirm with ChoCh, and visualize reentry signals, while also narrating market structure pivots. It’s modular, so you can toggle features depending on how much visual clutter you want.
🛠 Workflow Example
1. Setup
• Apply the script to your chart (e.g., 5‑minute S&P futures).
• In the indicator settings, decide which visuals you want:
• Turn on Sweep + ChoCh labels if you want to see gold tags narrating liquidity events.
• Keep Entry triangles on to highlight actionable reentry points.
• Adjust the Label Transparency slider so HH/HL/LL/LH structure labels are dim enough not to clutter.
2. Watch for Sweeps
• As price pushes above recent highs → a Buy‑side Sweep is detected.
• As price dips below recent lows → a Sell‑side Sweep is detected.
• If ChoCh logic is true at the same time, you’ll see a gold label (“BS Sweep + ChoCh” or “SS Sweep + ChoCh”).
3. Confirm Reentry
• If conditions align (bullish candle + buy‑side sweep + ChoCh), you’ll see a green triangle below the bar.
• If bearish candle + sell‑side sweep + ChoCh, you’ll see a red triangle above the bar.
• These triangles are your potential reentry triggers.
4. Narrate Market Structure
• HH/HL/LL/LH labels appear at pivots, giving you a running commentary of structure shifts.
• Example: HH → HL → HH shows bullish continuation; LH → LL → LH shows bearish pressure.
• Use the transparency slider to keep these labels subtle but visible.
5. Alerts
• Set alerts for “Bullish Sweep Reentry” or “Bearish Sweep Reentry” so you don’t miss signals even if you’re away from the screen.
📘 How to Use in Practice
• Intraday trading: On a 5‑minute chart, use the toolkit to spot liquidity grabs and confirm reentry points.
• Narration: The HH/HL/LL/LH labels help you keep track of structure without manually marking pivots.
• Decision making: Gold labels + triangles = potential trade setups. Structure labels = context for trend bias.
• Customization: Dim labels when you want a cleaner chart, brighten them when you’re focused on structure.
👉 In short: this script gives you a modular toolkit — sweeps, ChoCh confirmation, reentry signals, and structure narration — all adjustable so you can tailor the visuals to your workflow.
📈 Bullish Scenario Walkthrough
1. Market Context
• You’re watching the 5‑minute chart.
• Price has been consolidating near recent highs, building liquidity above.
2. Liquidity Sweep
• Price spikes above the prior swing high → the script detects a buy‑side sweep.
• A gold label appears: “BS Sweep + ChoCh” (if your ChoCh condition is true).
3. Change of Character (ChoCh)
• The candle closes bullish ().
• Your ChoCh condition confirms a structural shift.
• Together, sweep + ChoCh = potential reentry setup.
4. Reentry Trigger
• The script plots a green triangle below the bar.
• This marks a bullish sweep reentry signal: price grabbed liquidity and is now showing strength.
5. Market Structure Narration
• At the same time, the HH/HL labels update:
• The sweep bar prints a new HH.
• The next pivot low prints an HL.
• This narrates bullish continuation: HH → HL → HH.
6. Trade Decision
• You can use the green triangle as your entry cue.
• The HH/HL narration gives you confidence that structure supports the trade.
• Alerts can be set so you don’t miss the trigger.
7. Risk Management
• Stop placement: below the HL pivot or sweep low.
• Target: next liquidity pool above, or measured move.
🧭 How to Use This in Practice
• Gold label = liquidity event + ChoCh confirmation.
• Green triangle = actionable bullish reentry trigger.
• HH/HL narration = context for trend bias and trade management.
• Transparency slider = keep structure labels subtle so the chart stays clean.
📉 Bearish Scenario Walkthrough
1. Market Context
• You’re watching the 5‑minute chart.
• Price has been consolidating near recent lows, building liquidity underneath.
2. Liquidity Sweep
• Price spikes below the prior swing low → the script detects a sell‑side sweep.
• A gold label appears: “SS Sweep + ChoCh” (if your ChoCh condition is true).
3. Change of Character (ChoCh)
• The candle closes bearish ().
• Your ChoCh condition confirms a structural shift.
• Together, sweep + ChoCh = potential bearish reentry setup.
4. Reentry Trigger
• The script plots a red triangle above the bar.
• This marks a bearish sweep reentry signal: price grabbed liquidity below and is now showing weakness.
5. Market Structure Narration
• At the same time, the LH/LL labels update:
• The sweep bar prints a new LL.
• The next pivot high prints a LH.
• This narrates bearish continuation: LH → LL → LH.
6. Trade Decision
• You can use the red triangle as your entry cue.
• The LH/LL narration gives you confidence that structure supports the short.
• Alerts can be set so you don’t miss the trigger.
7. Risk Management
• Stop placement: above the LH pivot or sweep high.
• Target: next liquidity pool below, or measured move.
🧭 How to Use This in Practice
• Gold label = liquidity event + ChoCh confirmation.
• Red triangle = actionable bearish reentry trigger.
• LH/LL narration = context for trend bias and trade management.
• Transparency slider = keep structure labels subtle so the chart stays clean.

52 Week High LowPurpose
This indicator plots the rolling **52-week high and low price levels** to highlight long-term breakout zones, major support/resistance bands, and trend structure used by position and swing traders.
## How It Works
The script dynamically calculates:
- The highest high over the last ~260 trading sessions (52-week high)
- The lowest low over the last ~260 trading sessions (52-week low)
- Visual bands that update in real time as price evolves
## Best Timeframe
Optimized for **daily charts** to reflect true yearly price ranges.
Can be adapted to other timeframes using the bar-count inputs.
## Trading Applications
✅ Breakout confirmation tool
✅ Long-term trend validation
✅ Relative strength filter alignment
✅ RRG and momentum cross-checks
✅ Swing trade zone identification
## How To Use
1. Apply to daily charts.
2. Track price interaction with the 52-week bands.
3. Look for:
- Breakouts above the high band for trend continuation
- Pullbacks toward the high band for retest entries
- Rejections at the low band as breakdown confirmation
⚠️ This indicator maps key price structure — it does **not predict directional outcomes**.
Always combine with volume or momentum confirmation.
---
## Mathematical Basis
Rolling extreme calculations based on:
- **Highest high over N bars**
- **Lowest low over N bars**
N defaults to **52 weeks × 5 sessions = 260 bars** for daily charts.
---
Developed for professional retail traders seeking institutional-grade structural tools.

SMC + OB + FVG + Reversal + UT Bot + Hull Suite – by Fatich.id🎯 7 INTEGRATED SYSTEMS:
✓ Mxwll Suite (SMC + Auto Fibs + CHoCH/BOS)
✓ UT Bot (Trend Signals + Label Management)
✓ Hull Suite (Momentum Analysis)
✓ LuxAlgo FVG (Fair Value Gaps)
✓ LuxAlgo Order Blocks (Volume Pivots) ⭐ NEW
✓ Three Bar Reversal (Pattern Recognition)
✓ Reversal Signals (Momentum Count Style)
⚡ KEY FEATURES:
• Smart Money Structure (CHoCH/BOS/I-CHoCH/I-BoS)
• Auto Fibonacci (10 customizable levels)
• Order Block Detection (Auto mitigation)
• Fair Value Gap Tracking
• Session Highlights (NY/London/Asia)
• Volume Activity Dashboard
• Multi-Timeframe Support
• Clean Label Management
🎨 PERFECT FOR:
• Smart Money Concept Traders
• Order Flow & Liquidity Analysis
• Support/Resistance Trading
• Trend Following & Reversals
• Multi-Timeframe Analysis
💡 RECOMMENDED SETTINGS:
Clean Charts: OB Count 3, UT Signals 3, FVG 5
Detailed Analysis: OB Count 5-10, All Signals
Scalping: Low sensitivity, Hull 20-30
Swing Trading: High sensitivity, Hull 55-100

Real Relative Strength Indicator### What is RRS (Real Relative Strength)?
RRS is a volatility-normalized relative strength indicator that shows you – in real time – whether your stock, crypto, or any asset is genuinely beating or lagging the broader market after adjusting for risk and volatility. Unlike the classic “price ÷ SPY” line that gets completely fooled by volatility regimes, RRS answers the only question that actually matters to professional traders:
“Is this ticker moving better (or worse) than the market on a risk-adjusted basis right now?”
It does this by measuring the excess momentum of your ticker versus a benchmark (SPY, QQQ, BTC, etc.) and then dividing that excess by the average volatility (ATR) of both instruments. The result is a clean, centered-around-zero oscillator that works the same way in calm markets, crash markets, or parabolic bull runs.
### How to Use the RRS Indicator (Aqua/Purple Area Version) in Practice
The indicator is deliberately simple to read once you know the rules:
Positive area (aqua) means genuine outperformance.
Negative area (purple) means genuine underperformance.
The farther from zero, the stronger the leadership or weakness.
#### Core Signals and How to Trade Them
- RRS crossing above zero → one of the highest-probability long signals in existence. The asset has just started outperforming the market on a risk-adjusted basis. Enter or add aggressively if price structure agrees.
- RRS crossing below zero → leadership is ending. Tighten stops, take partial or full profits, or flip short if you trade both sides.
- RRS above +2 (bright aqua area) → clear leadership. This is where the real money is made in bull markets. Trail stops, add on pullbacks, let winners run.
- RRS below –2 (bright purple area) → clear distribution or capitulation. Avoid new longs, consider short entries or protective puts.
- Extreme readings above +4 or below –4 (background tint appears) → rare, very high-conviction moves. Treat these like once-a-month opportunities.
- Divergence (not plotted here, but easy to spot visually): price making new highs while the aqua area is shrinking → distribution. Price making new lows while the purple area is shrinking → hidden buying and coming reversal.
#### Best Settings by Style and Asset Class
For stocks and ETFs: keep benchmark as SPY (or QQQ for tech-heavy names) and length 14–20 on daily/4H charts.
For crypto: change the benchmark to BTCUSD (or ETHUSD) immediately — otherwise the reading is meaningless. Length 10–14 works best on 1H–4H crypto charts because volatility is higher.
For day trading: drop length to 10–12 and use 15-minute or 5-minute charts. Signals are faster and still extremely clean.
#### Highest-Edge Setups (What Actually Prints Money)
- RRS crosses above zero while price is still below a major moving average (50 EMA, 200 SMA, etc.) → early leadership, often catches the exact bottom of a new leg up.
- RRS already deep aqua (+3 or higher) and price pulls back to support without RRS dropping below +1 → textbook add-on or re-entry zone.
- RRS deep purple and suddenly turns flat or starts curling up while price is still falling → hidden accumulation, usually the exact low tick.
That’s it. Master these few rules and the RRS becomes one of the most powerful edge tools you will ever use for rotation trading...

Daily ATR Dashboard - NIRALADaily ATR Dashboard: Volatility at a Glance
What is this?
The "Daily ATR Dashboard" is a simple, non-intrusive utility tool designed for intraday traders. It places a clean information table in the top-right corner of your chart, displaying the Daily Average True Range (DATR) for the current session and the previous two days.
Why is it useful?
Understanding daily volatility is crucial for setting realistic targets and stop-losses.
Know the Range: Instantly see how much the instrument typically moves in a day.
Context: Compare today's volatility with yesterday's and the day before to gauge if the market is expanding (becoming more volatile) or contracting (consolidating).
Clean Charts: Instead of plotting a messy ATR line indicator below your price action, this dashboard gives you the raw data you need without cluttering your workspace.
Features:
Real-Time Data: The "Today" row updates in real-time as the current daily candle develops.
Historical Context: Automatically fetches and displays the final DATR values for the previous two sessions ("Yesterday" and "Day Before").
Highlighted Current Day: The current day's data is highlighted in yellow for immediate visibility.
Customizable: You can adjust the ATR length (default is 14) and the text size to fit your screen perfectly.
How to Read It:
Today: The current volatility of the ongoing daily session.
Yesterday / Day Before: The finalized volatility of past sessions.
Tip: If "Today's" ATR is significantly lower than the previous days, expect potential expansion or a breakout soon. If it is significantly higher, the market may be overextended.
Settings:
DATR Length: The lookback period for the ATR calculation (Default: 14).
Text Size: Adjust the size of the table text (Tiny, Small, Normal, Large).

Morning ORB FVG Trigger✅ Overview
Morning ORB FVG Trigger is a complete intraday trading framework built around:
A Morning Opening Range Breakout (ORB)
The first Fair Value Gap (FVG) after that breakout
Strict risk management and position sizing
Optional HTF trend filter (Daily / Weekly / Monthly)
Optional Daily ATR filter to avoid extreme days
The script is designed for futures / indices / FX on intraday charts up to 15 minutes and for traders who want a clean, mechanical entry framework with clear risk.
🧠 Core idea
Define a morning opening range (e.g. 09:30–09:45).
Wait for a clean breakout above/below that range.
After the breakout, wait for the first FVG in breakout direction,
confirmed by the next candle (no immediate full reclaim).
Use a chosen stop logic + R:R factor to build risk/reward boxes.
Calculate position size based on your account risk.
(Optional) Only take trades:
In the direction of the HTF EMA trend (D/W/M).
On days where the morning range is within a band of the Daily ATR.
You can also disable all signals/boxes and use the script just as a visual ORB tool.
⏰ 1. ORB / Morning Range
Inputs (Main section)
Morning Range Session
Time window of the opening range in exchange time
Example: 09:30–09:45 for a 15-minute ORB.
You can type custom ranges (e.g. 09:30–09:35 for a 5-minute ORB).
Risk/Reward (TP factor)
Multiplier for the take-profit distance relative to the stop.
2.0 = TP is 2× the stop distance
1.5 = TP is 1.5× the stop distance
Show ORB range
If enabled, draws:
ORB high/low lines
ORB labels (e.g. 15min ORB high / low)
Optional midline
Extend ORB lines to the right (bars)
How many bars to extend the ORB high/low horizontally beyond the ORB itself.
Trade box width (bars)
Horizontal width (in bars) of:
Red risk box (entry–stop)
Green reward box (entry–TP)
Implementation details
The ORB is always calculated on 1-minute data internally, so it stays precise even on 5m/15m charts.
The script only works on intraday timeframes up to 15 minutes.
📦 2. FVG Block
Group: “FVG”
Threshold %
Minimum size of an FVG in % of price.
0 = every FVG
Higher values = only larger gaps
Auto threshold (from volatility)
If enabled, the minimum FVG size is derived from historical volatility
instead of a fixed percentage.
Allow breakout FVG partly inside ORB
Off (default): the FVG must lie fully outside the ORB.
On: the breakout FVG itself may still overlap the ORB a bit,
as long as it is the first one attached to the breakout move.
Enable FVG entry signals, boxes & alerts
On: full system – FVG detection, entry labels, risk/TP boxes, alerts.
Off: no entries, no risk/TP boxes, no alerts.
You only get the ORB and (optionally) the HTF dashboard, so you can trade your own setups.
Entry mode
Entry mode (Mid / Edge / NextOpen)
Mid – Entry at the midpoint of the FVG.
Edge – Long at the upper FVG edge, short at the lower FVG edge.
NextOpen – No limit order in the gap. Entry is placed at the next bar open after FVG confirmation.
Edge offset (ticks)
Additional offset for Edge entries:
Long:
+ticks = a bit above the FVG (more conservative)
-ticks = deeper into the FVG (more aggressive)
Short:
+ticks = a bit below the FVG
-ticks = deeper into the FVG
FVG detection logic
Uses a LuxAlgo-style 3-candle FVG pattern (gap between candle 1 and 3).
Only one FVG is taken: the first valid FVG after the ORB breakout in breakup direction.
The FVG candle is the middle bar; the script:
Detects the FVG on the previous bar.
Waits for the current bar to confirm it:
Bullish: current low must stay above the lower FVG boundary
Bearish: current high must stay below the upper FVG boundary
Only then an entry signal is generated.
🛑 3. Stop Logic
Group: “Stop Logic”
Stop mode (PrevBar / Pivot / FVG Candle)
PrevBar – Stop at the low/high of the candle before the FVG
(tight/aggressive).
FVG Candle – Stop at the low/high of the FVG candle itself
(medium).
Pivot – Stop at the most recent swing high/low
using pivotLeft / pivotRight pivots (more conservative).
Ticks (stop buffer)
Offset (in ticks) from the selected stop level.
> 0 = further away (more room, more risk)
< 0 = closer (tighter stop)
Pivot left / Pivot right
Number of candles left/right to define a swing high/low
when using Pivot stop mode.
Typical intraday values: 2–3.
The script also sanity-checks the stop:
if the calculated stop would be invalid (e.g. above entry in a long), it moves it by a minimal distance (2 ticks) to keep a valid risk.
📈 4. HTF Trend Filter (Daily / Weekly / Monthly)
Group: “HTF Trend Filter”
Enable HTF trend filter
If enabled, trades are only allowed:
Long when at least 2 of D/W/M closes are above their EMA
Short when at least 2 of D/W/M closes are below their EMA
EMA length (D/W/M)
EMA length for all three higher timeframes (Daily, Weekly, Monthly).
This helps focus entries in the direction of the dominant higher-timeframe trend.
📊 5. ATR Filter (Daily)
Group: “ATR Filter (Daily)”
Use daily ATR filter
If enabled, the height of the ORB (ORB high – ORB low) must be within
a band of the Daily ATR to allow any signals.
Daily ATR length
ATR period on the Daily timeframe.
Min ORB size vs ATR
Lower bound:
Example: 0.3 → ORB must be at least 0.3 × Daily ATR
0.0 = no minimum.
Max ORB size vs ATR
Upper bound:
Example: 1.5 → ORB must be ≤ 1.5 × Daily ATR
0.0 = no maximum.
If the ORB is too small (choppy) or too large (exhausted move), no breakout or FVG signal will be generated on that day.
🧭 6. HTF Dashboard & Signal Labels
Group: “HTF Trend Dashboard”
Show HTF dashboard
Draws a small label at the top of the chart showing:
HTF Trend (EMA X)
D: UP/FLAT/DOWN
W: UP/FLAT/DOWN
M: UP/FLAT/DOWN
Dashboard position
Top Right, Top Center, Top Left – places the dashboard at the top.
Over Risk Info – no top dashboard; instead, the HTF trend info is shown as a label near the risk box when a new signal appears.
Lookback (bars) for top anchor
How many bars to use to determine the top price level for dashboard placement.
Show HTF trend above risk box on signal
Only relevant if Dashboard position = Over Risk Info.
When enabled, a small HTF label appears near the risk box for each new trade.
Signal label vertical offset (ticks)
Vertical spacing between risk info label and HTF label.
Minimum spacing HTF/Risk (ticks)
Ensures a minimum vertical distance so the two labels don’t overlap.
HTF signal label X offset (bars)
Horizontal offset (left/right) relative to the risk info label.
⏳ 7. ORB–FVG Filters (Session & Time Window)
Group: “ORB FVG Filter”
Only same session day
If enabled, FVG entries are only allowed on the same calendar day
as the ORB. When the date changes, all state & drawings are reset.
Limit hours after ORB
Enables a time window after the ORB end.
Trading window after ORB (hours)
Length of that window in hours.
Example: 2.0 → FVG signals only in the first 2 hours after ORB end.
💰 8. Risk Management & Position Sizing
Group: “Risk Management”
Calculate position size
If enabled, the script computes suggested mini and micro contract size for you.
Account size
Your trading account size (in account currency).
Risk mode
Percent – risk is a % of account size (Account risk %).
Fixed amount – risk is a fixed dollar amount (Fixed risk ($)).
Account risk %
Risk per trade as a percentage of account size (e.g. 1.0 for 1%).
Fixed risk ($)
Fixed risk per trade in dollars when using Fixed amount mode.
Micro factor (vs mini)
How much a micro contract is worth relative to a mini.
Example:
0.1 → one micro moves 1/10 of one mini.
Risk Info label
For each new trade, a label is shown above the boxes with:
Stop distance in price and $ risk per mini
Max risk allowed for the trade
Suggested mini and micro size
Text like:
Suggested: 2 mini
Suggested: 5 micro
or Suggested: no trade
This makes the script especially useful for prop-firm rules or strict risk discipline.
🎨 9. Visual Style (Boxes, Labels, ORB Lines)
Group: “Box & Label Style (Trade)”
Label font size (Very small, Small, Normal, Large)
Entry label BG / text color
Stop label BG / text color
TP label BG / text color
Risk info BG / text color
Risk box color (entry–stop zone)
Reward box color (entry–TP zone)
Group: “ORB Style”
ORB high line color
ORB low line color
ORB line width
ORB label font size
ORB label background color
ORB label text color
Show ORB midline
ORB midline color / width / style (Solid / Dashed / Dotted)
⚠️ 10. Alerts
Group: “Alerts”
The script defines three alert conditions:
Long entry FVG breakout
Triggered when a new long signal appears.
Short entry FVG breakout
Triggered when a new short signal appears.
FVG entry (long/short)
Generic alert for any new signal (long or short).
To use them:
Add the indicator to the chart.
Open the Alerts dialog → “Condition”.
Select this script and one of the alert conditions.
Set your preferred expiration and notification settings.
Alerts only fire when Enable FVG entry signals, boxes & alerts is on.
🧩 11. How the trading logic flows (summary)
Build ORB on 1-minute data during the selected session.
Optionally reject the day if ORB is outside the ATR bounds.
Wait for a breakout (close above high or below low), respecting HTF trend filter.
After breakout, look for the first valid FVG in that direction:
Outside the ORB (unless breakout FVG allowed inside)
Confirmed by the next candle (no full reclaim)
Once confirmed:
Compute entry, stop, target.
Draw risk/reward boxes and all labels.
Optionally show HTF signal label over the risk info.
Trigger alerts if enabled.
If you disable FVG signals, only steps 1–3 (plus dashboard) are effectively active.
⚠️ 12. Notes & Disclaimer
Script is intended for intraday trading up to 15-minute timeframes.
All signals are mechanical and do not guarantee profitability.
Always backtest and forward-test on your own data before risking real money.
This script is for educational purposes only and is not financial advice.
🚀 Quick-start guide
Add the script to your chart
Use an intraday timeframe ≤ 15 minutes (1m, 3m, 5m, 15m).
Works best on liquid indices, futures, FX and large-cap stocks.
Set the Morning Range
In “Morning Range Session” choose the exchange’s opening window.
Examples
US index futures (CME): 08:30–08:45 or 08:30–08:35
US stocks (NYSE/Nasdaq): 09:30–09:45 or 09:30–09:35
The ORB is always calculated on 1-minute data internally, so the range stays accurate on higher intraday charts.
Keep the default filters at first
HTF Trend Filter: ON
EMA length = 20
This will only allow trades in the direction of the dominant D/W/M trend.
ATR Filter: OFF (optional; you can enable later once you’re comfortable).
Use the full trade system
In the FVG group leave
“Enable FVG entry signals, boxes & alerts” = ON
Entry mode: Mid
Stop mode: FVG Candle or PrevBar
Risk/Reward: 2.0 as a starting point.
Set your risk
Turn on “Calculate position size”.
Enter your Account size and choose either:
Risk mode = Percent (e.g. 1.0 = 1% per trade), or
Risk mode = Fixed amount (e.g. $250 per trade).
The risk info label will show:
Stop distance in price and $/contract
Max allowed risk
Suggested mini and micro contract size.
Enable alerts (optional)
Open the Alerts dialog → Condition: this script.
Choose one of:
Long entry FVG breakout
Short entry FVG breakout
FVG entry (long/short)
Choose “Once per bar” or “Once per bar close”, and your preferred notification type.
Replay & journal
Use the TradingView bar replay tool to step through past days.
Focus on:
How the ORB defines the structure.
How the first confirmed FVG outside the ORB behaves.
Whether the risk/TP levels fit your own style and product.
🎛 Recommended settings & profiles
These are starting points, not rules. Always adapt to the instrument and your own risk tolerance.
1. Conservative / Trend-following
Timeframe: 5m or 15m
Morning Range Session: 15-minute ORB around the cash or futures open
FVG
Threshold %: 0.05–0.1 (filter out very small gaps)
Auto threshold: OFF (keep it simple)
Allow breakout FVG partly inside ORB: OFF
Enable FVG entry signals/boxes/alerts: ON
Entry mode: Mid
Stop Logic
Stop mode: Pivot
Pivot left/right: 2–3
Stop buffer: +1–2 ticks
HTF Trend Filter
Enabled: ON
EMA length: 20
ATR Filter
Enabled: ON
Daily ATR length: 14
Min ORB vs ATR: 0.3–0.4
Max ORB vs ATR: 1.2–1.5
Risk Management
Risk mode: Percent
Account risk: 0.5–1.0%
Idea: Only trade when the higher-timeframe trend supports the move and the opening range is of a “normal” size for the current volatility.
2. Balanced / Intraday directional
Timeframe: 3m or 5m
FVG
Threshold %: 0.02–0.05
Auto threshold: ON (lets the script adapt to volatility)
Allow breakout FVG partly inside ORB: ON
(first breakout FVG may partly sit inside the ORB)
Entry mode: Edge
Edge offset (ticks): 0 or +1
Stop Logic
Stop mode: FVG Candle
Stop buffer: 0–1 ticks
HTF Trend Filter
Enabled: ON
ATR Filter
Enabled: OFF (optional)
Risk Management
Risk mode: Percent
Account risk: 1.0–1.5% (if this fits your plan)
Idea: Slightly more aggressive entries at the gap edge, still aligned with HTF trend, but with more flexibility on ATR.
3. Aggressive / Scalping around the ORB
Timeframe: 1m or 3m
FVG
Threshold %: 0.0–0.02
Auto threshold: ON
Allow breakout FVG partly inside ORB: ON
Entry mode: NextOpen or Edge with a negative offset (deeper into the gap)
Stop Logic
Stop mode: PrevBar
Stop buffer: 0 or -1 tick
HTF Trend Filter
Enabled: OFF (or ON but treat as soft guidance)
ATR Filter
Enabled: OFF
Risk Management
Risk mode: Percent
Account risk: lower, e.g. 0.25–0.5% per trade
Idea: More trades and tighter stops. Best for experienced traders who understand the limitations of scalping and whipsaw risk.
Final reminder
All of these are templates, not guarantees:
Always check how the system behaves on your market and session.
Start on replay and demo before trading real money.
Adjust filters (HTF, ATR, thresholds) until the signals fit your personal approach.
