CoffeeShopCrypto Supply Demand PPO AdvancedCoffeeShopCrypto PPO Advanced is a structure-aware momentum oscillator and price-trend overlay designed to help traders interpret momentum strength, exhaustion, and continuation across evolving market conditions. It’s not a “buy/sell” signal tool — it's a momentum context tool that helps confirm trend intent.
Original Code derived from the Price Oscillator Indicators (PPO) found in the TradingView Technical Indicators categories. You can view the info and calculation for the original PPO here
www.tradingview.com
Much like the MACD, the PPO uses a couple lagging indicators to present Momentum as a percentage. But it lacks context to market structure.
What It’s Based On
This tool is based on a dual-moving-average PPO oscillator structure (Percentage Price Oscillator) enhanced by:
Oscillator pivot structure: detection of Lower Highs (LH) and Higher Lows (HL) inside the oscillator.
Detection of Supply and Demand Trends via Market Absorption
Ability to transfer its average plots to price action
Detection of Trend Exhaustion
Real-time price-based exhaustion levels: projecting potential future supply and demand using trendlines from weakening momentum.
Integrated fast and slow Moving Averages on price using the same inputs as the oscillator, to visualize alignment between short- and long-term trends.
These elements combine momentum context with price action in a visual, intuitive system.
How It Works
1. Oscillator Structure
LHs (above zero): momentum weakening in uptrends.
HLs (below zero): momentum strengthening in downtrends.
Only valid pivots are shown (e.g., an LH must be preceded by a valid LL).
2. Exhaustion Levels
Green demand lines: price is making new lows, but oscillator prints HL → potential exhaustion.
Red supply lines: price is making new highs, but oscillator prints LH → potential exhaustion.
These lines are future-facing, projecting likely reaction zones based on momentum weakening.
3. Moving Averages on Price
Two MAs are drawn on the price chart:
Fast MA (same length as PPO short input)
Slow MA (same length as PPO long input)
These are not signal lines — they're visual guides for trend alignment.
MA crossover = PO crosses zero. This indicates short- and long-term momentum are syncing — a powerful signal of trend conviction.
When price is above both MAs, and the PO is rising above zero, bullish momentum is dominant.
When price is below both MAs, and the PO is falling below zero, bearish momentum dominates.
How Traders Can Use It
✅ Spot Trend Initiation
Wait for clear trend confirmation in price.
Use PPO Momentum+ to confirm momentum structure is aligned (e.g., HH/HL in oscillator + price above both MAs).
🔁 Track Continuations
In uptrends, look for oscillator HH and HL sequences with price holding above both MAs.
In downtrends, seek LL and LH sequences with price below both MAs.
⚠️ Watch for Exhaustion
Price breaking below red (supply) lines after oscillator LH = bearish exhaustion signal.
Price breaking above green (demand) lines after oscillator HL = bullish exhaustion signal.
These levels act like pre-mapped S/R zones, showing where momentum previously failed and price may react.
Why This Is Different
Momentum tools often lag or mislead when used blindly. This tool visualizes structural failure in momentum and maps potential outcomes. The integration of oscillator and price-based tools ensures traders are always reading context, not just raw signals.
Demand Trendlines
Demand trendlines show us Wykoff's law of "Absorbed Supply Reversal" In real time.
When aggressive selling pressure is persistently absorbed by passive buying interest without significant downward price continuation, and supply becomes exhausted, the market structure shifts as demand regains control—resulting in a directional reversal to the upside.
This commonly happens in a 3 phase interaction of price.
1. Selling pressure is absorbed quickly by buyers.
This PPO tool will calculate the trend of this absorption process
2. After there is a notable Bearish Exhaustion of price action, the PPO tool will draw a trendline of this absorption showing us the potential future prices where aggressive buyers will want to step in at lower prices.
3. After higher lows are defined in the oscillator, you'll see prices react in a strong bullish pattern at this trendline where aggressive buyers stepped in to reverse price action to the upside.
Supply Trendlines
Supply trendlines show us Wykoff's law of "Absorbed Demand Reversal" In real time.
When aggressive buying pressure is persistently absorbed by passive selling interest without significant downward price continuation, and demand becomes exhausted, the market structure shifts as supply regains control—resulting in a directional reversal to the downside.
This commonly happens in a 3 phase interaction of price.
1. Buying pressure is absorbed quickly by sellers.
This PPO tool will calculate the trend of this absorption process.
2. After there is a notable Bullish Exhaustion of price action, the PPO tool will draw a trendline of this absorption showing us the potential future prices where aggressive sellers will want to step in at higher prices.
3. After lower highs are defined in the oscillator, you'll see prices react in a strong bearish pattern at this trendline where aggressive sellers stepped in to reverse price action to the downside.
Lower High and Higher Low Signals
When the oscillator signals Lower Highs or High Lows its only noting that momentum in that trend direction is slowing. THis indicates a coming pause in the market and the proceeding longs of an uptrend or shorts of a downtrend should be taken with caution.
**These LH and HL markers are not reading as divergences in price vs momentum.**
They are simply registering against the highs and lows of itself..
Moving Averages on Price Action
The Oscillator will cross over its ZERO level the same time your Short and Long MAs cross each other. This will indicate that the short term average trend is moving ahead of the long term.
Crossovers are not an entry signal. It's a method in determining you current timeframe trend strength. Always observe price action as it passes through each of your moving averages and compare it to the positioning and direction of the oscillator.
If price dips in between the moving averages while the oscillator still shows a strong trend strength, you can wait for price to move ahead of your fast moving average.
Bar Colors and Signal Line for Trend Strength
Good Bullish Trend = Oscillator above zero + Signal rising below Oscillator
Weak Bullish Trend = Oscillator above zero + Signal above Oscillator
Good Bearish Trend = Oscillator below zero + Signal falling above Oscillator
Weak Bearish Trend = Oscillator below zero + Signal below Oscillator
Bar Colors
Bars are colored to match Oscillator Momentum Strength. Colors are set by user.
Why alter the known PPO (Percentage Price Oscillator) in this manner?
The PPO tool is great for measuring the strength as percentage of price action over and average amount of candles however, with these changes,
you know have the ability to correlate:
Wycoff theory of supply and demand,
Measure the depth of reversals and pullback by price positioning against moving averages,
Project potential reversal and exhaustion pricing,
Visibly note the structure of momentum much like you would note market structure,
Its not enough to know there is momentum. Its better to know
A) Is it enough
B) Is there something in the way which will cause price to push back
C) Does this momentum correlate to the prevailing trend
Cari dalam skrip untuk "crossover债券是什么"

Hull Moving Average with Cloud📈 Hull Moving Average with Cloud – Adaptive Trend Visualization
This indicator combines the power of the Hull Moving Average (HMA) with a visual signal line and trend cloud, giving traders a clearer view of market direction, momentum shifts, and potential reversals.
🔍 Key Features:
Dynamic HMA Length (optional): Adjusts the HMA period based on ATR volatility, allowing the moving average to adapt to changing market conditions.
Custom Smoothing Options: Smooth the main HMA with your choice of SMA, EMA, or WMA for a tailored trend line.
Signal Line (Orange HMA): A shorter-period Hull MA that acts as a trigger line for crossovers and trend changes.
Color-Coded Trend Cloud:
🟩 Green Cloud: Bullish – main HMA is above the signal HMA.
🟥 Red Cloud: Bearish – main HMA is below the signal HMA.
Real-Time Trend Coloring: Both lines dynamically change color based on slope (green for rising, red/purple for falling).
Offset Capability: Shift the HMA forward to visualize trend development and potential future direction.
✅ Use Cases:
Identify trend direction with cloud coloration.
Spot early reversals through HMA crossover signals.
Filter trades with volatility-aware moving average responsiveness.

MA cross X MAdiff<>atrfilter)📈 MA cross X MAdiff<>ATR filter
Smarter Trend Confirmation Using Adaptive Volatility Thresholds
🔍 What It Does
This indicator upgrades classic moving average crossovers by adding volatility awareness via ATR filtering. Instead of reacting to every small crossover, it waits for the distance between two moving averages to exceed a volatility-adjusted threshold, making signals more meaningful and less noisy.
⚙️ Core Logic
Calculates the difference between a Fast MA and a Slow MA.
Uses Average True Range (ATR) as a dynamic volatility filter.
Confirms trend only when MA difference exceeds:
diff > ATR × multiplier → Bullish
diff < -ATR × multiplier → Bearish
Otherwise: Neutral (gray zone)
The gray zone avoids false signals by detecting indecision or choppy markets.
🧠 Customizable Inputs
Choose any MA type independently for Fast and Slow:
SMA, EMA, WMA, VWMA, RMA, DEMA, TEMA, LSMA, Kijun
Control sensitivity via:
ATR Length
ATR Multiplier
✅ Why It Works
Reduces fake outs in ranging markets.
Adapts to volatility automatically.
Fully customizable for any asset or style.
Ideal for trend traders, momentum entries, or as a confluence layer.
Express Generator StrategyExpress Generator Strategy
Pine Script™ v6
The Express Generator Strategy is an algorithmic trading system that harnesses confluence from multiple technical indicators to optimize trade entries and dynamic risk management. Developed in Pine Script v6, it is designed to operate within a user-defined backtesting period—ensuring that trades are executed only during chosen historical windows for targeted analysis.
How It Works:
- Entry Conditions:
The strategy relies on a dual confirmation approach:- A moving average crossover system where a fast (default 9-period SMA) crossing above or below a slower (default 21-period SMA) average signals a potential trend reversal.
- MACD confirmation; trades are only initiated when the MACD line crosses its signal line in the direction of the moving average signal.
- An RSI filter refines these signals by preventing entries when the market might be overextended—ensuring that long entries only occur when the RSI is below an overbought level (default 70) and short entries when above an oversold level (default 30).
- Risk Management & Dynamic Position Sizing:
The strategy takes a calculated approach to risk by enabling the adjustment of position sizes using:- A pre-defined percentage of equity risk per trade (default 1%, adjustable between 0.5% to 3%).
- A stop-loss set in pips (default 100 pips, with customizable ranges), which is then adjusted by market volatility measured through the ATR.
- Trailing stops (default 50 pips) to help protect profits as the market moves favorably.
This combination of volatility-adjusted risk and equity-based position sizing aims to harmonize trade exposure with prevailing market conditions.
- Backtest Period Flexibility:
Users can define the start and end dates for backtesting (e.g., January 1, 2020 to December 31, 2025). This ensures that the strategy only opens trades within the intended analysis window. Moreover, if the strategy is still holding a position outside this period, it automatically closes all trades to prevent unwanted exposure.
- Visual Insights:
For clarity, the strategy plots the fast (blue) and slow (red) moving averages directly on the chart, allowing for visual confirmation of crossovers and trend shifts.
By integrating multiple technical indicators with robust risk management and adaptable position sizing, the Express Generator Strategy provides a comprehensive framework for capturing trending moves while prudently managing downside risk. It’s ideally suited for traders looking to combine systematic entries with a disciplined and dynamic risk approach.

LinReg Heikin Ashi CandlesLinear Regression Heikin Ashi Candles will dramatically change how the candlesticks on your chart will appear. This script creates Heikin Ashi candles from the existing candlesticks and then applies wickless Linear Regression candles as an overlay. The result is an ultra smoothed 'Renko-like' chart that remains time-based and responsive.
Key Features:
Heikin Ashi Base: Provides a smoother representation of price trends by filtering out noise.
Linear Regression Candles on Heikin Ashi: Plots Linear Regression lines as candles on the Heikin Ashi chart, potentially highlighting the immediate trend direction and momentum within the smoothed data. Wicks are intentionally removed for a clearer focus on the linear progression.
Tillson T3 Moving Averages: Includes fast and slow T3 Moving Averages with customizable length and alpha. These smoothed moving averages can help identify trend direction and potential crossover signals. Users can toggle their visibility.
Volatility Bands: Integrates Volatility Bands based on Average True Range (ATR) with customizable length, ATR type (RMA, SMA, EMA, WMA), and inner/outer multipliers. These bands help gauge price volatility and potential reversal zones. Users can toggle the visibility of the basis line.
Customizable Colors: Allows users to customize the colors of the Linear Regression Heikin Ashi bullish and bearish candles.
How to Use:
This is an overlay on your chart so you'll need to 'hide' the existing candlesticks on your chart.
This indicator can be used on any timeframe from seconds to days to quickly identify market trend, gauge volatility, and potentially find entry/exit points. Consider looking for confluence between the candle color/direction, T3 MA crossovers, and price interaction with the Volatility Bands.
Note: This indicator plots Linear Regression directly on Heikin Ashi candles, removing wicks for a focus on the linear trend within the smoothed data. Adjust the input parameters to suit your trading style and the specific market conditions.
HUGE CREDIT to ugurvu who originally created the Linear Regression Candles indicator that my indicator pulls code from.
Kitty PMO [theUltimator5]Kitty PMO is a momentum analysis tool designed to visually track and interpret the Price Momentum Oscillator (PMO) — with stylistic influence inspired by the charting approach made popular by “theRoaringKitty.” It aims to offer clear, actionable momentum signals directly overlaid on the chart without clutter or ambiguity, making it ideal for traders who prioritize simplicity and signal clarity.
At its core, the indicator calculates the PMO by applying a custom recursive smoothing function to the rate of change (ROC) of price. This smoothed momentum measure is then:
Amplified by a scaling factor (×10),
Further smoothed using user-defined parameters,
Compared against a signal line (EMA of PMO),
And tracked with a secondary moving average (PMO MA) to capture medium-term trend inflections.
While the PMO and its associated signal lines can optionally be plotted, the indicator primarily emphasizes crossovers between the PMO MA and the other two components. When the PMO MA crosses above both the PMO and signal line, a green upward arrow (↑) is plotted below the price. When it crosses below both, a red downward arrow (↓) appears above the price — making it easy to spot potential turning points in momentum.
Additionally, a floating info table can be toggled on to display all current user-defined parameters in a clean, resizable format. This makes the script ideal not just for technical execution but also for real-time strategy tuning and tracking across multiple timeframes.
The script includes optional alerts so you can be notified the moment a key crossover signal is triggered, without needing to keep your eyes glued to the screen.
[SM-042] EMA 5-8-13 with ADX FilterWhat is the strategy?
The strategy combines three exponential moving averages (EMAs) — 5, 8, and 13 periods — with an optional ADX (Average Directional Index) filter. It is designed to enter long or short positions based on EMA crossovers and to exit positions when the price crosses a specific EMA. The ADX filter, if enabled, adds a condition that only allows trades when the ADX value is above a certain threshold, indicating trend strength.
Who is it for?
This strategy is for traders leveraging EMAs and trend strength indicators to make trade decisions. It can be used by anyone looking for a simple trend-following strategy, with the flexibility to adjust for trend strength using the ADX filter.
When is it used?
- **Long trades**: When the 5-period EMA crosses above the 8-period EMA, with an optional ADX condition (if enabled) that requires the ADX value to be above a specified threshold.
- **Short trades**: When the 5-period EMA crosses below the 8-period EMA, with the ADX filter again optional.
- **Exits**: The strategy exits a long position when the price falls below the 13-period EMA and exits a short position when the price rises above the 13-period EMA.
Where is it applied?
This strategy is applied on a chart with any asset on TradingView, with the EMAs and ADX plotted for visual reference. The strategy uses `strategy.entry` to open positions and `strategy.close` to close them based on the set conditions.
Why is it useful?
This strategy helps traders identify trending conditions and filter out potential false signals by using both EMAs (to capture short-term price movements) and the ADX (to confirm the strength of the trend). The ADX filter can be turned off if not desired, making the strategy flexible for both trending and range-bound markets.
How does it work?
- **EMA Crossover**: The strategy enters a long position when the 5-period EMA crosses above the 8-period EMA, and enters a short position when the 5-period EMA crosses below the 8-period EMA.
- **ADX Filter**: If enabled, the strategy checks whether the ADX value is above a set threshold (default is 20) before allowing a trade.
- **Exit Conditions**: Long positions are closed when the price falls below the 13-period EMA, and short positions are closed when the price rises above the 13-period EMA.
- **Plotting**: The strategy plots the three EMAs and the ADX value on the chart for visualization. It also displays a horizontal line at the ADX threshold.
This setup allows for clear decision-making based on the interaction between different time-frame EMAs and trend strength as indicated by ADX.

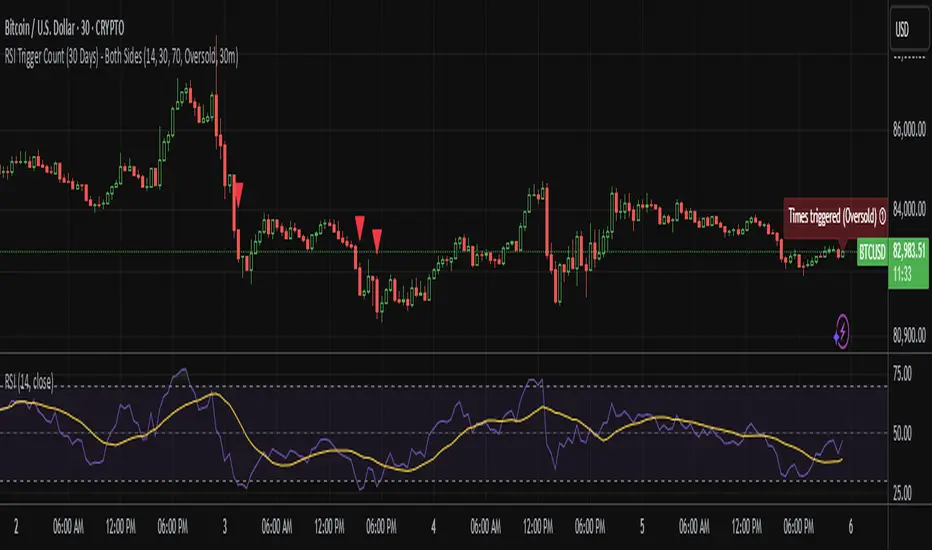
RSI Trigger Count (30 Days) - Both SidesRSI Dual Trigger Counter (30 Days)
This indicator tracks both oversold ( crossunder ) and overbought ( crossover ) RSI events on a 30-minute chart, featuring:
Dual-Mode Selector:
Counts either RSI < 30 (oversold) or RSI > 70 (overbought) crossings
Toggle between modes via input menu
30-Day Rolling Count:
Displays total triggers in the last 30 days (e.g., "Times triggered (Oversold) ① 19")
Visual Alerts:
Red triangles ↓ for oversold crossunders
Green triangles ↑ for overbought crossovers
Customizable:
Adjustable RSI length (2-100) and thresholds (1-100)
Works on any timeframe (auto-scales calculations)
Purpose: Identifies frequent reversal signals for both buying dips (oversold) and selling rallies (overbought).
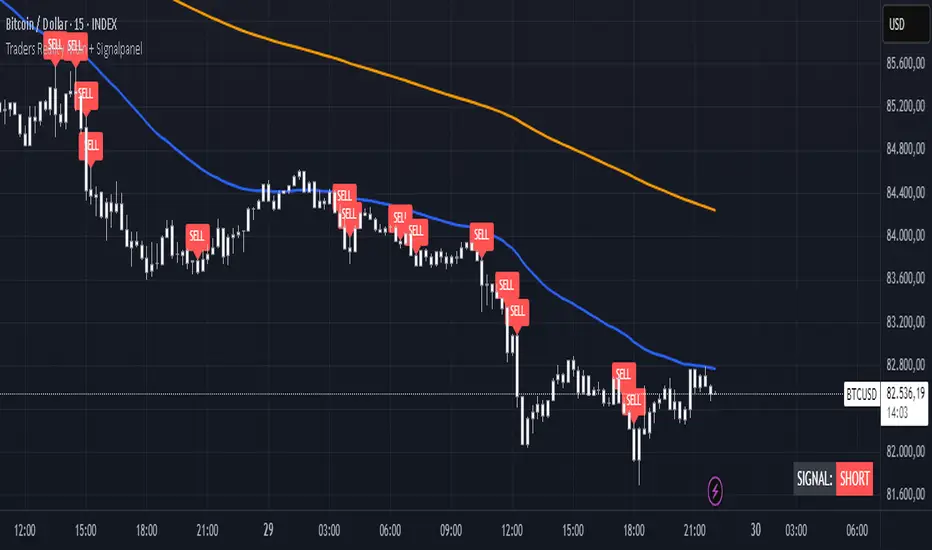
TR Buy/Sell Signal PanelI scripted this with chatgpt have fun guys
📊 TR Buy/Sell Signal Panel – Smart Trade Signals with Visual Clarity
The TR Buy/Sell Signal Panel is a standalone indicator inspired by the powerful Traders Reality (TR) methodology.
It detects potential long and short trade setups using classic market behavior patterns such as volume spikes, EMA crossovers, and session-based timing – all visualized cleanly and statically on your chart.
✅ Key Features
Buy Signals (LONG):
Green PVSRA candle (strong bullish candle with momentum)
EMA13 crossing above EMA50
Volume spike (current volume exceeds 20-period average × multiplier)
Triggered only during London or New York trading sessions (UTC)
Sell Signals (SHORT):
Red PVSRA candle (strong bearish move)
EMA13 crossing below EMA50
Volume spike
Also restricted to active session times
📌 Visual Components
Green/Red arrows on the chart indicate Buy/Sell entries
A static info panel in the bottom-right corner displays all signal conditions:
PVSRA active ✅
Volume Spike ✅
EMA Crossover ✅
Session Time ✅
Last Signal: 🟢 BUY / 🔴 SELL
Current Direction: 🟢 LONG / 🔴 SHORT / ❌ NONE
⚙️ Fully Customizable
Adjustable volume spike multiplier
Optional toggle for showing/hiding short signals
Extremely user-friendly layout – ideal for both beginners & experienced traders
📦 Best For:
Scalpers & Intraday Traders
Traders who follow the Traders Reality / Market Maker Method
Anyone who values clean, rule-based trade entries
Note: Works across all timeframes with sufficient volume (e.g., 5min – 4hr). Sessions are based on UTC time – adjust if needed based on your timezone or trading hours.
Volume Weighted RSI (VW RSI)The Volume Weighted RSI (VW RSI) is a momentum oscillator designed for TradingView, implemented in Pine Script v6, that enhances the traditional Relative Strength Index (RSI) by incorporating trading volume into its calculation. Unlike the standard RSI, which measures the speed and change of price movements based solely on price data, the VW RSI weights its analysis by volume, emphasizing price movements backed by significant trading activity. This makes the VW RSI particularly effective for identifying bullish or bearish momentum, overbought/oversold conditions, and potential trend reversals in markets where volume plays a critical role, such as stocks, forex, and cryptocurrencies.
Key Features
Volume-Weighted Momentum Calculation:
The VW RSI calculates momentum by comparing the volume associated with upward price movements (up-volume) to the volume associated with downward price movements (down-volume).
Up-volume is the volume on bars where the closing price is higher than the previous close, while down-volume is the volume on bars where the closing price is lower than the previous close.
These volumes are smoothed over a user-defined period (default: 14 bars) using a Running Moving Average (RMA), and the VW RSI is computed using the formula:
\text{VW RSI} = 100 - \frac{100}{1 + \text{VoRS}}
where
\text{VoRS} = \frac{\text{Average Up-Volume}}{\text{Average Down-Volume}}
.
Oscillator Range and Interpretation:
The VW RSI oscillates between 0 and 100, with a centerline at 50.
Above 50: Indicates bullish volume momentum, suggesting that volume on up bars dominates, which may signal buying pressure and a potential uptrend.
Below 50: Indicates bearish volume momentum, suggesting that volume on down bars dominates, which may signal selling pressure and a potential downtrend.
Overbought/Oversold Levels: User-defined thresholds (default: 70 for overbought, 30 for oversold) help identify potential reversal points:
VW RSI > 70: Overbought, indicating a possible pullback or reversal.
VW RSI < 30: Oversold, indicating a possible bounce or reversal.
Visual Elements:
VW RSI Line: Plotted in a separate pane below the price chart, colored dynamically based on its value:
Green when above 50 (bullish momentum).
Red when below 50 (bearish momentum).
Gray when at 50 (neutral).
Centerline: A dashed line at 50, optionally displayed, serving as the neutral threshold between bullish and bearish momentum.
Overbought/Oversold Lines: Dashed lines at the user-defined overbought (default: 70) and oversold (default: 30) levels, optionally displayed, to highlight extreme conditions.
Background Coloring: The background of the VW RSI pane is shaded red when the indicator is in overbought territory and green when in oversold territory, providing a quick visual cue of potential reversal zones.
Alerts:
Built-in alerts for key events:
Bullish Momentum: Triggered when the VW RSI crosses above 50, indicating a shift to bullish volume momentum.
Bearish Momentum: Triggered when the VW RSI crosses below 50, indicating a shift to bearish volume momentum.
Overbought Condition: Triggered when the VW RSI crosses above the overbought threshold (default: 70), signaling a potential pullback.
Oversold Condition: Triggered when the VW RSI crosses below the oversold threshold (default: 30), signaling a potential bounce.
Input Parameters
VW RSI Length (default: 14): The period over which the up-volume and down-volume are smoothed to calculate the VW RSI. A longer period results in smoother signals, while a shorter period increases sensitivity.
Overbought Level (default: 70): The threshold above which the VW RSI is considered overbought, indicating a potential reversal or pullback.
Oversold Level (default: 30): The threshold below which the VW RSI is considered oversold, indicating a potential reversal or bounce.
Show Centerline (default: true): Toggles the display of the 50 centerline, which separates bullish and bearish momentum zones.
Show Overbought/Oversold Lines (default: true): Toggles the display of the overbought and oversold threshold lines.
How It Works
Volume Classification:
For each bar, the indicator determines whether the price movement is upward or downward:
If the current close is higher than the previous close, the bar’s volume is classified as up-volume.
If the current close is lower than the previous close, the bar’s volume is classified as down-volume.
If the close is unchanged, both up-volume and down-volume are set to 0 for that bar.
Smoothing:
The up-volume and down-volume are smoothed using a Running Moving Average (RMA) over the specified period (default: 14 bars) to reduce noise and provide a more stable measure of volume momentum.
VW RSI Calculation:
The Volume Relative Strength (VoRS) is calculated as the ratio of smoothed up-volume to smoothed down-volume.
The VW RSI is then computed using the standard RSI formula, but with volume data instead of price changes, resulting in a value between 0 and 100.
Visualization and Alerts:
The VW RSI is plotted with dynamic coloring to reflect its momentum direction, and optional lines are drawn for the centerline and overbought/oversold levels.
Background coloring highlights overbought and oversold conditions, and alerts notify the trader of significant crossings.
Usage
Timeframe: The VW RSI can be used on any timeframe, but it is particularly effective on intraday charts (e.g., 1-hour, 4-hour) or daily charts where volume data is reliable. Shorter timeframes may require a shorter length for increased sensitivity, while longer timeframes may benefit from a longer length for smoother signals.
Markets: Best suited for markets with significant and reliable volume data, such as stocks, forex, and cryptocurrencies. It may be less effective in markets with low or inconsistent volume, such as certain futures contracts.
Trading Strategies:
Trend Confirmation:
Use the VW RSI to confirm the direction of a trend. For example, in an uptrend, look for the VW RSI to remain above 50, indicating sustained bullish volume momentum, and consider buying on pullbacks when the VW RSI dips but stays above 50.
In a downtrend, look for the VW RSI to remain below 50, indicating sustained bearish volume momentum, and consider selling on rallies when the VW RSI rises but stays below 50.
Overbought/Oversold Conditions:
When the VW RSI crosses above 70, the market may be overbought, suggesting a potential pullback or reversal. Consider taking profits on long positions or preparing for a short entry, but confirm with price action or other indicators.
When the VW RSI crosses below 30, the market may be oversold, suggesting a potential bounce or reversal. Consider entering long positions or covering shorts, but confirm with additional signals.
Divergences:
Look for divergences between the VW RSI and price to spot potential reversals. For example, if the price makes a higher high but the VW RSI makes a lower high, this bearish divergence may signal an impending downtrend.
Conversely, if the price makes a lower low but the VW RSI makes a higher low, this bullish divergence may signal an impending uptrend.
Momentum Shifts:
A crossover above 50 can signal the start of bullish momentum, making it a potential entry point for long trades.
A crossunder below 50 can signal the start of bearish momentum, making it a potential entry point for short trades or an exit for long positions.
Example
On a 4-hour SOLUSDT chart:
During an uptrend, the VW RSI might rise above 50 and stay there, confirming bullish volume momentum. If it approaches 70, it may indicate overbought conditions, as seen near a price peak of 145.08, suggesting a potential pullback.
During a downtrend, the VW RSI might fall below 50, confirming bearish volume momentum. If it drops below 30 near a price low of 141.82, it may indicate oversold conditions, suggesting a potential bounce, as seen in a slight recovery afterward.
A bullish divergence might occur if the price makes a lower low during the downtrend, but the VW RSI makes a higher low, signaling a potential reversal.
Limitations
Lagging Nature: Like the traditional RSI, the VW RSI is a lagging indicator because it relies on smoothed data (RMA). It may not react quickly to sudden price reversals, potentially missing the start of new trends.
False Signals in Ranging Markets: In choppy or ranging markets, the VW RSI may oscillate around 50, generating frequent crossovers that lead to false signals. Combining it with a trend filter (e.g., ADX) can help mitigate this.
Volume Data Dependency: The VW RSI relies on accurate volume data, which may be inconsistent or unavailable in some markets (e.g., certain forex pairs or futures contracts). In such cases, the indicator’s effectiveness may be reduced.
Overbought/Oversold in Strong Trends: During strong trends, the VW RSI can remain in overbought or oversold territory for extended periods, leading to premature exit signals. Use additional confirmation to avoid exiting too early.
Potential Improvements
Smoothing Options: Add options to use different smoothing methods (e.g., EMA, SMA) instead of RMA for the up/down volume calculations, allowing users to adjust the indicator’s responsiveness.
Divergence Detection: Include logic to detect and plot bullish/bearish divergences between the VW RSI and price, providing visual cues for potential reversals.
Customizable Colors: Allow users to customize the colors of the VW RSI line, centerline, overbought/oversold lines, and background shading.
Trend Filter: Integrate a trend strength filter (e.g., ADX > 25) to ensure signals are generated only during strong trends, reducing false signals in ranging markets.
The Volume Weighted RSI (VW RSI) is a powerful tool for traders seeking to incorporate volume into their momentum analysis, offering a unique perspective on market dynamics by emphasizing price movements backed by significant trading activity. It is best used in conjunction with other indicators and price action analysis to confirm signals and improve trading decisions.

Quantum Motion Oscillator-QMO (TechnoBlooms)Quantum Motion Oscillator (QMO) is a momentum indicator designed for traders who demand precision. Combining multi-timeframe weighted linear regression with EMA crossovers, QMO offers a dynamic view of market momentum, helping traders anticipate trend shifts with greater accuracy.
This oscillator is inspired by quantum mechanics and wave theory, where market movement is seen as a series of probabilistic waves rather than rigid structures.
The histogram is plotted in proportion to the price movement of the candlesticks.
KEY FEATURES
1. Multi-Timeframe Histogram - Integrates 1 to 5 weighted linear regression averages, reducing lag while maintaining accuracy.
2. EMA Crossover Signal - Uses a Short and Long EMA to confirm trend shifts with minimal noise.
3. Adaptive Trend Analysis - Self-adjusting mechanics make QMO effective in both ranging and trending markets.
4. Scalable for Different Trading Styles - Works seamlessly for scalping, intraday, swing and position trading.
ADVANCED PROFESSIONAL INSIGHTS
1. Wave Dynamics and Market Flow - Inspired by wave mechanics, QMO reflects the energy accumulation and dissipation in price movements.
Expanding histogram waves = Strong momentum surge
Contracting waves = Momentum weakening, potential reversal zone.
2. Liquidity and Order Flow Applications - QMO works well alongside liquidity concepts and smart money techniques:
Combine with Fair Value Gaps & Order Blocks -> Enter when QMO signals align with liquidity zones.
Avoid False Moves - If price sweeps liquidity, but QMO momentum diverges, it is a sign of potential smart money manipulation.

IWMA - DolphinTradeBot1️⃣ WHAT IS IT ?
▪️ The Inverted Weighted Moving Average (IWMA) is the reversed version of WMA, where older prices receive higher weights, while recent prices receive lower weights. As a result, IWMA focuses more on past price movements while reducing sensitivity to new prices.
2️⃣ HOW IS IT WORK ?
🔍 To understand the IWMA(Inverted Weighted Moving Average) indicator, let's first look at how WMA (Weighted Moving Average) is calculated.
LET’S SAY WE SELECTED A LENGTH OF 5, AND OUR CURRENT CLOSING VALUES ARE .
▪️ WMA Calculation Method
When calculating WMA, the most recent price gets the highest weight, while the oldest price gets the lowest weight.
The Calculation is ;
( 10 ×1)+( 12 ×2)+( 21 ×3)+( 24 ×4)+( 38 ×5) = 10+24+63+96+190 = 383
1+2+3+4+5 = 15
WMA = 383/15 ≈ 25.53
WMA = ta.wma(close,5) = 25.53
▪️ IWMA Calculation Method
The Inverted Weighted Moving Average (IWMA) is the reversed version of WMA, where older prices receive higher weights, while recent prices receive lower weights. As a result, IWMA focuses more on past price movements while reducing sensitivity to new prices.
The Calculation is ;
( 10 ×5)+( 12 ×4)+( 21 ×3)+( 24 ×2)+( 38 ×1) = 50+48+63+48+38 = 247
1+2+3+4+5 = 15
IWMA = 247/15 ≈ 16.46
IWMA = iwma(close,5) = 16.46
3️⃣ SETTINGS
in the indicator's settings, you can change the length and source used for calculation.
With the default settings, when you first add the indicator, only the iwma will be visible. However, to observe how much it differs from the normal wma calculation, you can enable the "show wma" option to see both indicators with the same settings or you can enable the Show Signals to see IWMA and WMA crossover signals .
4️⃣ 💡 SOME IDEAS
You can use the indicator for support and resistance level analysis or trend analysis and reversal detection with short and long moving averages like regular moving averages.
Another option is to consider whether the iwma is above or below the normal wma or to evaluate the crossovers between wma and iwma.

TMO (True Momentum Oscillator)TMO ((T)rue (M)omentum (O)scilator)
Created by Mobius V01.05.2018 TOS Convert to TV using Claude 3.7 and ChatGPT 03 Mini :
TMO calculates momentum using the delta of price. Giving a much better picture of trend, tend reversals and divergence than momentum oscillators using price.
True Momentum Oscillator (TMO)
The True Momentum Oscillator (TMO) is a momentum-based technical indicator designed to identify trend direction, trend strength, and potential reversal points in the market. It's particularly useful for spotting overbought and oversold conditions, aiding traders in timing their entries and exits.
How it Works:
The TMO calculates market momentum by analyzing recent price action:
Momentum Calculation:
For a user-defined length (e.g., 14 bars), TMO compares the current closing price to past open prices. It assigns:
+1 if the current close is greater than the open price of the past bar (indicating bullish momentum).
-1 if it's less (indicating bearish momentum).
0 if there's no change.
The sum of these scores gives a raw momentum measure.
EMA Smoothing:
To reduce noise and false signals, this raw momentum is smoothed using Exponential Moving Averages (EMAs):
First, the raw data is smoothed by an EMA over a short calculation period (default: 5).
Then, it undergoes additional smoothing through another EMA (default: 3 bars), creating the primary "Main" line of the indicator.
Lastly, a "Signal" line is derived by applying another EMA (also default: 3 bars) to the main line, adding further refinement.
Trend Identification:
The indicator plots two lines:
Main Line: Indicates current momentum strength and direction.
Signal Line: Acts as a reference line, similar to a moving average crossover system.
When the Main line crosses above the Signal line, it suggests strengthening bullish momentum. Conversely, when the Main line crosses below the Signal line, it indicates increasing bearish momentum.
Overbought/Oversold Levels:
The indicator identifies key levels based on the chosen length parameter:
Overbought zone (positive threshold): Suggests the market might be overheated, and a potential bearish reversal or pullback could occur.
Oversold zone (negative threshold): Suggests the market might be excessively bearish, signaling a potential bullish reversal.
Clouds visually mark these overbought/oversold areas, making it easy to see potential reversal zones.
Trading Applications:
Trend-following: Traders can enter positions based on crossovers of the Main and Signal lines.
Reversals: The overbought and oversold areas highlight high-probability reversal points.
Momentum confirmation: Use TMO to confirm price action or other technical signals, improving trade accuracy and timing.
The True Momentum Oscillator provides clarity in identifying momentum shifts, making it a valuable addition to various trading strategies.

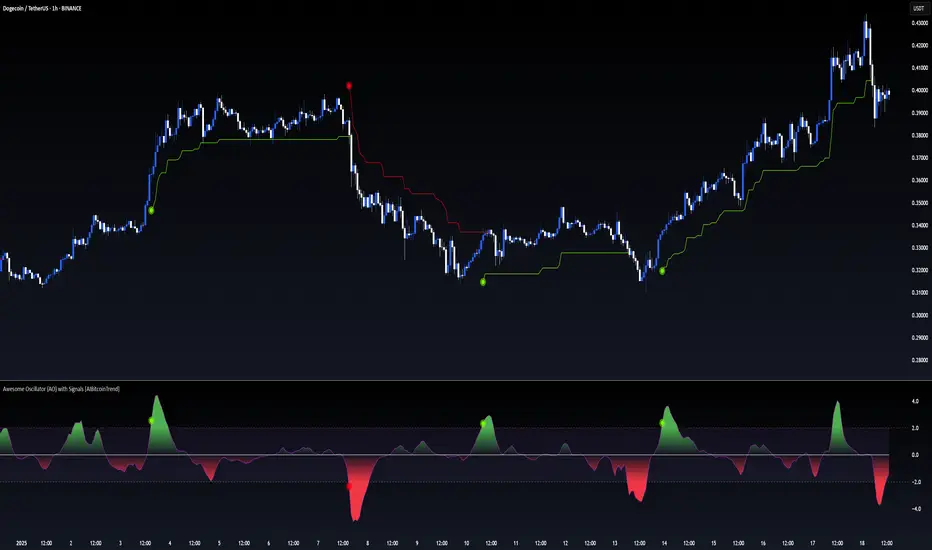
Awesome Oscillator (AO) with Signals [AIBitcoinTrend]👽 Multi-Scale Awesome Oscillator (AO) with Signals (AIBitcoinTrend)
The Multi-Scale Awesome Oscillator transforms the traditional Awesome Oscillator (AO) by integrating multi-scale wavelet filtering, enhancing its ability to detect momentum shifts while maintaining responsiveness across different market conditions.
Unlike conventional AO calculations, this advanced version refines trend structures using high-frequency, medium-frequency, and low-frequency wavelet components, providing traders with superior clarity and adaptability.
Additionally, it features real-time divergence detection and an ATR-based dynamic trailing stop, making it a powerful tool for momentum analysis, reversals, and breakout strategies.
👽 What Makes the Multi-Scale AO – Wavelet-Enhanced Momentum Unique?
Unlike traditional AO indicators, this enhanced version leverages wavelet-based decomposition and volatility-adjusted normalization, ensuring improved signal consistency across various timeframes and assets.
✅ Wavelet Smoothing – Multi-Scale Extraction – Captures short-term fluctuations while preserving broader trend structures.
✅ Frequency-Based Detail Weights – Separates high, medium, and low-frequency components to reduce noise and improve trend clarity.
✅ Real-Time Divergence Detection – Identifies bullish and bearish divergences for early trend reversals.
✅ Crossovers & ATR-Based Trailing Stops – Implements intelligent trade management with adaptive stop-loss levels.
👽 The Math Behind the Indicator
👾 Wavelet-Based AO Smoothing
The indicator applies multi-scale wavelet decomposition to extract high-frequency, medium-frequency, and low-frequency trend components, ensuring an optimal balance between reactivity and smoothness.
sma1 = ta.sma(signal, waveletPeriod1)
sma2 = ta.sma(signal, waveletPeriod2)
sma3 = ta.sma(signal, waveletPeriod3)
detail1 = signal - sma1 // High-frequency detail
detail2 = sma1 - sma2 // Intermediate detail
detail3 = sma2 - sma3 // Low-frequency detail
advancedAO = weightDetail1 * detail1 + weightDetail2 * detail2 + weightDetail3 * detail3
Why It Works:
Short-Term Smoothing: Captures rapid fluctuations while minimizing noise.
Medium-Term Smoothing: Balances short-term and long-term trends.
Long-Term Smoothing: Enhances trend stability and reduces false signals.
👾 Z-Score Normalization
To ensure consistency across different markets, the Awesome Oscillator is normalized using a Z-score transformation, making overbought and oversold levels stable across all assets.
normFactor = ta.stdev(advancedAO, normPeriod)
normalizedAO = advancedAO / nz(normFactor, 1)
Why It Works:
Standardizes AO values for comparison across assets.
Enhances signal reliability, preventing misleading spikes.
👽 How Traders Can Use This Indicator
👾 Divergence Trading Strategy
Bullish Divergence
Price makes a lower low, while AO forms a higher low.
A buy signal is confirmed when AO starts rising.
Bearish Divergence
Price makes a higher high, while AO forms a lower high.
A sell signal is confirmed when AO starts declining.
👾 Buy & Sell Signals with Trailing Stop
Bullish Setup:
✅AO crosses above the bullish trigger level → Buy Signal.
✅Trailing stop placed at Low - (ATR × Multiplier).
✅Exit if price crosses below the stop.
Bearish Setup:
✅AO crosses below the bearish trigger level → Sell Signal.
✅Trailing stop placed at High + (ATR × Multiplier).
✅Exit if price crosses above the stop.
👽 Why It’s Useful for Traders
Wavelet-Enhanced Filtering – Retains essential trend details while eliminating excessive noise.
Multi-Scale Momentum Analysis – Separates different trend frequencies for enhanced clarity.
Real-Time Divergence Alerts – Identifies early reversal signals for better entries and exits.
ATR-Based Risk Management – Ensures stops dynamically adapt to market conditions.
Works Across Markets & Timeframes – Suitable for stocks, forex, crypto, and futures trading.
👽 Indicator Settings
AO Short Period – Defines the short-term moving average for AO calculation.
AO Long Period – Defines the long-term moving average for AO smoothing.
Wavelet Smoothing – Adjusts multi-scale decomposition for different market conditions.
Divergence Detection – Enables or disables real-time divergence analysis. Normalization Period – Sets the lookback period for standard deviation-based AO normalization.
Cross Signals Sensitivity – Controls crossover signal strength for buy/sell signals.
ATR Trailing Stop Multiplier – Adjusts the sensitivity of the trailing stop.
Disclaimer: This indicator is designed for educational purposes and does not constitute financial advice. Please consult a qualified financial advisor before making investment decisions.
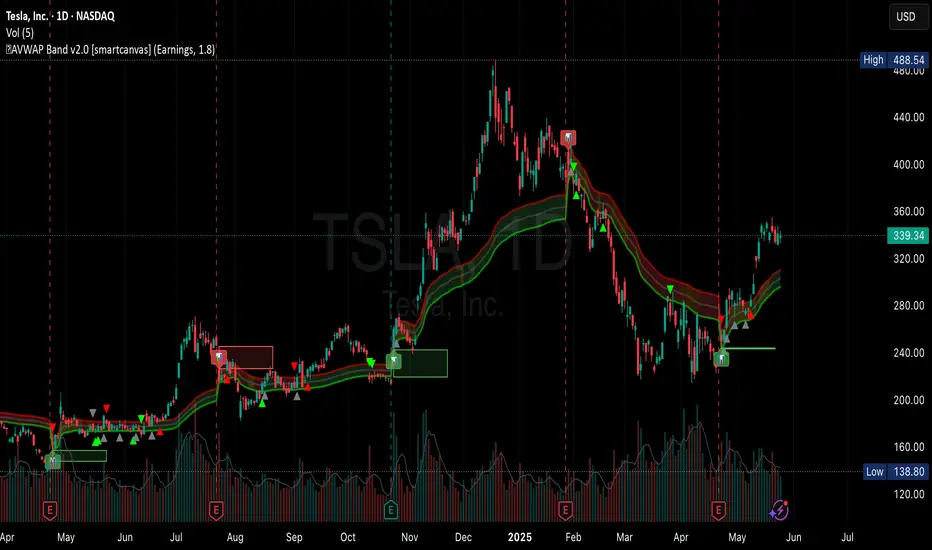
AVWAP Band✨ AVWAP Band by Mars ✨
The AVWAP Band indicator eliminates the guesswork of selecting multipliers for your VWAP analysis. Instead of using arbitrary deviations, this indicator provides three distinct VWAP lines calculated from different price points - giving you a complete VWAP band with just one tool.
What Makes This Different From Standard VWAP
Traditional VWAP indicators use multipliers (1.0, 2.0, 3.0) which require constant adjustment across different markets and timeframes. The AVWAP Band simplifies this by using natural price points:
Low-based VWAP (green) - acts as support
High-based VWAP (red) - acts as resistance
HL2-based VWAP (gray) - acts as the centerline
Key Features
Reduces cognitive load - no more guessing which multiplier to use
User-selected anchor point (click to set date)
Customizable colors and line styles
Built-in alerts for all crossover/crossunder events
Visual anchor point marker
How To Use It
After adding the indicator to your chart, you have to click on your anchor point
Watch for price reactions at each VWAP line
Look for crossovers between price and the different VWAPs
Use the HL2 VWAP as a centerline to determine overall bias
Trading Applications
Support/Resistance levels for intraday trading
Mean-reversion signals when price touches band extremes
Trend confirmation when price holds above/below centerline
Range identification between upper and lower bands
Volatility assessment based on band width
Customization Options
Toggle each VWAP line individually
Adjust line colors to match your chart theme
Control line width and transparency
Enable/disable anchor point label
This indicator simplifies VWAP analysis by giving you natural price-based bands without the need to adjust multipliers across different markets. The high, low, and HL2 sources create a complete VWAP picture with just one tool.
VIDEO
Feedback and suggestions welcome!
VWAP Horizon Suite Optimized - CoffeeKillerVWAP Horizon Suite Optimized - User Guide
Overview
The VWAP Horizon Suite Optimized is a comprehensive technical analysis tool for TradingView designed to enhance your trading strategy with Volume Weighted Average Price (VWAP) analysis, standard deviation bands, and customizable Exponential Moving Averages (EMAs). This indicator provides a robust framework for identifying potential support and resistance levels, price momentum, and market trends.
Key Features
- **Daily VWAP with Session Reset**: Automatically resets at 17:00 (5:00 PM) each day
- **Customizable Standard Deviation/Percentage Bands**: Up to 3 bands above and below VWAP
- **High/Low Point Detection**: Visual markers for significant price levels
- **Multiple Customizable EMAs**: 8 different EMAs that can be individually toggled and styled
- **Visual Customization**: Adjustable colors, fills, and styles for all elements
VWAP Settings
- **Source**: Determines the price data used to calculate VWAP (default: HLC3 - High, Low, Close average)
Bands Settings
- **Bands Calculation Mode**: Choose between "Standard Deviation" or "Percentage" methods
- **Show Band #1, #2, #3**: Toggle visibility for each band
- **Band Multiplier #1, #2, #3**: Adjust the distance from VWAP (in standard deviations or percentage)
- **Show Fills**: Enable colored fills between bands for better visualization
Visualization Settings
- **Show High/Low Markers**: Display diamond markers for local high and low points relative to VWAP, these reset based on the price crossing the VWAP Line.
EMA Settings
The indicator provides 8 customizable EMAs (8, 13, 21, 26, 48, 50, 100, and 200) with individual controls:
- **Show EMA X**: Toggle visibility for each EMA
- **EMA X Period**: Adjust the period length for calculation
- **EMA X Color**: Customize the color of each EMA
- **EMA Line Width**: Set the width for all EMA lines
How to Use
Basic VWAP Analysis
The core VWAP line (blue) represents the average price weighted by volume since the start of the session (17:00 daily reset). This serves as a dynamic support/resistance level and reference point for intraday trading.
1. **Price above VWAP**: Generally bullish short-term sentiment
2. **Price below VWAP**: Generally bearish short-term sentiment
3. **Crosses of VWAP**: Potential shift in short-term momentum
Standard Deviation Bands
The bands surrounding VWAP help identify potential support, resistance, and volatility levels:
- **Band #1 (±1σ)**: Price often reverts to VWAP when reaching these levels
- **Band #2 (±2σ)**: Stronger support/resistance areas, possible reversal zones
- **Band #3 (±3σ)**: Extreme price levels, often indicating overbought/oversold conditions
High/Low Point Detection
Purple and yellow diamond markers identify significant swing highs and lows relative to VWAP, helping you recognize potential reversal points or continuation patterns. (These repaint in a effort to find the max high/low point from the VWAP Line)
EMA Strategy
The customizable EMAs can be used to:
- Find potential support/resistance levels
- Create crossover systems
- Analyze market structure
Common EMA combinations include:
- 8 & 21 for short-term trends
- 50 & 200 for long-term trends and the "Golden Cross/Death Cross"
- 13 & 48 for the "New Golden Cross" - a modern alternative gaining popularity among traders
- 8, 13, 21 for complex short-term momentum analysis
Advanced Usage Tips
For Day Traders
1. **Opening Range Analysis**: Watch how price reacts to VWAP in the first hour of trading
2. **VWAP Reversions**: Look for trades when price touches outer bands and reverses toward VWAP
3. **Band Breakouts**: Strong moves beyond Band #2 may indicate momentum for continuation
For Swing Traders
1. **Use alongside daily/weekly support-resistance levels**
2. **Combine with EMA crossovers for trend confirmation**
3. **Identify potential reversal zones where price reaches Band #3**
Combined Strategies
- **EMA + VWAP Confluence**: Strong signals occur when EMA lines and VWAP/bands align at the same price level
- **High/Low + Band Touch**: When a high/low marker appears near a band, it may indicate a stronger support/resistance level
Conclusion
The VWAP Horizon Suite Optimized provides a comprehensive set of tools for price analysis based on volume-weighted data and exponential averages. By understanding and properly configuring the various components, you can create a powerful visual framework for identifying potential trading opportunities across multiple timeframes.
Remember that no indicator provides perfect signals, and the VWAP Horizon Suite works best when used as part of a complete trading strategy that includes risk management, multiple confirmation tools, and proper analysis of market conditions.
DISCLAIMER
**DISCLAIMER: This indicator and its signals are intended solely for educational and informational purposes. They do not constitute financial advice. Trading involves significant risk of loss. Always conduct your own analysis and consult with financial professionals before making trading decisions.**

Adaptive Supply and Demand [EdgeTerminal]Adaptive Supply and Demand is a dynamic supply and demand indicator with a few unique twists. It considers volume pressure, volatility-based adjustments and multi-time frame momentum for confidence scoring (multi-step confirmation) to generate dynamic lines that adjust based on the market and also to generate dynamic support/resistance levels for the supply and demand lines.
The dynamic support and resistance lines shown gives you a better situational awareness of the current state of the market and add more context to why the market is moving into a certain direction.
> Trading Scenarios
When the confidence score is over 80%, strong volume pressure in trend direction (up or down), volatility is low and momentum is aligned across timeframes, there is an indication of a strong upward or downward trend.
When the supply and demand line crossover, the confidence score is over 75% and the volume pressure is shifting, this can be an indicator of trend reversal. Use tight initial stops, scale into position as trend develops, monitor the volume pressure for continuation and wait for confidence confirmation.
When the confiance score is below 60%, the volume pressure is choppy, volatility is high, you want to avoid trading or reduce position size, wait for confidence improvements, use support and resistance for entries/exits and use tighter stops due to market conditions. This is an indication of a ranging market.
Another scenario is when there is a sudden volume pressure increase, and a raising confidence score, the volatility is expanding and the bar momentum is aligning the volatility direction. This can indicate a breakout scenario.
> How it Works
1. Volume Pressure Analysis
Volume Pressure Analysis is a key component that measures the true buying and selling force in the market. Here's a detailed breakdown. The idea is to standardize volume to prevent large spikes from skewing results.
The indicator employs an adaptive volume normalization technique to detect genuine buying and selling pressure.
It takes current volume and divides it by average volume.
If normVol > 1: Current volume is above average
If normVol < 1: Current volume is below average
An example if this would be If current volume is 1500 and average is 1000, normVol = 1.5 (50% above average)
Another component of the volume pressure analysis is the Price Change Calculation sub-module. The purpose of this is to measure price movement relative to recent average.
It works by subtracting the average price from the current price. If the value is positive, price is average and if negative, price is below average.
Finally, the volume pressure is calculated to combine volume and price for true pressure reading.
2. Savitzky-Golay Filtering
SG filtering implements advanced signal smoothing while preserving important trend features. It uses weighted moving average approximation, preserves higher moments of data and reduces noise while maintaining signal integrity.
This results in smoother signal lines, reduced false crossovers and better trend identification. Traditional moving averages tend to lag and smooth out important features. Additionally, simple moving averages can miss critical turning points and regular smoothing can delay signal generation.
SG filtering preserves higher moments such as peaks, valleys and trends, reduces noise while maintaining signal sharpness.
It works by creating a symmetric weighting scheme. This way center points get the highest weights while edge points get the lowest weight.
3. Parkinson's Volatility
Parkinson's Volatility is an advanced volatility measurement formula using high-low range data. It uses high-low range for volatility calculation, incorporates logarithmic returns and annualized the volatility measure.
This results in more accurate volatility measurement, better risk assessment and dynamic signal sensitivity.
4. Multi-timeframe Momentum
This combines signals from each module for each timeframe to calculate momentum across three timeframes. It also applies weighted importance to each timeframe and generates a composite momentum signal.
This results in a more comprehensive trend analysis, reduced timeframe bias and better trend confirmation.
> Indicator Settings
Short-term Period:
Lower values makes it more sensitive, meaning it will generate more signals. Higher values makes it less sensitive, resulting in fewer signals. We recommend a 5 to 15 range for day trading, and 10 to 20 for swing trading
Medium-term Period:
Lower values result in faster trend confirmation and higher values show slower and more reliable confirmation. We recommend a range of 15-25 for day trading and 20-30 for swing trading.
Long-term Period:
Lower values makes it more responsive to trend changes and higher values are better for major trend identification. We recommend a range of 40-60 for day trading and 50-100 for swing trading.
Volume Analysis Window:
Lower values result in more sensitivity to volume changes and higher values result in smoother volume analysis. The optimal range is 15-25 for most trading styles.
Confidence Threshold:
Lower values generate more signals but quality decreases. Higher values generate fewer signals but accuracy increases.The optimal range is 0.65-0.8 for most trading conditions.

PlanDeFi: Adaptive Trend Ribbons [ATR+RSI]#### **Overview**
The **Crypto Half-Trend Pro ** is a trend-following indicator designed to identify bullish and bearish market conditions using a combination of **moving averages, volatility adjustments, and dynamic ATR bands**. This enhanced version improves on the traditional Half-Trend system by incorporating **EMA smoothing, volatility-based adjustments, and additional fakeout/reversal detection mechanisms**.
#### **Key Features**
✅ **Trend Detection:**
- Uses a combination of fast and slow moving averages (EMA/SMA) to determine trend direction.
- Implements **Hull Moving Average (HMA)** smoothing for better trend visualization.
✅ **Dynamic ATR Bands:**
- Adjusts bands based on market volatility using **RSI-based ATR multipliers**.
- Helps identify potential **breakouts and trend reversals**.
✅ **Fakeout & Reversal Detection:**
- Detects potential **fake breakouts** by analyzing price action against extended ATR bands.
- Identifies **early reversal signals** using price crossovers and volume confirmation.
✅ **Customizable Alerts & Visuals:**
- Built-in **buy & sell signals** for trend confirmation.
- Color-coded bullish/bearish trend lines and **fakeout warnings**.
- **TradingView alerts** for trend shifts and reversals.
#### **How It Works**
🔹 The indicator calculates a **smoothed trend line** using a Hull Moving Average on dynamic price levels.
🔹 ATR bands expand/contract dynamically based on **market volatility** to improve signal accuracy.
🔹 Trend direction is confirmed when price crosses the trend line **with volume confirmation**.
🔹 **Fakeouts** are detected when price temporarily exceeds extended bands but fails to hold momentum.
🔹 **Reversal signals** are generated when price breaks back into the ATR zone with volume spikes.
#### **How to Use It**
- 📈 **Buy Signal:** When price breaks above the trend line, confirmed by volume and crossover signals.
- 📉 **Sell Signal:** When price breaks below the trend line with confirmed bearish conditions.
- 🚨 **Reversal Warning:** If price sharply re-enters the ATR zone with volume confirmation, expect a potential trend shift.
- 🛑 **Fakeout Alert:** If price temporarily breaks resistance but closes back inside, it may be a false move.
#### **Ideal For**
✔️ Crypto & Forex traders looking for **dynamic trend signals**
✔️ Swing traders wanting to **avoid fakeouts & catch reversals**
✔️ Traders seeking a **customizable, volatility-adjusted trend system**
🚀 **Try PlanDeFi: Adaptive Trend Ribbons today and improve your trend analysis!**

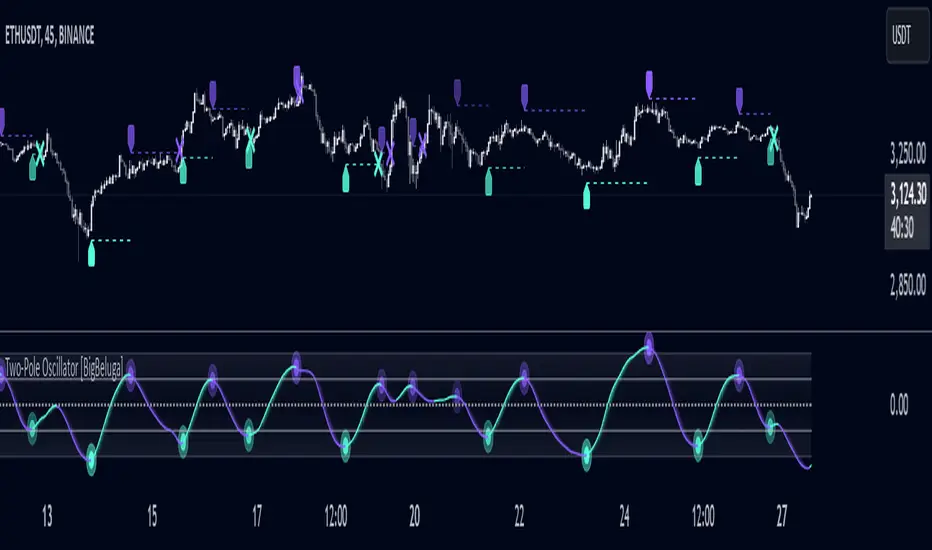
Two-Pole Oscillator [BigBeluga]
The Two-Pole Oscillator is an advanced smoothing oscillator designed to provide traders with precise market signals by leveraging deviation-based calculations combined with a unique two-pole filtering technique. It offers clear visual representation and actionable signals for smart trading decisions.
🔵Key Features:
Two-Pole Filtering: Smooths out the main oscillator signal to reduce noise, providing a cleaner and more reliable view of market momentum and trend strength.
// Two-pole smooth filter function
f_two_pole_filter(source, length) =>
var float smooth1 = na
var float smooth2 = na
alpha = 2.0 / (length + 1)
if na(smooth1)
smooth1 := source
else
smooth1 := (1 - alpha) * smooth1 + alpha * source
if na(smooth2)
smooth2 := smooth1
else
smooth2 := (1 - alpha) * smooth2 + alpha * smooth1
Deviation-Based Oscillator: Utilizes price deviations from the mean to generate dynamic signals, making it ideal for detecting overbought and oversold conditions.
float sma1 = ta.sma(close, 25)
float sma_n1 = ((close - sma1) - ta.sma(close - sma1, 25)) / ta.stdev(close - sma1, 25)
Signal Gradient Strength: Signals on the main oscillator line feature gradient coloring based on their proximity to the 0 level:
➔ Closer to 0: More transparent, indicating weaker signals.
➔ Closer to 1 or -1: Less transparent, highlighting stronger signals.
Level-Based Signal Validation: Parallel levels are plotted on the chart for each signal:
➔ If a level is crossed by price, the signal is invalidated, marked by an "X" at the invalidation point.
Trend Continuation
Invalidation Levels: Serve as potential stop-loss or trade-reversal zones, enabling traders to make more informed and disciplined trading decisions.
Dynamic Chart Plotting: Signals are plotted directly on the chart with corresponding levels, providing a comprehensive visual representation for easy interpretation.
🔵How It Works:
The oscillator calculates price deviation from a mean value and applies two-pole filtering to smooth the resulting signal.
Gradient-colored signals reflect their strength, with transparency indicating proximity to the 0 level on the oscillator scale.
Buy and sell signals are generated based on crossovers and crossunders of the oscillator line with a signal line.
If a level is crossed, the corresponding signal is marked with a "X" plotted on the chart at the crossover point.
🔵Use Cases:
Detecting overbought or oversold market conditions with a smoother, noise-free oscillator.
Using invalidation levels to set clear stop-loss or trade exit points.
Identifying strong momentum signals and filtering out weaker, less reliable ones.
Combining oscillator signals with price action for more precise trade entries and exits.
This indicator is perfect for traders seeking a refined approach to oscillator analysis, combining signal strength visualization with actionable invalidation levels to enhance trading precision and strategy.
Waldo RSI Overlay :oWaldo RSI Overlay :o Indicator Guide
Welcome to the guide for the Waldo RSI Overlay :o indicator on TradingView. This tool enhances your trading analysis through RSI-based overlays for trend analysis, divergence detection, and breakout/breakdown signals when used with its companion indicator, Waldo RSI :o.
Key Features:
RSI Overlay:
• RSI Source: Choose from:
o ON RSI: Uses the RSI values directly to detect pivots, focusing on RSI highs and lows for trend analysis.
o ON HIGH, ON CLOSE, ON LOW, ON OPEN:
These options base pivot detection on price action at those specific points, offering an alternative market structure view.
• RSI Settings:
o Source: Default is (H+L)/2, but you can select any price for RSI calculation.
o Length: Default RSI length is 7, which you can adjust for sensitivity.
Trend Lines:
• Show Trend Lines: Toggle to display trend lines based on pivot points.
• Zigzag Length: Sets the sensitivity of pivot point detection.
• Confirm Length: Ensures the validity of pivot points (default is 3).
• Colors: Customize colors for Higher Highs (HH), Lower Highs (LH), Higher Lows (HL), and Lower Lows (LL).
• Transparency and Line Width: Control how trend lines and fills appear.
• Label Size: Adjust the size of labels identifying pivot points.
Divergences:
• Classic Divergences:
o Show Classic Div: Enable to highlight regular divergences where price and RSI move in opposite directions.
o Colors: Define colors for bullish and bearish divergence lines and labels.
o Transparency and Line Width: Adjust the visual impact of divergence signals.
• Hidden Divergences:
o Similar settings as classic, but these highlight divergences indicating trend continuation.
Breakout/Breakdown:
• Show Breakout/Breakdown: When activated, this feature signals when the price breaks through previous highs or lows. To activate these breakouts, you need the companion indicator Waldo RSI :o, select the SRC in the External section, and select the crossovers for each one.
This combination provides RSI confirmation for breakout/breakdown events.
Overbought/Oversold Zones:
• Show Overbought and Oversold Zones: Bars are colored when RSI exceeds 70 (purple) or falls below 30 (blue), indicating potential market extremes.
Moving Averages (Optional):
• Show Moving Averages: Option to overlay two moving averages for trend confirmation.
• Source, Type, Length: Customize each MA's configuration.
Ghost Lines (Optional):
• Ghost Lines: When enabled, trend lines extend for only a specified period (Ghost Length) instead of indefinitely.
How to Use the Indicator:
1. Setup:
o Configure RSI settings by choosing the RSI Source and adjusting the RSI Length to suit your trading style.
o Set the Zigzag Length and Confirm Length for trend line sensitivity based on market volatility.
2. Trend Analysis:
o Look at the colored horizontal lines and fills for HH, LH, HL, LL to discern market structure and potential reversal points.
3. Divergence Detection:
o Identify divergences where price and RSI diverge. Regular divergences might signal trend exhaustion, while hidden ones could indicate trend persistence.
4. Breakout/Breakdown Signals:
o Ensure you have both the Waldo RSI Overlay :o and Waldo RSI :o indicators applied. Green triangles below bars signal breakouts; red ones above indicate breakdowns, based on price movement with RSI confirmation from the companion indicator.
5. Overbought/Oversold:
o Use these colored zones to spot potential momentum shifts or reversal areas.
6. Moving Averages on RSI:
o If used, these can help confirm trends or identify crossover signals for additional trade confirmation.
7. Ghost Lines:
o For a less cluttered chart, enable this to limit how far trend lines extend.
Tips for Usage:
• Always combine this indicator with other analytical tools for better confirmation. No single indicator should guide all decisions.
• Adjust settings according to the asset's behavior and your trading timeframe.
• Regularly review your settings as market dynamics change.
Remember, trading involves risk, and past performance doesn't predict future outcomes. Use this indicator within a comprehensive trading strategy.

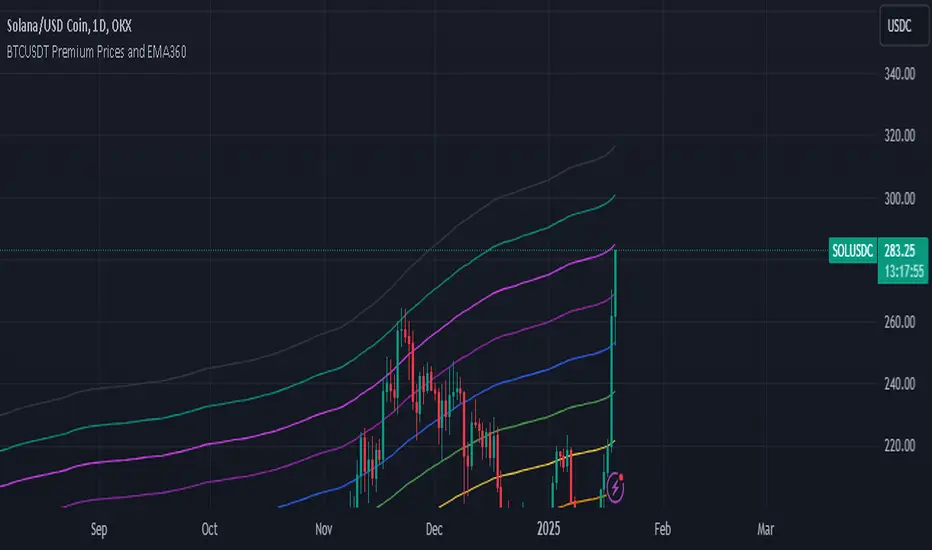
BTCUSDT Premium Prices and EMA360The Exponential Moving Average (EMA) is a widely used technical indicator in trading that helps analysts and traders identify price trends over a specified period. Unlike the Simple Moving Average (SMA), which treats all data points equally, the EMA gives more weight to recent prices, making it more sensitive to recent price movements. This characteristic allows the EMA to react quickly to changes in market conditions, providing timely insights into potential trends.
## **Key Features of EMA**
- **Weighting Mechanism**: The EMA uses a smoothing factor that emphasizes recent price data while still considering older observations. This leads to a more dynamic representation of price trends compared to the SMA .
- **Trend Identification**: The EMA is particularly effective for identifying the direction of a stock's price movement. A rising EMA indicates an uptrend, while a declining EMA suggests a downtrend. Traders often use multiple EMAs with different periods to spot crossovers, which can signal potential buy or sell opportunities .
- **Calculation**: To calculate the EMA, one typically starts with an initial Simple Moving Average (SMA) for the first period, then applies the following formula for subsequent periods:
$$
\text{EMA}_{\text{today}} = \left(\text{Price}_{\text{today}} \times \left(\frac{2}{N + 1}\right)\right) + \left(\text{EMA}_{\text{yesterday}} \times \left(1 - \frac{2}{N + 1}\right)\right)
$$
Where $$N$$ is the number of periods .
## **Applications in Trading**
Traders utilize the EMA in various strategies, including:
- **Crossover Strategies**: By monitoring two EMAs of different lengths (e.g., 50-day and 200-day), traders can identify bullish or bearish signals when one crosses above or below the other .
- **Combining Indicators**: The EMA can be combined with other indicators like the Relative Strength Index (RSI) or Moving Average Convergence Divergence (MACD) for enhanced decision-making .
In summary, the Exponential Moving Average is a crucial tool for traders seeking to navigate market trends effectively. Its ability to prioritize recent data makes it an essential component of many trading strategies, providing insights that can lead to informed investment decisions.
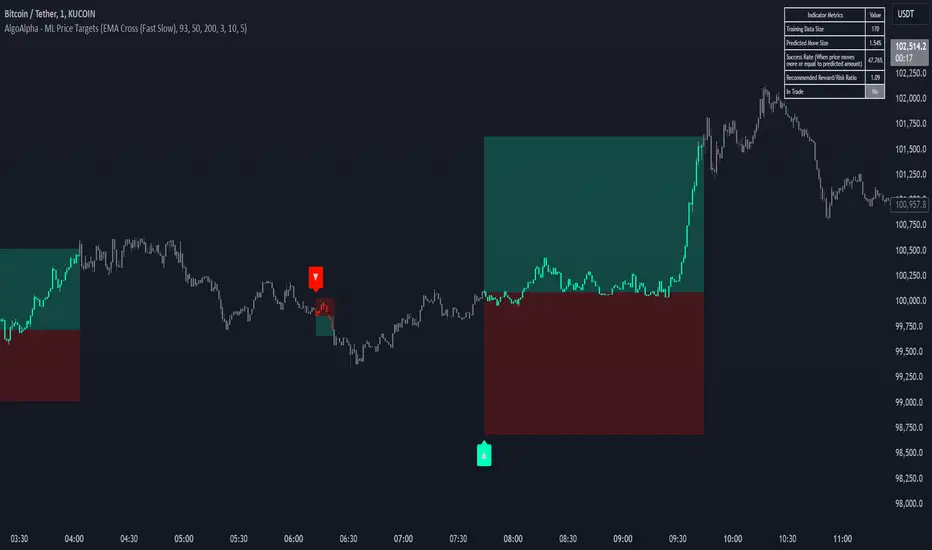
Machine Learning Price Target Prediction Signals [AlgoAlpha]Introducing the Machine Learning Price Target Predictions, a cutting-edge trading tool that leverages kernel regression to provide accurate price targets and enhance your trading strategy. This indicator combines trend-based signals with advanced machine learning techniques, offering predictive insights into potential price movements. Perfect for traders looking to make data-driven decisions with confidence.
What is Kernel Regression and How It Works
Kernel regression is a non-parametric machine learning technique that estimates the relationship between variables by weighting data points based on their similarity to a given input. The similarity is determined using a kernel function, such as the Gaussian (RBF) kernel, which assigns higher weights to closer data points and progressively lower weights to farther ones. This allows the model to make smooth and adaptive predictions, balancing recent data and historical trends.
Key Features
🎯 Predictive Price Targets : Uses kernel regression to estimate the magnitude of price movements.
📈 Dynamic Trend Analysis : Multiple trend detection methods, including EMA crossovers, Hull Moving Average, and SuperTrend.
🔧 Customizable Settings : Adjust bandwidth for kernel regression and tweak trend indicator parameters to suit your strategy.
📊 Visual Trade Levels : Displays take-profit and stop-loss levels directly on the chart with customizable colors.
📋 Performance Metrics : Real-time win rate, recommended risk-reward ratio, and training data size displayed in an on-chart table.
🔔 Alerts : Get notified for new trends, take-profit hits, and stop-loss triggers.
How to Use
🛠 Add the Indicator : Add it to your favorites and apply it to your chart. Configure the trend detection method (SuperTrend, HMA, or EMA crossover) and other parameters based on your preferences.
📊 Analyze Predictions : Observe the predicted move size, recommended risk-reward ratio, and trend direction. Use the displayed levels for trade planning.
🔔 Set Alerts : Enable alerts for trend signals, take-profit hits, or stop-loss triggers to stay informed without constant monitoring.
How It Works
The indicator calculates features such as price volatility, relative strength, and trend signals, which are stored during training periods. When a trend change is detected, the kernel regression model predicts the likely price move based on these features. Predictions are smoothed using the specified bandwidth to avoid overfitting while ensuring timely responses to feature changes. Visualized take-profit and stop-loss levels help traders optimize risk management. Real-time metrics like win rate and recommended risk-reward ratios provide actionable insights for decision-making.
[blackcat] L2 Waveband Trading█ OVERVIEW
The Waveband Trading script calculates trading signals based on a modified Relative Strength Index (RSI)-like system combined with specific price action criteria. It plots two lines representing different smoothed RSI-like indicators and marks potential buying opportunities labeled as "S" for stronger trends and "B" for weaker but still favorable ones.
█ LOGICAL FRAMEWORK
The script begins by defining the waveband_trading_signals function which computes RSI-like metrics and determines buy signals under certain conditions. The main sections include input parameter definitions, function calls, data processing within the function, and plot commands for visual representation. Data flows from historical OHLCV data to various technical computations like EMAs and SMAs before being evaluated against user-defined thresholds to generate trade signals.
█ CUSTOM FUNCTIONS
Waveband Trading Signals:
• Purpose: Computes waveband trading signals using a customized version of the RSI indicator.
• Parameters:
— overboughtLevel: Threshold level indicating market overbought condition.
— oversoldLevel: Threshold level indicating market oversold condition.
— strongHoldLevel: Strong hold condition threshold between neutral and overbought states.
— moderateHoldLevel: Moderate hold condition threshold below strong hold level.
• [b>Returns: A tuple containing:
— k: Smoothed RSI-like metric.
— d: Further smoothed version of 'k'.
— buySignalStrong: Boolean indicating a strong trend buy signal.
— buySignalWeak: Boolean indicating a weak but promising buy signal.
█ KEY POINTS AND TECHNIQUES
• Utilizes EMA and SMA functions to smooth out price variations effectively.
• Employs crossover logic between fast ('k') and slow ('d') indicators to identify entry points.
• Incorporates volume checks ensuring increasing interest in trades aligns with upwards momentum.
• Leverages predefined threshold levels allowing flexibility to adapt to varying market conditions.
• Uses the new labeling feature ( label.new ) introduced in Pine Script v5 for marking significant chart events visually.
█ EXTENDED KNOWLEDGE AND APPLICATIONS
Potential enhancements could involve incorporating additional filters such as MACD crossovers or Fibonacci retracement levels alongside optimizing current conditions via backtesting. This technique might also prove useful in other strategies requiring robust confirmation methods beyond simple price action; alternatively, adapting it into a more automated form for execution on exchanges offering API access. Understanding key functionalities like relative strength assessment, smoothed averaging techniques, and conditional buy/sell rules enriches one’s toolkit when developing complex trading algorithms tailored specifically toward personal investment philosophies.
