Hull AMA SignalsThis script is a comprehensive trading indicator named "Hull AMA Signals", which combines AMA and HSO by LuxAlgo and ther video based strategy techniques to provide buy (long) and sell (short) signals. It overlays directly on the price chart, offering a dynamic and visually intuitive trading aid. The core components of this indicator are Adaptive Moving Averages (AMA), Hull Moving Average (HMA), and a unique Hull squeeze oscillator (HSO), each configured with customizable parameters for flexibility and adaptability to various market conditions.
Features and Components
Adaptive Moving Averages (AMA): This indicator employs two sets of AMAs, each with distinct lengths, multipliers, lags, and overshoot parameters. The AMAs are designed to adapt their sensitivity based on the market's volatility, making them more responsive during significant price movements and less prone to false signals during periods of consolidation.
Hull Moving Average (HMA): The HMA is calculated using a sophisticated algorithm that aims to reduce the lag commonly associated with traditional moving averages. It provides a smoother and more responsive moving average line, which helps in identifying the prevailing market trend more accurately.
Hull Squeeze Oscillator (HSO): A novel component of this indicator, the HSO, is designed to identify potential market breakouts. It does so by comparing the Hull Moving Average's direction and momentum against a dynamically calculated mean, generating bullish or bearish signals based on the crossover and divergence from this mean.
Buy (Long) and Sell (Short) Signals: The script intelligently combines signals from the AMA crossovers and the Hull squeeze oscillator to pinpoint potential buy and sell opportunities. Bullish signals are generated when there's a positive crossover in the AMAs accompanied by a bullish dot from the HSO, whereas bearish signals are indicated by a negative crossover in the AMAs along with a bearish dot from the HSO.
Customization and Style Options: Users have the ability to adjust various parameters such as the length of the moving averages, multipliers, and source data, enabling customization for different trading strategies and asset classes. Additionally, color-coded visual elements like gradients and shapes enhance the readability and instant recognition of trading signals.
Use Cases
Trend Identification: By analyzing the direction and position of the AMAs and HMA, traders can easily discern the prevailing market trend, helping them to align their trades with the market momentum.
Signal Confirmation: The combination of AMA crossovers and HSO signals provides a robust framework for confirming trade entries and exits, potentially increasing the reliability of the trading signals.
Volatility Adaptation: The adaptive nature of the AMAs and the dynamic calculation of the HSO mean allow this indicator to adjust to changing market volatility, making it suitable for a wide range of market environments.
This indicator is suitable for traders looking for a comprehensive and dynamic technical analysis tool that combines trend analysis with signal generation, offering both visual appeal and practical trading utility.
Cari dalam skrip untuk "crossover债券是什么"

Advanced Dynamic Threshold RSI [Elysian_Mind]Advanced Dynamic Threshold RSI Indicator
Overview
The Advanced Dynamic Threshold RSI Indicator is a powerful tool designed for traders seeking a unique approach to RSI-based signals. This indicator combines traditional RSI analysis with dynamic threshold calculation and optional Bollinger Bands to generate weighted buy and sell signals.
Features
Dynamic Thresholds: The indicator calculates dynamic thresholds based on market volatility, providing more adaptive signal generation.
Performance Analysis: Users can evaluate recent price performance to further refine signals. The script calculates the percentage change over a specified lookback period.
Bollinger Bands Integration: Optional integration of Bollinger Bands for additional confirmation and visualization of potential overbought or oversold conditions.
Customizable Settings: Traders can easily customize key parameters, including RSI length, SMA length, lookback bars, threshold multiplier, and Bollinger Bands parameters.
Weighted Signals: The script introduces a unique weighting mechanism for signals, reducing false positives and improving overall reliability.
Underlying Calculations and Methods
1. Dynamic Threshold Calculation:
The heart of the Advanced Dynamic Threshold RSI Indicator lies in its ability to dynamically calculate thresholds based on multiple timeframes. Let's delve into the technical details:
RSI Calculation:
For each specified timeframe (1-hour, 4-hour, 1-day, 1-week), the Relative Strength Index (RSI) is calculated using the standard 14-period formula.
SMA of RSI:
The Simple Moving Average (SMA) is applied to each RSI, resulting in the smoothing of RSI values. This smoothed RSI becomes the basis for dynamic threshold calculations.
Dynamic Adjustment:
The dynamically adjusted threshold for each timeframe is computed by adding a constant value (5 in this case) to the respective SMA of RSI. This dynamic adjustment ensures that the threshold reflects changing market conditions.
2. Weighted Signal System:
To enhance the precision of buy and sell signals, the script introduces a weighted signal system. Here's how it works technically:
Signal Weighting:
The script assigns weights to buy and sell signals based on the crossover and crossunder events between RSI and the dynamically adjusted thresholds. If a crossover event occurs, the weight is set to 2; otherwise, it remains at 1.
Signal Combination:
The weighted buy and sell signals from different timeframes are combined using logical operations. A buy signal is generated if the product of weights from all timeframes is equal to 2, indicating alignment across timeframe.
3. Experimental Enhancements:
The Advanced Dynamic Threshold RSI Indicator incorporates experimental features for educational exploration. While not intended as proven strategies, these features aim to offer users a glimpse into unconventional analysis. Some of these features include Performance Calculation, Volatility Calculation, Dynamic Threshold Calculation Using Volatility, Bollinger Bands Module, Weighted Signal System Incorporating New Features.
3.1 Performance Calculation:
The script calculates the percentage change in the price over a specified lookback period (variable lookbackBars). This provides a measure of recent performance.
pctChange(src, length) =>
change = src - src
pctChange = (change / src ) * 100
recentPerformance1H = pctChange(close, lookbackBars)
recentPerformance4H = pctChange(request.security(syminfo.tickerid, "240", close), lookbackBars)
recentPerformance1D = pctChange(request.security(syminfo.tickerid, "1D", close), lookbackBars)
3.2 Volatility Calculation:
The script computes the standard deviation of the closing price to measure volatility.
volatility1H = ta.stdev(close, 20)
volatility4H = ta.stdev(request.security(syminfo.tickerid, "240", close), 20)
volatility1D = ta.stdev(request.security(syminfo.tickerid, "1D", close), 20)
3.3 Dynamic Threshold Calculation Using Volatility:
The dynamic thresholds for RSI are calculated by adding a multiplier of volatility to 50.
dynamicThreshold1H = 50 + thresholdMultiplier * volatility1H
dynamicThreshold4H = 50 + thresholdMultiplier * volatility4H
dynamicThreshold1D = 50 + thresholdMultiplier * volatility1D
3.4 Bollinger Bands Module:
An additional module for Bollinger Bands is introduced, providing an option to enable or disable it.
// Additional Module: Bollinger Bands
bbLength = input(20, title="Bollinger Bands Length")
bbMultiplier = input(2.0, title="Bollinger Bands Multiplier")
upperBand = ta.sma(close, bbLength) + bbMultiplier * ta.stdev(close, bbLength)
lowerBand = ta.sma(close, bbLength) - bbMultiplier * ta.stdev(close, bbLength)
3.5 Weighted Signal System Incorporating New Features:
Buy and sell signals are generated based on the dynamic threshold, recent performance, and Bollinger Bands.
weightedBuySignal = rsi1H > dynamicThreshold1H and rsi4H > dynamicThreshold4H and rsi1D > dynamicThreshold1D and crossOver1H
weightedSellSignal = rsi1H < dynamicThreshold1H and rsi4H < dynamicThreshold4H and rsi1D < dynamicThreshold1D and crossUnder1H
These features collectively aim to provide users with a more comprehensive view of market dynamics by incorporating recent performance and volatility considerations into the RSI analysis. Users can experiment with these features to explore their impact on signal accuracy and overall indicator performance.
Indicator Placement for Enhanced Visibility
Overview
The design choice to position the "Advanced Dynamic Threshold RSI" indicator both on the main chart and beneath it has been carefully considered to address specific challenges related to visibility and scaling, providing users with an improved analytical experience.
Challenges Faced
1. Differing Scaling of RSI Results:
RSI values for different timeframes (1-hour, 4-hour, and 1-day) often exhibit different scales, especially in markets like gold.
Attempting to display these RSIs on the same chart can lead to visibility issues, as the scaling differences may cause certain RSI lines to appear compressed or nearly invisible.
2. Candlestick Visibility vs. RSI Scaling:
Balancing the visibility of candlestick patterns with that of RSI values posed a unique challenge.
A single pane for both candlesticks and RSIs may compromise the clarity of either, particularly when dealing with assets that exhibit distinct volatility patterns.
Design Solution
Placing the buy/sell signals above/below the candles helps to maintain a clear association between the signals and price movements.
By allocating RSIs beneath the main chart, users can better distinguish and analyze the RSI values without interference from candlestick scaling.
Doubling the scaling of the 1-hour RSI (displayed in blue) addresses visibility concerns and ensures that it remains discernible even when compared to the other two RSIs: 4-hour RSI (orange) and 1-day RSI (green).
Bollinger Bands Module is optional, but is turned on as default. When the module is turned on, the users can see the upper Bollinger Band (green) and lower Bollinger Band (red) on the main chart to gain more insight into price actions of the candles.
User Flexibility
This dual-placement approach offers users the flexibility to choose their preferred visualization:
The main chart provides a comprehensive view of buy/sell signals in relation to candlestick patterns.
The area beneath the chart accommodates a detailed examination of RSI values, each in its own timeframe, without compromising visibility.
The chosen design optimizes visibility and usability, addressing the unique challenges posed by differing RSI scales and ensuring users can make informed decisions based on both price action and RSI dynamics.
Usage
Installation
To ensure you receive updates and enhancements seamlessly, follow these steps:
Open the TradingView platform.
Navigate to the "Indicators" tab in the top menu.
Click on "Community Scripts" and search for "Advanced Dynamic Threshold RSI Indicator."
Select the indicator from the search results and click on it to add to your chart.
This ensures that any future updates to the indicator can be easily applied, keeping you up-to-date with the latest features and improvements.
Review Code
Open TradingView and navigate to the Pine Editor.
Copy the provided script.
Paste the script into the Pine Editor.
Click "Add to Chart."
Configuration
The indicator offers several customizable settings:
RSI Length: Defines the length of the RSI calculation.
SMA Length: Sets the length of the SMA applied to the RSI.
Lookback Bars: Determines the number of bars used for recent performance analysis.
Threshold Multiplier: Adjusts the multiplier for dynamic threshold calculation.
Enable Bollinger Bands: Allows users to enable or disable Bollinger Bands integration.
Interpreting Signals
Buy Signal: Generated when RSI values are above dynamic thresholds and a crossover occurs.
Sell Signal: Generated when RSI values are below dynamic thresholds and a crossunder occurs.
Additional Information
The indicator plots scaled RSI lines for 1-hour, 4-hour, and 1-day timeframes.
Users can experiment with additional modules, such as machine-learning simulation, dynamic real-life improvements, or experimental signal filtering, depending on personal preferences.
Conclusion
The Advanced Dynamic Threshold RSI Indicator provides traders with a sophisticated tool for RSI-based analysis, offering a unique combination of dynamic thresholds, performance analysis, and optional Bollinger Bands integration. Traders can customize settings and experiment with additional modules to tailor the indicator to their trading strategy.
Disclaimer: Use of the Advanced Dynamic Threshold RSI Indicator
The Advanced Dynamic Threshold RSI Indicator is provided for educational and experimental purposes only. The indicator is not intended to be used as financial or investment advice. Trading and investing in financial markets involve risk, and past performance is not indicative of future results.
The creator of this indicator is not a financial advisor, and the use of this indicator does not guarantee profitability or specific trading outcomes. Users are encouraged to conduct their own research and analysis and, if necessary, consult with a qualified financial professional before making any investment decisions.
It is important to recognize that all trading involves risk, and users should only trade with capital that they can afford to lose. The Advanced Dynamic Threshold RSI Indicator is an experimental tool that may not be suitable for all individuals, and its effectiveness may vary under different market conditions.
By using this indicator, you acknowledge that you are doing so at your own risk and discretion. The creator of this indicator shall not be held responsible for any financial losses or damages incurred as a result of using the indicator.
Kind regards,
Ely

Zaree - Bull & Bear Volume VoidThe "Zaree - Bull & Bear Volume Void" (BBVV) indicator is a versatile tool designed to help traders assess the dynamics of bull and bear power in the market, with a focus on volume-based analysis. This indicator offers a range of features that aid in identifying potential shifts in market sentiment and strength.
Details of the Indicator:
Volume Void Color Settings: This indicator allows you to customize the colors used for different conditions, such as strong bull areas, slowing bull areas, strong bear areas, and slowing bear areas. These colors play a crucial role in visualizing the indicator's output.
Volume Void Settings: The BBVV indicator provides options for selecting specific volume void functions, which include "Relative Volume Comparison," "Percentage of Average Volume," "Fixed Volume Threshold," "Volatility-Adjusted Volume," "Compare to Previous Volume Bars," "Volume Percentile Rank," and "Market Session Comparison." Each function has its own criteria for evaluating volume conditions.
Void Bull Sensitivity and Void Bear Sensitivity: These are key parameters in the settings. The values you choose for void bull sensitivity and void bear sensitivity will significantly impact the background color displayed by the indicator. Properly configuring these values is crucial for the indicator's effectiveness.
Moving Average Settings: You can specify the source and length of moving averages used in the indicator. This helps in smoothing out data and providing a clearer picture of bull and bear power.
Void Color Background Conditions: The indicator dynamically changes the background color of the chart based on the current market conditions. It takes into account bull and bear power, as well as the configured sensitivity levels to determine whether the market is in a strong or slowing bull/bear phase.
MACD and Signal Lines: The indicator also displays MACD and signal lines on the chart, helping traders identify potential bullish and bearish crossovers.
Histogram Bars: Histogram bars are used to represent the strength of bull and bear power. Above-zero bars indicate bullish strength, while below-zero bars indicate bearish strength.
How to Use the Indicator:
Begin by customizing the color settings for different market conditions to your preference.
Select a volume void function that aligns with your trading strategy and objectives.
Configure the void bull sensitivity and void bear sensitivity values carefully. These values should reflect your desired sensitivity to volume conditions.
Choose the source and length of moving averages based on your analysis requirements.
Pay attention to the background color of the chart. It will change dynamically based on the current market conditions, providing insights into the strength of bull and bear power.
Observe the MACD and signal lines for potential bullish or bearish crossovers, which can be used as additional confirmation signals.
Interpret the histogram bars to gauge the strength of bull and bear power.
Example of Usage:
As a swing trader with a focus on volume analysis, you can use the BBVV indicator to enhance your trading decisions. Here's an example of how you might use the indicator:
Select "Relative Volume Comparison" as the volume void function to assess volume relative to a simple moving average.
Configure void bull sensitivity and void bear sensitivity to match your risk tolerance and trading style.
Choose "SMA" as the moving average type with a suitable length.
Pay attention to the background color changes in the chart. Strong bull areas may indicate potential bullish opportunities, while strong bear areas may signal bearish conditions.
Monitor the MACD and signal lines for potential crossovers, aligning them with the background color to validate your trading decisions.
Use the histogram bars to assess the strength of bull and bear power, helping you gauge market sentiment.
Remember that the BBVV indicator is a valuable tool to complement your trading strategy. It provides insights into volume dynamics and market conditions, allowing you to make informed trading choices.
Be sure to adjust the indicator settings according to your trading preferences and always consider the broader market context in your analysis.

CCI - SWIFF KNIFECCI indicator swiff knife.
A lot of different usages of CCI ae possible with this script :
- 2 CCI lines crossovers.
- CCI - 0 Line crossovers
- CCI + Moving Average crossovers (many types of MA are available)
Filters can be added.
CCI can be used as a confirmation indicator, a continuation indicator, an exit indicator, a chopiness indicator .... It can even make coffee, who knows.

RSI Trendlines and Divergences█OVERVIEW
The "RSI Trendlines and Divergences" indicator is an advanced technical analysis tool that leverages the Relative Strength Index (RSI) to draw trendlines and detect divergences. Designed for traders seeking precise market signals, the indicator identifies key pivot points on the RSI chart, draws trendlines between pivots, and detects bullish and bearish divergences. It offers flexible settings, background coloring for breakout signals, and divergence labels, supported by alerts for key events. The indicator is universal and works across all markets (stocks, forex, cryptocurrencies) and timeframes.
█CONCEPTS
The indicator was developed to provide an alternative signal source for the RSI oscillator. Trendline breakouts and bounces off trendlines offer a broader perspective on potential price behavior. Combining these with traditional RSI signal interpretation can serve as a foundation for creating various trading strategies.
█FEATURES
- RSI and Pivot Calculation: Calculates RSI based on the selected source price (default: close) with a customizable period (default: 14). Identifies pivot points on RSI and price for trendlines and divergences.
- RSI Trendlines: Draws trendlines connecting RSI pivots (upper for downtrends, lower for uptrends) with optional extension (default: 30 bars). The trendline appears and generates a signal only after the first RSI crossover. Lines are colored (red for upper, green for lower).
- Trendline Fill: Widens the trendline with a tolerance margin expressed in RSI points, reducing signal noise and visually highlighting trend zones. Breaking this zone is a condition for generating signals, minimizing false signals. The tolerance margin can be increased or decreased.
- Divergence Detection: Identifies bullish and bearish divergences based on RSI and price pivots, displaying labels (“Bull” for bullish, “Bear” for bearish) with adjustable transparency. Divergence labels appear with a delay equal to the specified pivot length (default: 5). Higher values yield stronger signals but with greater delay.
- Breakout Signals: Generates signals when RSI crosses the trendline (bullish for upper lines, bearish for lower lines), with background coloring for signal confirmation.
- Alerts: Built-in alerts for:
Detection of bullish and bearish divergences.
Upper trendline crossover (bullish signal).
Lower trendline crossover (bearish signal).
- Customization: Allows adjustment of RSI length, pivot settings, line colors, fills, labels, and transparency of signals and background.
█HOW TO USE
Add the indicator to your TradingView chart via the Pine Editor or Indicators menu.
Configuring Settings.
RSI Settings
- RSI Length: Period for RSI calculation (default: 14).
- SMA Length: Period for RSI moving average (default: 9).
- Source: Source price for RSI (default: close).
Pivot Settings for Trend
- Left Bars for Pivot: Number of bars back for detecting pivots (default: 10).
- Right Bars for Pivot: Number of bars forward for confirming pivots (default: 10).
- Extension after Second Pivot: Number of bars to extend the trendline (default: 30, 0 = none). Extension increases the number of signals, while shortening reduces them.
- Tolerance: Deviation in RSI points to widen the breakout margin, reducing signal noise (default: 3.0).
Divergence Settings
- Enable Divergence Detection: Enables/disables divergence detection (default: enabled).
- Pivot Length for Divergence: Pivot period for divergences (default: 5).
Style Settings
- Upper Trendline Color: Color for downtrend lines (default: red).
- Upper Fill Color: Fill color for upper lines (default: red, transparency 70).
- Lower Trendline Color: Color for uptrend lines (default: green).
- Lower Fill Color: Fill color for lower lines (default: green, transparency 70).
- SMA Color: Color for RSI moving average (default: yellow).
- Bullish Divergence Color: Color for bullish labels (default: green).
- Bearish Divergence Color: Color for bearish labels (default: red).
- Text Color: Color for label text (default: white).
- Divergence Label Transparency: Transparency of labels (0-100, default: 40).
- Signal Background Transparency: Transparency of breakout signal background (0-100, default: 80).
Interpreting Signals
- Trendlines: Upper lines (red) indicate RSI downtrends, lower lines (green) indicate uptrends. The trendline appears and generates a signal only after the first RSI crossover. Trendline breakouts suggest potential trend reversals.
- Divergences: “Bull” labels indicate bullish divergence (potential rise), “Bear” labels indicate bearish divergence (potential decline), with a delay based on pivot length (default: 5). Divergences serve as confirmation or warning of trend reversal, not as standalone signals.
- Signal Background: Green background signals bullish breakouts, red background signals bearish breakouts.
- RSI Levels: Horizontal lines at 70 (overbought), 50 (midline), and 30 (oversold) help assess market zones.
- Alerts: Set up alerts in TradingView for divergences or trendline breakouts.
Combining with Other Tools: Use with support/resistance levels, Fibonacci levels, or other indicators for signal confirmation.
█APPLICATIONS
The "RSI Trendlines and Divergence" indicator is designed to identify trends and potential reversal points, supporting both trend-following and reversal strategies:
- Trend Confirmation: Trendlines indicate the RSI trend direction, with breakouts signaling potential reversals. The indicator is functional in traditional RSI usage, allowing classic RSI interpretation (e.g., returning from overbought/oversold zones). Combining trendline breakouts with RSI signal levels, such as a return from overbought or oversold zones paired with a trendline breakout, strengthens the signal.
- Divergence Detection: Divergences serve as confirmation or warning of trend reversal, not as standalone signals.
█NOTES
- Adjust settings (e.g., RSI length, pivots, tolerance) to suit your trading style and timeframe.
- Combine with other technical analysis tools to enhance signal accuracy.

AshishBediSPLAshishBediSPL: Dynamic Premium Analysis with Integrated Signals
This indicator provides a comprehensive view of combined options premiums by aggregating data from Call and Put contracts for a selected index and expiry. It integrates multiple popular technical indicators like EMA Crossover, Supertrend, VWAP, RSI, and SMA, allowing users to select their preferred tools for generating dynamic buy and sell signals directly on the premium chart.
AshishBediSPL" is a powerful TradingView indicator designed to analyze options premiums. It calculates a real-time combined premium for a chosen index (NIFTY, BANKNIFTY, FINNIFTY, etc.) and specific expiry date. You have the flexibility to visualize the premium of Call options, Put options, or a combined premium of both.
The indicator then overlays several popular technical analysis tools, which you can selectively enable:
EMA Crossover: Identify trend changes with configurable fast and slow Exponential Moving Averages.
Supertrend: Detect trend direction and potential reversal points.
VWAP (Volume Weighted Average Price): Understand the average price of the premium considering trading volume.
RSI (Relative Strength Index): Gauge momentum and identify overbought/oversold conditions.
SMA (Simple Moving Average): Analyze price smoothing and trend identification.
Based on your selected indicators, the tool generates clear "Buy" and "Sell" signals directly on the chart, helping you identify potential entry and exit points. Customizable alerts are also available to keep you informed.
Unlock a new perspective on options trading with "AshishBediSPL." This indicator focuses on the combined value of options premiums, giving you a consolidated view of market sentiment for a chosen index and expiry.
Instead of just looking at individual option prices, "AshishBediSPL" blends the Call and Put premiums (or focuses on one, based on your preference) and empowers you with a suite of built-in technical indicators: EMA, Supertrend, VWAP, RSI, and SMA. Pick the indicators that resonate with your strategy, and let the tool generate actionable buy and sell signals right on your chart. With customizable alerts, you'll never miss a crucial market move. Gain deeper insights and make more informed trading decisions with "AshishBediSPL.
Combined options premium: This accurately describes what your indicator calculates.
Selected index and expiry: Essential inputs for the indicator.
Call/Put options or combined: Explains the flexibility in data display.
Multiple technical indicators (EMA Crossover, Supertrend, VWAP, RSI, SMA): Lists the analysis tools included.
Buy/Sell signals: The primary output of the indicator.
Customizable alerts: A valuable feature for users.

DECODE Moving Average ToolkitDECODE Moving Average Toolkit: Your All-in-One MA Analysis Powerhouse!
This versatile indicator is designed to be your go-to solution for analysing trends, identifying potential entry/exit points, and staying ahead of market movements using the power of Moving Averages (MAs).
Whether you're a seasoned trader or just starting out, the Decode MAT offers a comprehensive suite of features in a user-friendly package.
Key Features:
Multiple Moving Averages: Visualize up to 10 Moving Averages simultaneously on your chart.
Includes 5 Exponential Moving Averages (EMAs) and 5 Simple Moving Averages (SMAs).
Easily toggle the visibility of each MA and customize its length to suit your trading style and the asset you're analyzing.
Dynamic MA Ribbons: Gain a clearer perspective on trend direction and strength with 5 configurable MA Ribbons.
Each ribbon is formed between a corresponding EMA and SMA (e.g., EMA 20 / SMA 20).
The ribbon color changes to indicate bullish (e.g., green) or bearish (e.g., red) sentiment, providing an intuitive visual cue.
Toggle ribbon visibility with a single click.
Powerful Crossover Alerts: Never miss a potential trading opportunity with up to 5 customizable MA Crossover Alerts.
Define your own fast and slow MAs for each alert from any of the 10 available MAs.
Receive notifications directly through TradingView when your specified MAs cross over or cross under.
Optionally display visual symbols (e.g., triangles ▲▼) directly on your chart at the exact crossover points for quick identification.
Highly Customizable:
Adjust the source price (close, open, etc.) for all MA calculations.
Fine-tune the appearance (colors, line thickness) of every MA line, ribbon, and alert symbol to match your charting preferences.
User-Friendly Interface: All settings are neatly organized in the indicator's input menu, making configuration straightforward and intuitive.
How Can You Use the Decode MAT in Your Trading?
This toolkit is incredibly versatile and can be adapted to various trading strategies:
Trend Identification:
Use longer-term MAs (e.g., 50, 100, 200 period) to identify the prevailing market trend. When prices are consistently above these MAs, it suggests an uptrend, and vice-versa.
Observe the MA ribbons: A consistently green ribbon can indicate a strong uptrend, while a red ribbon can signal a downtrend. The widening or narrowing of the ribbon can also suggest changes in trend momentum.
Dynamic Support & Resistance:
Shorter-term MAs (e.g., 10, 20 period EMAs) can act as dynamic levels of support in an uptrend or resistance in a downtrend. Look for price pullbacks to these MAs as potential entry opportunities.
Crossover Signals (Entries & Exits):
Golden Cross / Death Cross: Configure alerts for classic crossover signals. For example, a 50-period MA crossing above a 200-period MA (Golden Cross) is often seen as a long-term bullish signal. Conversely, a 50-period MA crossing below a 200-period MA (Death Cross) can be a bearish signal.
Shorter-Term Signals: Use crossovers of shorter-term MAs (e.g., EMA 10 crossing EMA 20) for more frequent, shorter-term trading signals. A fast MA crossing above a slow MA can signal a buy, while a cross below can signal a sell.
Use the on-chart symbols for quick visual confirmation of these crossover events.
Confirmation Tool:
Combine the Decode MAT with other indicators (like RSI, MACD, or volume analysis) to confirm signals and increase the probability of successful trades. For instance, a bullish MA crossover combined with an oversold RSI reading could strengthen a buy signal.
Multi-Timeframe Analysis:
Apply the toolkit across different timeframes to get a broader market perspective. A long-term uptrend on the daily chart, confirmed by a short-term bullish crossover on the 1-hour chart, can provide a higher-confidence entry.
The DECODE Moving Average Toolkit empowers you to tailor your MA analysis precisely to your needs.

Equity Curve with Trend Indicator (Long & Short) - SimulationOverview:
Market Regime Detector via Virtual Equity Curve is a unique indicator that simulates the performance of a trend-following trading system—incorporating both long and short trades—to help you identify prevailing market regimes. By generating a “virtual equity” curve based on simple trend signals and applying trend analysis directly on that curve, this indicator visually differentiates trending regimes from mean-reverting (or sideways) periods. The result is an intuitive display where green areas indicate a trending (bullish) regime (i.e., where trend-following strategies are likely to perform well) and red areas indicate a mean-reverting (bearish) regime.
Features:
Simulated Trade Performance:
Uses a built-in trend-following logic (a simple 10/50 SMA crossover example) to simulate both long and short trades. This simulation creates a virtual equity curve that reflects the cumulative performance of the system over time.
Equity Trend Analysis:
Applies an Exponential Moving Average (EMA) to the simulated equity curve to filter short-term noise. The EMA acts as a trend filter, enabling the indicator to determine if the equity curve is in an upward (trending) or downward (mean-reverting) phase.
Dynamic Visual Regime Detection:
Fills the area between the equity curve and its EMA with green when the equity is above the EMA (indicating a healthy trending regime) and red when below (indicating a mean-reverting or underperforming regime).
Customizable Parameters:
Easily adjust the initial capital, the length of the equity EMA, and other settings to tailor the simulation and visual output to your trading style and market preferences.
How It Works:
Trade Simulation:
The indicator generates trading signals using a simple SMA crossover:
When the 10-period SMA is above the 50-period SMA, it simulates a long entry.
When the 10-period SMA is below the 50-period SMA, it simulates a short entry. The virtual equity is updated bar-by-bar based on these simulated positions.
Equity Trend Filtering:
An EMA is calculated on the simulated equity curve to smooth out fluctuations. The relative position of the equity curve versus its EMA is then used as a proxy for the market regime:
Bullish Regime: Equity is above its EMA → fill area in green.
Bearish Regime: Equity is below its EMA → fill area in red.
Visualization:
The indicator plots:
A gray line representing the simulated equity curve.
An orange line for the EMA of the equity curve.
A dynamic fill between the two lines, colored green or red based on the prevailing regime.
Inputs & Customization:
Initial Capital: Set your starting virtual account balance (default: 10,000 USD).
Equity EMA Length: Specify the lookback period for the EMA applied to the equity curve (default: 30).
Trend Signal Logic:
The current implementation uses a simple SMA crossover for demonstration purposes. Users can modify or replace this logic with their own trend-following indicator to tailor the simulation further.

300-Candle Weighted Average Zones w/50 EMA SignalsThis indicator is designed to deliver a more nuanced view of price dynamics by combining a custom, weighted price average with a volatility-based zone and a trend filter (in this case, a 50-period exponential moving average). The core concept revolves around capturing the overall price level over a relatively large lookback window (300 candles) but with an intentional bias toward recent market activity (the most recent 20 candles), thereby offering a balance between long-term context and short-term responsiveness. By smoothing this weighted average and establishing a “zone” of standard deviation bands around it, the indicator provides a refined visualization of both average price and its recent volatility envelope. Traders can then look for confluence with a standard trend filter, such as the 50 EMA, to identify meaningful crossover signals that may represent trend shifts or opportunities for entry and exit.
What the Indicator Does:
Weighted Price Average:
Instead of using a simple or exponential moving average, this indicator calculates a custom weighted average price over the past 300 candles. Most historical candles receive a base weight of 1.0, but the most recent 20 candles are assigned a higher weight (for example, a weight of 2.0). This weighting scheme ensures that the calculation is not simply a static lookback average; it actively emphasizes current market conditions. The effect is to generate an average line that is more sensitive to the most recent price swings while still maintaining the historical context of the previous 280 candles.
Smoothing of the Weighted Average:
Once the raw weighted average is computed, an exponential smoothing function (EMA) is applied to reduce noise and produce a cleaner, more stable average line. This smoothing helps traders avoid reacting prematurely to minor price fluctuations. By stabilizing the average line, traders can more confidently identify actual shifts in market direction.
Volatility Zone via Standard Deviation Bands:
To contextualize how far price can deviate from this weighted average, the indicator uses standard deviation. Standard deviation is a statistical measure of volatility—how spread out the price values are around the mean. By adding and subtracting one standard deviation from the smoothed weighted average, the indicator plots an upper band and a lower band, creating a zone or channel. The area between these bands is filled, often with a semi-transparent color, highlighting a volatility corridor within which price and the EMA might oscillate.
This zone is invaluable in visualizing “normal” price behavior. When the 50 EMA line and the weighted average line are both within this volatility zone, it indicates that the market’s short- to mid-term trend and its average pricing are aligned well within typical volatility bounds.
Incorporation of a 50-Period EMA:
The inclusion of a commonly used trend filter, the 50 EMA, adds another layer of context to the analysis. The 50 EMA, being a widely recognized moving average length, is often considered a baseline for intermediate trend bias. It reacts faster than a long-term average (like a 200 EMA) but is still stable enough to filter out the market “chop” seen in very short-term averages.
By overlaying the 50 EMA on this custom weighted average and the surrounding volatility zone, the trader gains a dual-dimensional perspective:
Trend Direction: If the 50 EMA is generally above the weighted average, the short-term trend is gaining bullish momentum; if it’s below, the short-term trend has a bearish tilt.
Volatility Normalization: The bands, constructed from standard deviations, provide a sense of whether the price and the 50 EMA are operating within a statistically “normal” range. If the EMA crosses the weighted average within this zone, it signals a potential trend initiation or meaningful shift, as opposed to a random price spike outside normal volatility boundaries.
Why a Trader Would Want to Use This Indicator:
Contextualized Price Level:
Standard MAs may not fully incorporate the most recent price dynamics in a large lookback window. By weighting the most recent candles more heavily, this indicator ensures that the trader is always anchored to what the market is currently doing, not just what it did 100 or 200 candles ago.
Reduced Whipsaw with Smoothing:
The smoothed weighted average line reduces noise, helping traders filter out inconsequential price movements. This makes it easier to spot genuine changes in trend or sentiment.
Visual Volatility Gauge:
The standard deviation bands create a visual representation of “normal” price movement. Traders can quickly assess if a breakout or breakdown is statistically significant or just another oscillation within the expected volatility range.
Clear Trade Signals with Confirmation:
By integrating the 50 EMA and designing signals that trigger only when the 50 EMA crosses above or below the weighted average while inside the zone, the indicator provides a refined entry/exit criterion. This avoids chasing breakouts that occur in abnormal volatility conditions and focuses on those crossovers likely to have staying power.
How to Use It in an Example Strategy:
Imagine you are a swing trader looking to identify medium-term trend changes. You apply this indicator to a chart of a popular currency pair or a leading tech stock. Over the past few days, the 50 EMA has been meandering around the weighted average line, both confined within the standard deviation zone.
Bullish Example:
Suddenly, the 50 EMA crosses decisively above the weighted average line while both are still hovering within the volatility zone. This might be your cue: you interpret this crossover as the 50 EMA acknowledging the recent upward shift in price dynamics that the weighted average has highlighted. Since it occurred inside the normal volatility range, it’s less likely to be a head-fake. You place a long position, setting an initial stop just below the lower band to protect against volatility.
If the price continues to rise and the EMA stays above the average, you have confirmation to hold the trade. As the price moves higher, the weighted average may follow, reinforcing your bullish stance.
Bearish Example:
On the flip side, if the 50 EMA crosses below the weighted average line within the zone, it suggests a subtle but meaningful change in trend direction to the downside. You might short the asset, placing your protective stop just above the upper band, expecting that the statistically “normal” level of volatility will contain the price action. If the price does break above those bands later, it’s a sign your trade may not work out as planned.
Other Indicators for Confluence:
To strengthen the reliability of the signals generated by this weighted average zone approach, traders may want to combine it with other technical studies:
Volume Indicators (e.g., Volume Profile, OBV):
Confirm that the trend crossover inside the volatility zone is supported by volume. For instance, an uptrend crossover combined with increasing On-Balance Volume (OBV) or volume spikes on up candles signals stronger buying pressure behind the price action.
Momentum Oscillators (e.g., RSI, Stochastics):
Before taking a crossover signal, check if the RSI is above 50 and rising for bullish entries, or if the Stochastics have turned down from overbought levels for bearish entries. Momentum confirmation can help ensure that the trend change is not just an isolated random event.
Market Structure Tools (e.g., Pivot Points, Swing High/Low Analysis):
Identify if the crossover event coincides with a break of a previous pivot high or low. A bullish crossover inside the zone aligned with a break above a recent swing high adds further strength to your conviction. Conversely, a bearish crossover confirmed by a breakdown below a previous swing low can make a short trade setup more compelling.
Volume-Weighted Average Price (VWAP):
Comparing where the weighted average zone lies relative to VWAP can provide institutional insight. If the bullish crossover happens while the price is also holding above VWAP, it can mean that the average participant in the market is in profit and that the trend is likely supported by strong hands.
This indicator serves as a tool to balance long-term perspective, short-term adaptability, and volatility normalization. It can be a valuable addition to a trader’s toolkit, offering enhanced clarity and precision in detecting meaningful shifts in trend, especially when combined with other technical indicators and robust risk management principles.

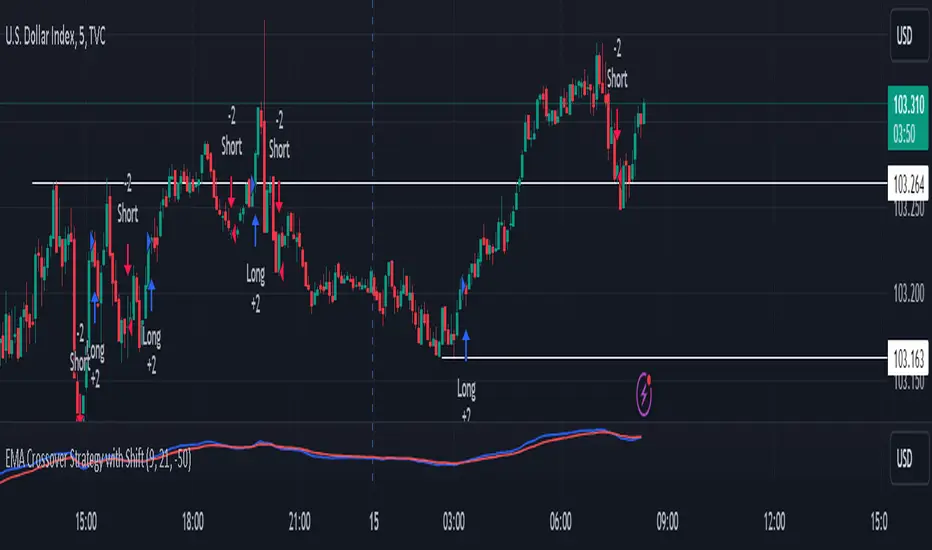
Dont make me crossStrategy Overview
This trading strategy utilizes Exponential Moving Averages (EMAs) to generate buy and sell signals based on the crossover of two EMAs, which are shifted downwards by 50 points. The strategy aims to identify potential market reversals and trends based on these crossovers.
Components of the Strategy
Exponential Moving Averages (EMAs):
Short EMA: This is calculated over a shorter period (default is 9 periods) and is more responsive to recent price changes.
Long EMA: This is calculated over a longer period (default is 21 periods) and provides a smoother view of the price trend.
Both EMAs are adjusted by a fixed shift amount of -50 points.
Input Parameters:
Short EMA Length: The period used to calculate the short-term EMA. This can be adjusted based on the trader's preference or market conditions.
Long EMA Length: The period used for the long-term EMA, also adjustable.
Shift Amount: A fixed value (default -50) that is subtracted from both EMAs to shift their values downwards. This is useful for visual adjustments or specific strategy requirements.
Plotting:
The adjusted EMAs are plotted on the price chart. The short EMA is displayed in blue, and the long EMA is displayed in red. This visual representation helps traders identify the crossover points easily.
Signal Generation:
Buy Signal: A buy signal is generated when the short EMA crosses above the long EMA. This is interpreted as a bullish signal, indicating potential upward price movement.
Sell Signal: A sell signal occurs when the short EMA crosses below the long EMA, indicating potential downward price movement.
Trade Execution:
When a buy signal is triggered, the strategy enters a long position.
Conversely, when a sell signal is triggered, the strategy enters a short position.
Trading Logic
Market Conditions: The strategy is most effective in trending markets. During sideways or choppy market conditions, it may generate false signals.
Risk Management: While this script does not include explicit risk management features (like stop-loss or take-profit), traders should consider implementing these to manage their risk effectively.
Customization
Traders can customize the EMA lengths and the shift amount based on their analysis and preferences.
The strategy can also be enhanced with additional indicators, such as volume or volatility measures, to filter signals further.
Use Cases
This strategy can be applied to various timeframes, such as intraday, daily, or weekly charts, depending on the trader's style.
It is suitable for both novice and experienced traders, offering a straightforward approach to trading based on technical analysis.
Summary
The EMA Crossover Strategy with a -50 shift is a straightforward technical analysis approach that capitalizes on the momentum generated by the crossover of short and long-term EMAs. By shifting the EMAs downwards, the strategy can help traders visualize potential entry and exit points more clearly, although it's important to consider additional risk management and market context for effective trading.
120 GOAT - Simple Moving Average Breakout IndicatorThe 120 GOAT indicator is a powerful tool designed to help traders identify key breakout points relative to the 120-day Simple Moving Average (SMA). This indicator tracks when the price crosses above or below the 120-day SMA, marking these transition points on the chart with dynamic labels that indicate the percentage change in price since the last crossover.
With the 120 GOAT indicator, traders can:
Identify trend reversals when the price crosses the 120-day SMA.
Monitor price momentum and potential support or resistance levels relative to the 120-day SMA.
Receive alerts when a breakout occurs above or below the 120-day SMA, ensuring they never miss an important market move.
Key Features:
120-day SMA: A customizable 120-day Simple Moving Average that serves as a benchmark for price movements.
Dynamic Labels: The indicator provides labels showing the number of days since the last crossover and the percentage change in price from the previous crossover.
Color-coded Breakout Signals: Labels change color based on the nature of the breakout and price movement:
Above SMA: Green for positive price change, blue for negative.
Below SMA: Orange for positive price change, red for negative.
Price Line Tracking: Displays the current price level relative to the SMA.
Custom Alerts: Set alerts for when the price crosses above or below the 120-day SMA to stay updated on significant market events.
How to Use the 120 GOAT Indicator:
Add the Indicator to Your Chart:
Open TradingView and go to the chart where you want to use the 120 GOAT indicator.
Click on the "Indicators" button at the top of the chart.
Search for "120 GOAT" and select it from the list to apply it to your chart.
Customize the Settings:
Show 120 MA: Toggle this option on if you want the 120-day SMA to be displayed on your chart.
MA Color: Choose your preferred color for the 120-day SMA line.
SMA Length: You can adjust the length of the moving average if you prefer a different period. The default is set to 120 days.
Interpret the Signals:
When the price crosses above the 120-day SMA, the indicator will display a label below the price bar showing the number of days since the last crossover and the percentage change in price. If the price change is positive, the label is green; if negative, it is blue.
When the price crosses below the 120-day SMA, a similar label will appear above the price bar. If the price change is positive, the label is orange; if negative, it is red.
Set Alerts for Key Market Movements:
Go to the Alerts panel and create a new alert.
Select 120 GOAT as the condition.
Choose either "Price Crossed Above SMA 120" or "Price Crossed Below SMA 120" as the alert criteria.
Configure the alert frequency and other settings as needed, then click "Create."
Monitor the Indicator for Trading Opportunities:
Use the breakout signals and percentage change information to identify potential trading opportunities.
Combine this indicator with other technical analysis tools to validate trade setups and enhance decision-making.
Disclaimer: The 120 GOAT indicator is designed for educational purposes and should not be considered as financial advice. Always conduct your own research and consult with a professional financial advisor before making trading decisions.

Enhanced Alligator Trend Indicator By Er. Parvez HaleemPurpose: The Enhanced Alligator Trend Indicator aims to identify strong and reliable buy and sell signals on the price chart by combining the Alligator Indicator with trend strength and volume filters. It is specifically designed for use on a 1-minute chart to enhance precision in short-term trading decisions.
Components:
Alligator Indicator:
Jaw Line (Blue): Calculated as a simple moving average (SMA) of the closing price over a specified period (default: 13 bars). Represents the long-term trend.
Teeth Line (Red): Calculated as a simple moving average (SMA) of the closing price over a shorter period (default: 8 bars). Represents the medium-term trend.
Lips Line (Green): Calculated as a simple moving average (SMA) of the closing price over an even shorter period (default: 5 bars). Represents the short-term trend.
Trend Strength Indicator:
Relative Strength Index (RSI): Measures the strength of the current trend, using a default period of 14 bars. RSI values above 50 suggest a bullish trend, while values below 50 suggest a bearish trend.
Volume Filter:
Volume Threshold: Filters signals based on trading volume to ensure they only appear when volume exceeds a specified threshold (default: 100,000). This helps to avoid low-volume noise and enhance signal reliability.
Additional Trend Filters:
Short-Term SMA: A simple moving average with a default period of 20 bars, used to assess short-term trend direction.
Long-Term SMA: A simple moving average with a default period of 50 bars, used to assess long-term trend direction.
SMA Crossover: A bullish crossover occurs when the short-term SMA is above the long-term SMA, and a bearish crossover occurs when the short-term SMA is below the long-term SMA.
Signal Generation:
Buy Signal: Generated when:
The Lips line is above the Teeth line, and the Teeth line is above the Jaw line (indicating a bullish alignment in the Alligator Indicator).
The RSI is above 50 (indicating strong bullish trend strength).
The trading volume exceeds the specified volume threshold (indicating sufficient trading activity).
The short-term SMA is above the long-term SMA (confirming a bullish trend).
Sell Signal: Generated when:
The Lips line is below the Teeth line, and the Teeth line is below the Jaw line (indicating a bearish alignment in the Alligator Indicator).
The RSI is below 50 (indicating strong bearish trend strength).
The trading volume exceeds the specified volume threshold (indicating sufficient trading activity).
The short-term SMA is below the long-term SMA (confirming a bearish trend).
Plotting on Chart:
Alligator Lines: The Jaw, Teeth, and Lips lines are plotted directly on the price chart in blue, red, and green, respectively, to indicate the long-term, medium-term, and short-term trends.
Buy/Sell Signals: Buy signals are plotted below the price bars in green, and sell signals are plotted above the price bars in red. These signals are marked with labels ("BUY" and "SELL") to clearly indicate trading opportunities.
Debugging: RSI and SMA lines are plotted but hidden by default. They can be revealed for verification purposes to ensure the correctness of the indicator’s calculations.
Alerts:
Buy Alert: Triggers when a buy signal condition is met, sending a notification that a buy opportunity has been identified.
Sell Alert: Triggers when a sell signal condition is met, sending a notification that a sell opportunity has been identified.

Volatility Adjusted Weighted DEMA [BackQuant]Volatility Adjusted Weighted DEMA
The Volatility Adjusted Weighted Double Exponential Moving Average (VAWDEMA) by BackQuant is a sophisticated technical analysis tool designed for traders seeking to integrate volatility into their moving average calculations. This innovative indicator adjusts the weighting of the Double Exponential Moving Average (DEMA) according to recent volatility levels, offering a more dynamic and responsive measure of market trends.
Primarily, the single Moving average is very noisy, but can be used in the context of strategy development, where as the crossover, is best used in the context of defining a trading zone/ macro uptrend on higher timeframes.
Why Volatility Adjustment is Beneficial
Volatility is a fundamental aspect of financial markets, reflecting the intensity of price changes. A volatility adjustment in moving averages is beneficial because it allows the indicator to adapt more quickly during periods of high volatility, providing signals that are more aligned with the current market conditions. This makes the VAWDEMA a versatile tool for identifying trend strength and potential reversal points in more volatile markets.
Understanding DEMA and Its Advantages
DEMA is an indicator that aims to reduce the lag associated with traditional moving averages by applying a double smoothing process. The primary benefit of DEMA is its sensitivity and quicker response to price changes, making it an excellent tool for trend following and momentum trading. Incorporating DEMA into your analysis can help capture trends earlier than with simple moving averages.
The Power of Combining Volatility Adjustment with DEMA
By adjusting the weight of the DEMA based on volatility, the VAWDEMA becomes a powerful hybrid indicator. This combination leverages the quick responsiveness of DEMA while dynamically adjusting its sensitivity based on current market volatility. This results in a moving average that is both swift and adaptive, capable of providing more relevant signals for entering and exiting trades.
Core Logic Behind VAWDEMA
The core logic of the VAWDEMA involves calculating the DEMA for a specified period and then adjusting its weighting based on a volatility measure, such as the average true range (ATR) or standard deviation of price changes. This results in a weighted DEMA that reflects both the direction and the volatility of the market, offering insights into potential trend continuations or reversals.
Utilizing the Crossover in a Trading System
The VAWDEMA crossover occurs when two VAWDEMAs of different lengths cross, signaling potential bullish or bearish market conditions. In a trading system, a crossover can be used as a trigger for entry or exit points:
Bullish Signal: When a shorter-period VAWDEMA crosses above a longer-period VAWDEMA, it may indicate an uptrend, suggesting a potential entry point for a long position.
Bearish Signal: Conversely, when a shorter-period VAWDEMA crosses below a longer-period VAWDEMA, it might signal a downtrend, indicating a possible exit point or a short entry.
Incorporating VAWDEMA crossovers into a trading strategy can enhance decision-making by providing timely and adaptive signals that account for both trend direction and market volatility. Traders should combine these signals with other forms of analysis and risk management techniques to develop a well-rounded trading strategy.
Alert Conditions For Trading
alertcondition(vwdema>vwdema , title="VWDEMA Long", message="VWDEMA Long - {{ticker}} - {{interval}}")
alertcondition(vwdema

Eurobond CurveABOUT
Dynamically plots 3 no. forward EUROBOND curves. When the curves converge (or worse crossover) there is higher risk of financial uncertainty and potential market correction.
The Eurobond Curves work in a similar way to treasury "yield curve inversion"; except the EUROBOND curves can signal much earlier than Treasuries therefore providing a leading indicator.
The indicator looks the the "near" (next year EUROBOND), "mid" (EUROBOND 2 years out) and "far" (EUROBOND 5 years out) to assess for crossovers.
When the "near" and "mid" curves crossover the "far" curve, concerning economic conditions are developing and it may be a good idea to reduce risk exposure to markets.
LIMITATIONS
The EUROBOND curve crossover events are rare, and this indicator uses data back to 2005 (using approximately 25 TradingView security functions). Given there are relatively few crossover events, the reliability of this indicator should be considered low. Nonetheless, there is decent alignment with treasury yield curve inversions in the 20 year period assessed. Given treasury yield curve inversions have predicted every recession for the last 70 years, we still think the EUROBOND Curves are a useful datapoint to monitor into the future and provide confluence to other risk management strategies.

4 SMAs & Inside Bar (Colored)SMAs and Inside Bar strategy is very common as far as Technical analysis is concern. This script is a combination of 10-20-50-200 SMA and Inside Bar Candle Identification.
SMA Crossover:
4 SMAs (10, 20, 50 & 200) are combined here in one single indicator.
Crossover signal for Buy as "B" will be shown in the chart if SMA 10 is above 20 & 50 and SMA 20 is above 50.
Crossover signal for Sell as "S" will be shown in the chart if SMA 10 is below 20 & 50 and SMA 20 is below 50.
Inside Bar Identification:
This is to simply identify if there is a inside bar candle. The logic is very simple - High of the previous candle should be higher than current candle and low of the previous candle should be lower than the current candle.
If the previous candle is red, the following candle would be Yellow - which may give some bullish view in most of the cases but not always
If the previous candle is green, the following candle would be Black - which may give some bearish view in most of the cases but not always
Be Cautious when you see alternate yellow and black candle, it may give move on the both side
Please comment if you have any interesting ideas to improve this indicator.

Average True Range Trailing Stops
Choices of Alerts supported (mainly for free members with only one alert):
Long crossover : to inform when a long position is available
Short crossover: to inform when a long position is available
Long/Short crossover : to inform when any position is available

Stochastic Momentum Index (SMI)Stochastic Momentum Index (SMI) or Stoch MTM is used to find oversold and overbought zones. It also helps to figureout whether to enter short trade or long trade.
Red Shade in the Top indicates that the stock is oversold and the Green shade in the bottom indicates overbought.
Strategy:
Enter Long once the Overbought Zone ended and there's a crossover below -35.
Exit Long once the oversold zone is ended and there's a crossover.
Enter Short once the oversold zone is ended and there's a crossover above 35.
Exit Short once the Overbought Zone ended and there's a crossover.
Backup: Always use with another indicator because there will be multiple up and down movement in one Trend.

parademi super📌 Indicator Information: EMA 5-8-13 with Noise Reduction
This Pine Script indicator is designed to highlight EMA crossovers and filter out weak or noisy signals by combining multiple confirmation tools.
🔹 Core Logic
Plots three EMAs: 5, 8, and 13.
Colors bars:
Green when price is above all EMAs.
Red when price is below all EMAs.
Orange when price crosses EMA 8.
Displays arrows for 5/8 and 8/13 EMA crossovers (up = bullish, down = bearish).
🔹 Noise Reduction Filters
The script integrates several optional filters to reduce false signals:
Trend alignment: Only signals when EMAs are properly aligned (5>8>13 for bullish, 5<8<13 for bearish).
Close confirmation: Requires bar close beyond EMA 8 by a margin.
ADX filter: Ensures sufficient trend strength (custom ADX calculation).
MFI filter: Confirms with Money Flow Index thresholds.
Volatility filter: Blocks signals when EMAs are too close or ATR is too low.
Higher timeframe (HTF) filter: Confirms direction with EMA 8/13 crossover on a higher timeframe.
Debounce: Minimum bar distance between signals to avoid repetition.
🔹 Customization
All filters and thresholds are adjustable in the input menu:
Enable/disable specific filters.
Change EMA lengths, ADX/MFI parameters, ATR threshold, or HTF resolution.
Adjust the minimum bars between signals for cleaner charts.
🔹 Alerts
Built-in alerts are included for each crossover type (Bull/Bear for 5/8 and 8/13).
⚠️ Note: This is an educational tool for technical analysis. Always backtest and confirm with your own strategy before making trading decisions.

MEMA X-OL9+A. 5, 10, 20, 50 ema's
B. When the 10 goes below the 20 it has shades of red between the 10 and 20.
C. When there is a downward crossover, There will be a Red arrow pointing down.
D. When the 10 is moving closer (upward) towards the 20 it has orange shading. I use this to catch 10 over 20 crossovers.
E. When there is a crossover 10 over 20 it will shade green and have a gold arrow pointing upward. A little redundant, because you'll see the crossover from the shading.
F. Finally there will be smaller blue arrows that represent when there is a close of a candle, if it is lower than the prior candle.
All customizable and defaults should work.

Scalping Line Strategy📌 Scalping Line Strategy – A Precision Crossover System
🔎 Overview
The Scalping Line Strategy is a short-term trading system built around the concept of momentum-driven crossovers between a smoothed moving average filter and a fast signal line. It is designed for scalpers and intraday traders who seek clear entry signals, minimal lag, and adaptive filtering to fit volatile market conditions.
At its core, the strategy uses a custom signal line ("Scalping Line"), which is derived from the difference between a double-smoothed moving average and a shorter-period signal line. Trade entries are triggered when this Scalping Line crosses above or below zero, providing a clean and rules-based framework for both long and short setups.
⚙️ Core Logic
Main Trend Filter – A double-smoothed moving average is calculated over a configurable period (default 100). This reduces noise and provides a more robust backbone for scalping signals.
Percent-Based Filter – To avoid false signals, a customizable percentage filter adjusts how closely the system “respects” price deviations from the moving average. This helps filter out insignificant fluctuations.
Signal Line – A shorter-period simple moving average (default 7) provides faster responsiveness to recent price action.
Scalping Line (SLI) – Calculated as the difference between the fast signal line and the smoothed moving average. When the SLI crosses zero, it signals a potential momentum shift.
SLI > 0 → Momentum bias is bullish.
SLI < 0 → Momentum bias is bearish.
🎯 Trade Direction & Flexibility
Trade Direction Control:
Choose between Long Only, Short Only, or Both to tailor the system to your trading style.
Signal Flip Option:
By default, long entries occur when the SLI crosses below zero, and shorts when it crosses above zero. This orientation can be flipped, allowing for alternative interpretations of the signals depending on how you want to capture momentum in your market.
🕒 Time Window Filtering
For intraday traders, a time filter can be enabled to restrict signals to specific trading sessions (e.g., 9 AM – 4 PM EST). This is particularly useful when trading assets such as equities or futures that have strong intraday volatility windows.
📈 Visuals & Clarity
Scalping Line Plot: Displayed as a dynamic oscillator around a zero baseline.
Histogram Fill: Green when above zero (bullish bias), red when below zero (bearish bias).
Signal Markers: Clear arrows mark long and short entries at crossover points.
Zero Line Reference: A flat gray line at zero assists in visually gauging momentum shifts.
🚀 Strategy Execution
Long Entry: Triggered when SLI crosses below zero (or above zero if flip is enabled) within allowed session hours.
Short Entry: Triggered when SLI crosses above zero (or below zero if flip is enabled) within allowed session hours.
Built-in Signal Cancels: Pending entries are canceled if conditions are no longer valid, ensuring no stale trades remain active.
✅ Best Use Cases
Markets: Works across equities, forex, crypto, and futures with sufficient intraday volatility.
Timeframes: Most effective on 1m to 15m charts for scalping setups, but adaptable to higher frames for swing trading.
Style: Traders who appreciate simple, rules-based momentum crossovers will find this system easy to follow and highly adaptable.
⚠️ Risk Management Note
This strategy is strictly an entry signal framework. Position sizing, stop-loss, and take-profit rules must be overlaid based on your risk management style. Always validate results with backtesting and forward testing before applying to live trading accounts.
📜 Final Thoughts
The Scalping Line Strategy offers a refined, easy-to-interpret approach to intraday trading. By combining smoothed moving averages, adaptive filtering, and flexible signal options, it helps traders identify short-term momentum shifts with clarity and confidence, making it a highly configurable tool for scalping-focused strategies.

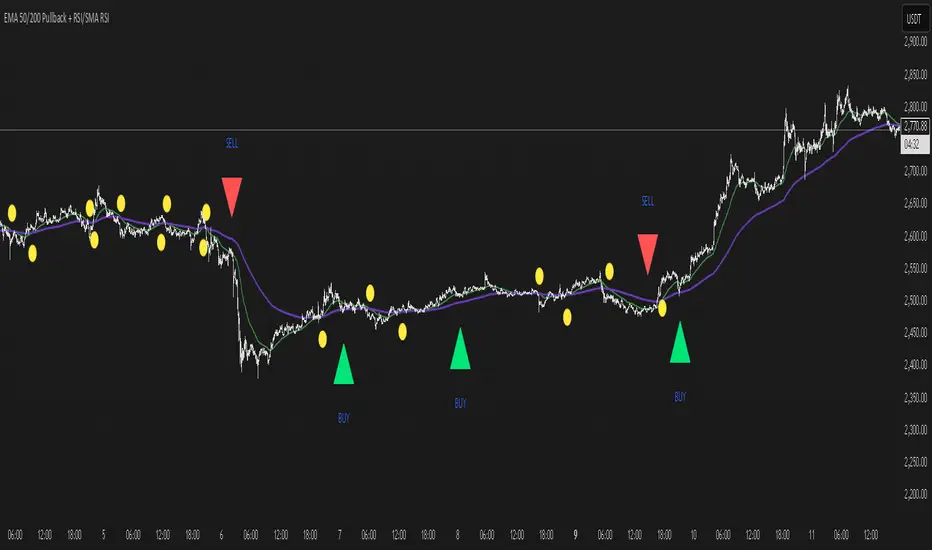
EMA 50/200 Pullback + RSI/SMA RSI
Strategy Description: EMA 50/200 Pullback + RSI/SMA RSI
1. Trend Identification with EMA:
Uses two Exponential Moving Averages (EMA): a fast EMA (default 50) and a slow EMA (default 200).
When the fast EMA crosses above the slow EMA (bullish crossover), an uptrend is identified.
When the fast EMA crosses below the slow EMA (bearish crossover), a downtrend is identified.
The lengths of both EMAs are fully customizable.
2. EMA Distance Condition:
Signals are only valid when the absolute percentage distance between the two EMAs is within a user-defined range (default: 0.4% to 1%).
This helps filter out weak signals when the EMAs are too close or too far apart.
3. Pullback Condition:
After a new trend is detected (EMA crossover), the strategy waits for the price to pull back to touch or cross the fast EMA (EMA 50).
This ensures entries are not taken immediately at the crossover, but after a retracement to a dynamic support/resistance area.
4. RSI Confirmation:
Uses the RSI indicator (default 14) and its Simple Moving Average (SMA RSI, default 14).
Buy signal: RSI crosses above its SMA.
Sell signal: RSI crosses below its SMA.
Both RSI and SMA RSI lengths are fully customizable.
5. Entry Rules:
The indicator only gives the first buy/sell signal after each EMA crossover (start of a new trend), and will not repeat signals until the next EMA crossover.
Buy signal:
Fast EMA crosses above slow EMA
EMA distance is within the valid range
Price pulls back to the fast EMA
RSI crosses above its SMA
Sell signal:
Fast EMA crosses below slow EMA
EMA distance is within the valid range
Price pulls back to the fast EMA
RSI crosses below its SMA
6. Customization:
All parameters (EMA lengths, RSI length, SMA RSI length, EMA distance range) can be adjusted in the indicator’s settings.
Note:
This is a signal indicator, not a complete trading strategy. For real trading, always combine with risk management and additional confirmations.
MA Cross MTF Alert (Miu)This script extends the classic moving average crossover strategy with support for up to 8 user-defined symbols across 4 custom timeframes, combined with a visual and alert system designed for traders who monitor multiple assets simultaneously.
Unlike traditional MA crossover tools, this script enables traders to receive real-time alerts for crossovers across multiple assets and timeframes, even when the script is not actively displayed on the chart — ideal for passive monitoring in multi-asset strategies.
What it does:
This script calculates two customizable moving averages (SMA or EMA) for each selected symbol and timeframe.
It then tracks crossover events:
- Bullish crossover when the fast MA crosses above the slow MA
- Bearish crossunder when the fast MA crosses below the slow MA
On the chart, it also displays the crossover signals for the current symbol and timeframe using color-coded cross icons.
Key features:
- Select SMA or EMA type for both moving averages
- Customize MA lengths and colors
- Works with any asset and timeframe
- Alerts include symbol and timeframe info for easy identification
How to use:
1) Add the indicator to your chart.
2) Choose the moving average type and lengths.
3) Enable/disable any of the 8 symbols and 4 timeframes.
4) Set up TradingView alerts by clicking “Create Alert” and selecting one of the alert() calls.
5) You will receive a message like:
BTC (1h) | MA Crossover ▲ or ETH (15m) | MA Crossunder ▼
Technical note:
This script uses request.security() to retrieve moving average values from up to 8 different symbols and 4 different timeframes in real time.
Feel free to leave your feedback or suggestions in the comments section below.
Enjoy!

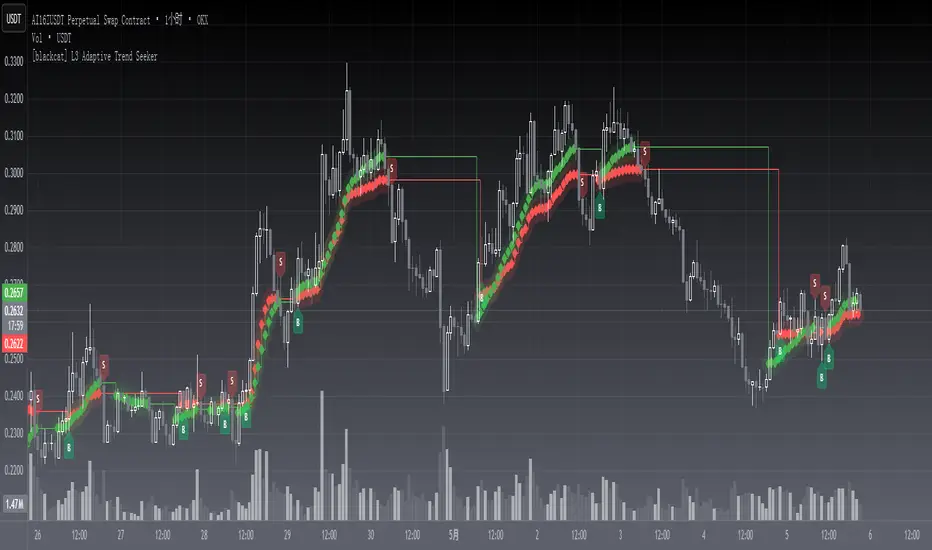
[blackcat] L3 Adaptive Trend SeekerOVERVIEW
The indicator is designed to help traders identify dynamic trends in various markets efficiently. It employs advanced calculations including Dynamic Moving Averages (DMAs) and multiple moving averages to filter out noise and provide clear buy/sell signals 📈✨. By utilizing innovative algorithms that adapt to changing market conditions, this tool enables users to make informed decisions across different timeframes and asset classes.
This versatile indicator serves both novice and experienced traders seeking reliable ways to navigate volatile environments. Its primary objective is to simplify complex trend analysis into actionable insights, making it an indispensable addition to any trader’s arsenal ⚙️🎯.
FEATURES
Customizable Dynamic Moving Average: Calculates an adaptive moving average tailored to specific needs using customizable coefficients.
Trend Identification: Utilizes multi-period moving averages (e.g., short-term, medium-term, long-term) to discern prevailing trends accurately.
Crossover Alerts: Provides visual cues via labels when significant crossover events occur between key indicators.
Adjusted MA Plots: Displays steplines colored according to the current trend direction (green for bullish, red for bearish).
Historical Price Analysis: Analyzes historical highs and lows over specified periods, ensuring robust trend identification.
Conditional Signals: Generates bullish/bearish conditions based on predefined rules enhancing decision-making efficiency.
HOW TO USE
Script Installation:
Copy the provided code and add it under Indicators > Add Custom Indicator within TradingView.
Choose an appropriate name and enable it on your desired charts.
Parameter Configuration:
Adjust the is_trend_seeker_active flag to activate/deactivate the core functionality as needed.
Modify other parameters such as smoothing factors if more customized behavior is required.
Interpreting Trends:
Observe the steppled lines representing the long-term/trend-adjusted moving averages:
Green indicates a bullish trend where prices are above the dynamically calculated threshold.
Red signifies a bearish environment with prices below respective levels.
Pay attention to labels marked "B" (for Bullish Crossover) and "S" (for Bearish Crossover).
Signal Integration:
Incorporate these generated signals within broader strategies involving support/resistance zones, volume data, and complementary indicators for stronger validity.
Use crossover alerts responsibly by validating them against recent market movements before execution.
Setting Up Alerts:
Configure alert notifications through TradingView’s interface corresponding to crucial crossover events ensuring timely responses.
Backtesting & Optimization:
Conduct extensive backtests applying diverse datasets spanning varied assets/types verifying robustness amidst differing conditions.
Refine parameters iteratively improving overall effectiveness and minimizing false positives/negatives.
EXAMPLE SCENARIOS
Swing Trading: Employ the stepline crossovers coupled with momentum oscillators like RSI to capitalize on intermediate trend reversals.
Day Trading: Leverage rapid adjustments offered by short-medium term MAs aligning entries/exits alongside intraday volatility metrics.
LIMITATIONS
The performance hinges upon accurate inputs; hence regular recalibration aligning shifting dynamics proves essential.
Excessive reliance solely on this indicator might lead to missed opportunities especially during sideways/choppy phases necessitating additional filters.
Always consider combining outputs with fundamental analyses ensuring holistic perspectives while managing risks effectively.
NOTES
Educational Resources: Delve deeper into principles behind dynamic moving averages and their significance in technical analysis bolstering comprehension.
Risk Management: Maintain stringent risk management protocols integrating stop-loss/profit targets safeguarding capital preservation.
Continuous Learning: Stay updated exploring evolving financial landscapes incorporating new methodologies enhancing script utility and relevance.
THANKS
Thanks to all contributors who have played vital roles refining and optimizing this script. Your valuable feedback drives continual enhancements paving way towards superior trading experiences!
Happy charting, and here's wishing you successful ventures ahead! 🌐💰!