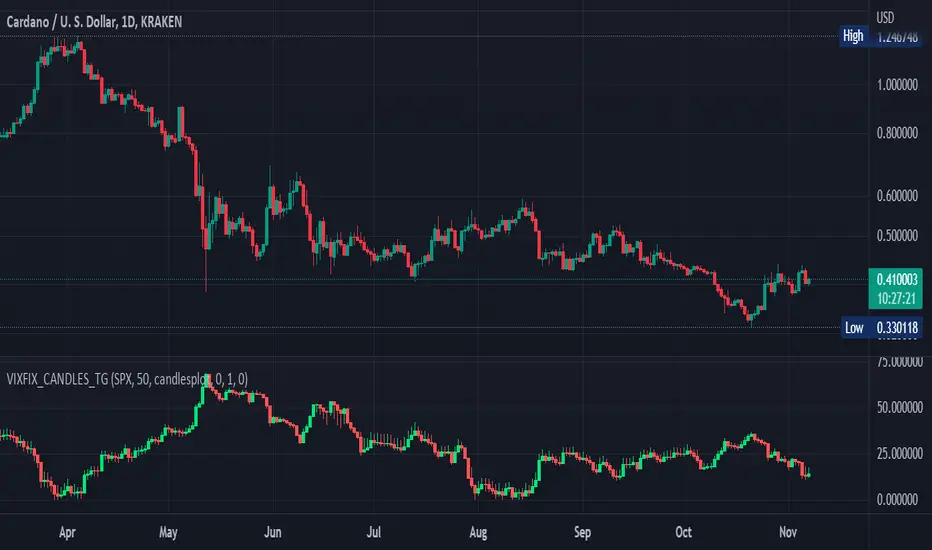
Williams Vix Fix OHLC candles plot indicator (Tartigradia)OHLC candles plot of the Williams VixFix indicator, which allows to draw trend lines.
Williams VixFix is a realized volatility indicator developed by Larry Williams, and can help in finding market bottoms.
Indeed, as Williams describe in his paper, markets tend to find the lowest prices during times of highest volatility, which usually accompany times of highest fear. The VixFix is calculated as how much the current low price statistically deviates from the maximum within a given look-back period.
The Williams VixFix indicator is usually presented as a curve or histogram. The novelty of this indicator is to present the data as a OHLC candles plot: whereas the original Williams VixFix calculation only involves the close value, we here use the open, high and low values as well. This led to some mathematical challenges because some of these calculations led to absurd values, so workarounds had to be found, but in the end I think the result was worth it, it reproduces the VIX chart quite well.
A great additional value of the OHLC chart is that it shows not just the close value, but all the values during the session: open, high and low in addition to close. This allows to draw trend lines and can provide additional information on momentum and sentiment. In addition, other indicators can be used on it, as if it was a price chart, such as RSI indicators (see RSI+ (alt) indicator for example).
For more information on the Vix Fix, which is a strategy published under public domain:
The VIX Fix, Larry Williams, Active Trader magazine, December 2007, web.archive.org
Fixing the VIX: An Indicator to Beat Fear, Amber Hestla-Barnhart, Journal of Technical Analysis, March 13, 2015, ssrn.com
Replicating the CBOE VIX using a synthetic volatility index trading algorithm, Dayne Cary and Gary van Vuuren, Cogent Economics & Finance, Volume 7, 2019, Issue 1, doi.org
This indicator includes only the Williams VixFix as an OHLC candles or bars plot, and price / vixfix candles plot, as well as the typical vixfix histogram. Indeed, it is much more practical for unbounded range indicators to be plotted in their own separate panel, hence why this indicator is released separately, so that it can work and be scaled adequately out of the box.
Note that the there are however no bottom buy signals. For a more complete indicator, which also includes the OHLC candles plots present here, but also bottom signals and Inverse VixFix (top signals), see:
Set Index symbol to SPX, and index_current = false, and timeframe Weekly, to reproduce the original VIX as close as possible by the VIXFIX (use the Add Symbol option, because you want to plot CBOE:VIX on the same timeframe as the current chart, which may include extended session / weekends). With the Weekly timeframe, off days / extended session days should not change much, but with lower timeframes this is important, because nights and weekends can change how the graph appears and seemingly make them different because of timing misalignment when in reality they are not when properly aligned.
Penunjuk Pine Script®