Daily Price LevelsTrack daily price action like a pro with instant visibility of key levels, percentages, and P&L values - all in one clean view."
Bullet points:
• Shows Daily Open, High, Low & Median levels
• Dynamic color-coding: green above open, red below
• Real-time price labels with:
Exact price levels
% distance between levels
Point values
Dollar values per contract
• Auto-repaints on timeframe changes
• 30min alerts for median crosses
Cari dalam skrip untuk "daily"

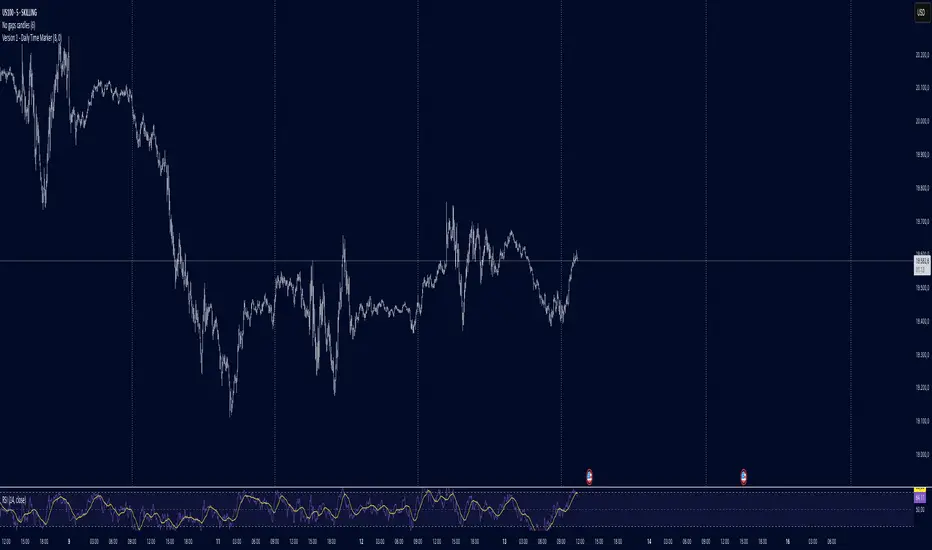
Daily Time MarkerThis TradingView indicator draws thin, white, dashed vertical lines on the chart at a user-defined time each day. The indicator takes into account Daylight Saving Time (DST) adjustments, ensuring the correct time is displayed throughout the year.
Key Features:
✅ Daily Vertical Markers:
Displays vertical dashed lines from Monday to Friday at the selected time.
The lines extend infinitely in both directions.
✅ Historical & Future Projection:
Shows lines 15 days into the past and 5 days into the future for better visualization of key time levels.
✅ DST Adjustment:
Automatically adjusts between summer and winter time , ensuring the correct hour is displayed.
This indicator is useful for traders who rely on specific time-based events, such as market opens or key trading sessions.
Daily Open @Alpha PipsOverview
The Daily Open @Alpha Pips indicator displays the daily opening price as a reference line on the chart. This level is widely used by traders to gauge market sentiment, potential support/resistance zones, and price reactions throughout the trading session.
How It Works
The line color is red with a 30% transparency level, ensuring visibility without overwhelming the chart.
The line width is set to 2 for clear visualization.
Use Cases
Identify potential intraday support/resistance at the daily open.
Observe price reactions around the daily open level to refine entries and exits.
Use in conjunction with price action, order flow, or smart money concepts for enhanced decision-making.
Additional Information
Works on any timeframe but is best suited for intraday trading strategies.
The script is fully transparent, ensuring traders can easily understand its function.
It does not repaint, providing reliable and stable levels throughout the session.

Daily Bias IndicatorBasic ICT Daily Bias Indicator
When yesterday's price breaks above and closes above the high of the day before yesterday, it indicates a bullish bias.
When yesterday's price tests the low of the day before yesterday but does not break below it, it indicates a bullish bias.
When yesterday's price breaks below and closes below the low of the day before yesterday, it indicates a bearish bias.
When yesterday's price tests the high of the day before yesterday but does not break above it, it indicates a bearish bias.

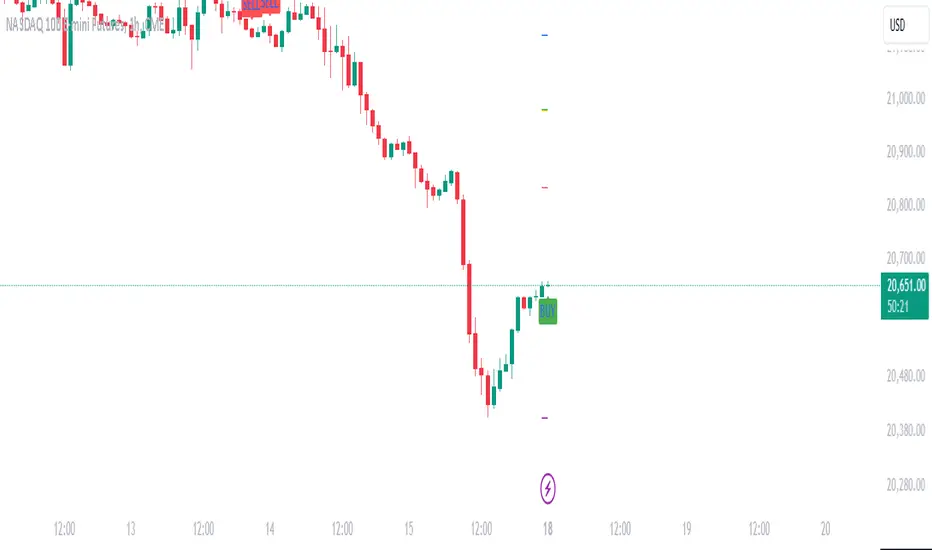
Daily COC Strategy with SHERLOCK WAVESThis indicator implements a unique trading strategy known as the "Daily COC (Candle Over Candle) Strategy" enhanced with "SHERLOCK WAVES" for pattern recognition. It's designed for traders looking to capitalize on specific candlestick formations with a negative risk-reward ratio, with the aim of achieving a high win rate (over 70%) through numerous trading opportunities, despite each trade having a higher risk relative to the reward.
Key Features:
Pattern Recognition: Identifies a setup based on three consecutive candles - a red candle followed by a shooting star, then an entry candle that does not break below the shooting star's low.
Negative Risk/Reward Trade Selection: Focuses on entries where the potential stop loss is greater than the take profit, banking on a high win rate to offset the individual trade's negative risk-reward ratio.
Visual Signals:
Green Label: Marks potential entry points at the high of the candle before the entry.
Green Dot: Indicates a winning trade closure.
Red Dot: Signals a losing trade closure.
Blue Circle: Warns when the current candle is within 2% of breaking above the previous candle's high, suggesting a potential setup is developing.
Green Circle: Plots the take profit level.
Red Circle: Plots the stop loss level.
Dynamic Statistics: A live updating label showing the number of trades, wins, losses, open trades, current account balance, and win percentage.
Customizable Parameters:
Risk % per Trade: Adjust the percentage of your account balance you're willing to risk on each trade.
Initial Account Balance: Set your starting balance for tracking performance.
Start Date for Strategy: Define when the strategy should start calculating from, allowing for backtesting.
Alerts:
An alert condition is set for when a potential trade setup is developing, helping traders prepare for entries.
Usage Tips:
This strategy is predicated on the idea that a high win rate can compensate for the negative risk-reward ratio of individual trades. It might not suit all market conditions or traders' risk profiles.
Use this strategy in conjunction with other analysis methods to validate trade setups.
Note: Always backtest thoroughly before applying to live markets. Consider this tool as part of a broader trading strategy, not a standalone solution. Monitor your win rate and adjust your risk management accordingly to ensure the strategy remains profitable over time.
This description now correctly explains the purpose behind the negative risk-reward ratio in the context of your trading strategy.

Daily Buy/Sell Volumeindicator that The Daily Buy/Sell Volume Indicator is a custom-built tool that helps traders track and visualize the buying and selling volumes throughout a trading day. This indicator separates the total volume into two categories:
1. Buy Volume: Calculated when the closing price is higher than the opening price for a given candle. This represents the volume of bullish (buy) activity for the day.
2. Sell Volume: Calculated when the closing price is lower than the opening price for a given candle. This represents the volume of bearish (sell) activity for the day.
Key Features:
• Buy/Sell Volume Calculation: The indicator tracks the buying and selling volumes based on the relationship between the open and close prices of each candle.
• Daily Reset: The indicator resets at the start of each trading day, providing fresh calculations for the daily buy and sell volumes.
• Visual Representation: The buy volume is shown with a green line, while the sell volume is displayed with a red line, making it easy to identify bullish and bearish activity over the course of the day.

Daily Session DividerThis script draws vertical lines showing the new daily sessions. These will only be displayed when it's on an intraday timeframe (lower than daily timeframe).
Settings:
Line Color: Choose the color you want and change the opacity
Line Width: If you want a thicc line. Defaults to 1 (recommended setting)
Line Style: Choose between solid (default), dashed, or dotted

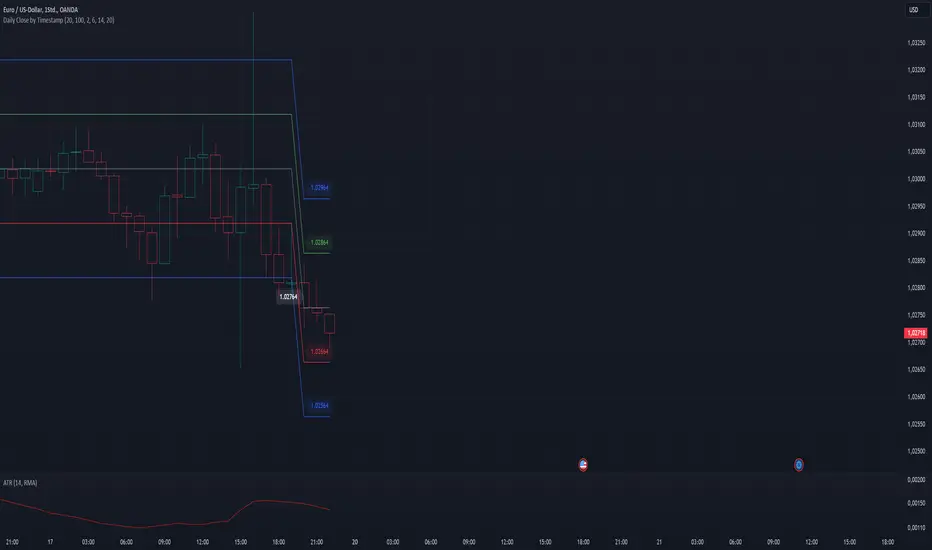
Daily Close Levels with ATR and Custom OffsetsDescription:
This Pine Script visualizes daily close levels, calculates key price zones based on custom offsets and ATR (Average True Range), and is an essential tool for traders analyzing support and resistance zones.
Features
Close Value Line: Displays the daily close value as a line on the chart.
ATR Values: Shows the ATR value in both price and tick format.
Custom Offsets:
Calculates positive and negative price levels based on a user-defined tick offset.
Supports multipliers for extended zones (e.g., 2x offset).
Labels:
Displays the close value and ATR on the chart.
Annotates calculated price levels directly on the corresponding lines.
Time Control: Calculates levels at a user-defined hour (e.g., 20:00).
Customizable Parameters:
Close Time (Hour): Choose the specific hour for analyzing the close price.
Custom Line Offset: Define the price offset in ticks.
ATR Length: Adjust the ATR calculation length.
Timezone Offset: Supports time adjustments for different time zones.
Enable/Disable Labels and Values: Toggle the display of labels and values on the chart.
Daily Single Trade [SMRT Algo]The Daily Single Trade Indicator by SMRT Algo is a powerful yet simple tool designed for traders who value precision, discipline, and a focus on high-quality trade setups. With a unique approach, this indicator identifies just one signal daily, making it ideal for traders who prefer a structured and stress-free trading routine.
Please note that this indicator only works for timeframes below 1H.
Key Features:
Market Open & Pre-Market Analysis: The indicator focuses on the market’s opening range and identifies breakout opportunities based on price action during these critical periods.
Customizable Risk-Reward Ratio: Plan your trades with precision by setting your desired RR, ensuring that your take-profit (TP) levels are multiples of your stop-loss (SL). Stop loss is not shown with this indicator.
Price Offset for SL: Add a customizable buffer to your SL and TP levels. This offset accounts for market volatility, reducing the chances of premature stop-outs while maintaining alignment with your trading plan.
Increasing this value will lead to a greater invisible stop loss, which will increase the TP size. The opposite is occurs when decreasing this value (less than 0). If you set it as 2.5 for example for TSLA: price is 340 and SL is 330 for example, SL becomes 327.5. This calculation will then be applied to calculate the TP.
In simple terms, if the offset is positive, SL becomes larger, TP becomes larger as well.
Exit Point Visibility: Display exit points on your chart to better visualize trade targets and stop levels.
Adjustable Market Open Time: Easily modify the market open hour and minute to suit your asset’s trading session. For example, U.S. stock traders can set the market open time to 9:30 AM EST (UTC-5).
By providing a single signal each day, the indicator minimizes overtrading and keeps your focus on the best opportunities.
With predefined SL, TP, and RR settings, the indicator fosters disciplined trading, reducing the influence of emotional decision-making. Whether you’re trading stocks, indices, or forex, the customizable market open time and RR ratio make this indicator versatile and adaptable.
The combination of precise SL and TP calculations with offset pip adjustments helps protect your trades from market noise while maintaining a favorable RR.
Perfect for those who can’t monitor markets all day, the single-signal approach allows you to execute a high-quality trade and move on with your day.
How to Use:
Set the Market Open Time: Adjust the open time to align with your asset’s session. For example, set 9:30 AM EST for U.S. stocks.
Define Your Risk-Reward Ratio: Choose an RR multiple (e.g., 1:2 or 1:3) that aligns with your risk tolerance and trading goals.
Apply Pip Offset: Add a buffer to your SL and TP to account for market volatility and reduce false stops.
The Daily Single Trade Indicator simplifies trading by focusing on one high-probability setup per day. It’s perfect for traders looking to maintain consistency, improve risk management, and reduce the stress of overanalyzing the markets.
How Alerts Work:
Individual Alerts: Set separate notifications for specific actions, such as breakout signals, take-profit levels, or stop-loss activations.
Master Alert: Manage all notifications with one streamlined setting, ensuring you never miss an opportunity while keeping your setup simple and efficient.
Take control of your trading with a strategy built for clarity, precision, and success!

Daily Moving Averages on Intraday ChartsThis moving average script displays the chosen 5 daily moving averages on intraday (minute) charts. It automatically adjusts the intervals to show the proper moving averages.
In a day there are 375 trading minutes from 9:15 AM to 3:30PM in Indian market. In 5 days there are 1875 minutes. For other markets adjust this data accordingly.
If 5DMA is chosen on a five minute chart the moving average will use 375 interval values (1875/5 = 375) of 5minute chart to calculate moving average. Same 5DMA on 25minute chart will use 75 interval values (1875/25 = 75).
On a 1minute chart the 5DMA plot will use 1875 interval values to arrive at the moving average.
Since tradingview only allows 5000 intervals to lookback, if a particular daily moving average on intraday chart needs more than 5000 candle data it won't be shown. E.g 200DMA on 5minute chart needs 15000 candles data to plot a correct 200DMA line. Anything less than that would give incorrect moving average and hence it won't be shown on the chart.
MA crossover for the first two MAs is provided. If you want to use that option, make sure you give the moving averages in the correct order.
You can enhance this script and use it in any way you please as long as you make it opensource on TradingView. Feedback and improvement suggestions are welcome.
Special thanks to @JohnMuchow for his moving averages script for all timeframes.

Daily Manipulation and Distribution Levels with Buy/Sell SignalsIndicator Summary:
This indicator is designed for intraday traders, highlighting key price levels and providing simple buy/sell signals based on price manipulation and distribution concepts.
Key Features:
Core Levels:
Manipulation Plus/Minus: Derived from the daily open and a portion of the daily range (e.g., 25%).
Distribution Levels: Daily high and low serve as ultimate targets or resistance/support levels.
Buy and Sell Signals:
Buy Signal: Triggered when the price crosses above the Manipulation Plus level. A green "BUY" label marks the entry.
Sell Signal: Triggered when the price crosses below the Manipulation Minus level. A red "SELL" label marks the entry.
Clean Chart Design:
Hides unnecessary clutter, showing only relevant key levels and labeled signals for clarity.
How to Use:
Entry Points:
Buy Entry: When a green "BUY" label appears after the price breaks above the Manipulation Plus level.
Sell Entry: When a red "SELL" label appears after the price breaks below the Manipulation Minus level.
Exit Strategy:
Take Profit: Use the Distribution Levels (daily high/low) as take-profit zones.
Stop Loss: Set just above/below the Manipulation Levels to manage risk effectively.
One to Two Trades per Session: Focus on high-probability moves to ensure clarity and reduce overtrading.
Who It’s For:
This indicator is ideal for traders seeking a structured and visual approach to intraday trading, with clear entry/exit criteria based on price manipulation and distribution theory. It simplifies decision-making and ensures clean chart setups without overwhelming visuals.
Daily BreadWhat it does:
This script uses specific multiple true ranges from a 30 EMA baseline to plot lines that represent 10% buying increments. Although the common period for ATR is 14, this script employs a period of 20 for smoothing that I have determined is more effective when used with a daily candle chart. It includes onscreen trend signals to identify an uptrend or downtrend when the 50 EMA crosses the 90 EMA and will also display a coloured directional signal at each candle beyond an EMA cross to identify the current trend.
The script plots a scale of percentage labels at the end of each line to identify the percent of an account intended to be in short or longer term trades.
How it does it:
The script uses a 30 EMA baseline and then multiplies ATR increments of +1, +2, +4 and -1 through -7. These ATR multiples and the EMA are plotted as 11 lines, 10 of which make up the range of 10% increments from 10% to 100% with the 11th line being the High Band representing the extreme high or expected sale of any holdings. The percentage label scale uses variable declarations to position and colour match a percentage label to each line.
Intended use:
It is intended to be used for short term trading or long term investing with a daily market index chart such as SPY and multiple exchange traded funds that track said market index. A different ETF is purchased when a daily SPY candle reaches a lower buy band using 10% of a total account value. The sale of any ETFs is at the discretion of the trader and dependent on investment strategy (short term trading or long term inventing) and the trend. When short term trading in a downtrend or when daily candles are below the 50 EMA, selling would be done every 2 to 3 bands above a buy to mitigate the risk of a significant portion of an account getting caught in a downtrend. In an uptrend the High Band would be used to sell any holdings.

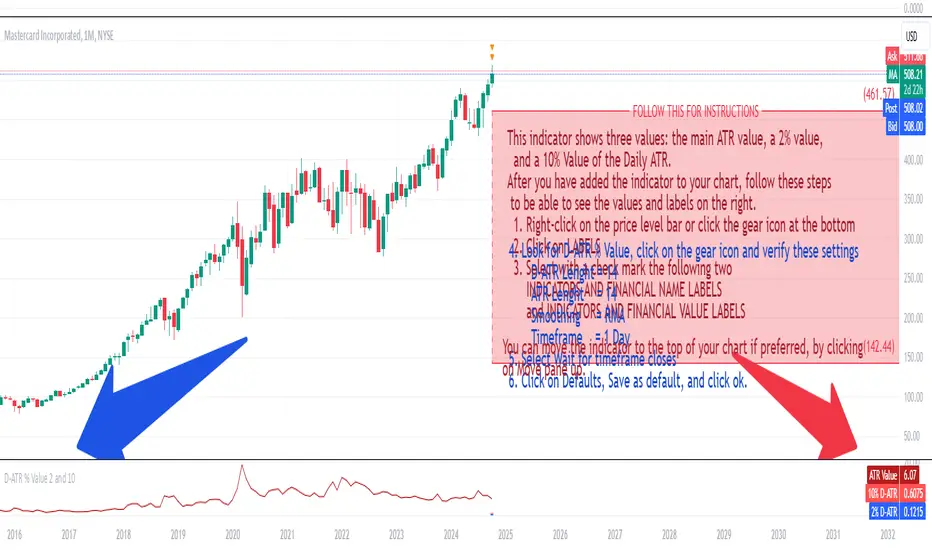
Daily ATR 2 and 10 Percent Value
This indicator shows three values: the main ATR value, a 2% value,
and a 10% Value of the Daily ATR.
After you have added the indicator to your chart, follow these steps
to be able to see the values and labels on the right.
1. Right-click on the price level bar or click the gear icon at the bottom
2. Click on LABELS
3. Select with a check mark the following two
INDICATORS AND FINANCIAL NAME LABELS
and INDICATORS AND FINANCIAL VALUE LABELS
4. Look for D-ATR % Value, click on the gear icon and verify these settings
- D-ATR Lenght = 14
- ATR Lenght = 14
- Smoothing = RMA
- Timeframe = 1 Day
5. Select Wait for timeframe closes
6. Click on Defaults, Save as default, and click ok.
You can move the indicator to the top of your chart if preferred, by clicking
on Move pane up.
Slightly modifications from other indicators.
Futures Daily Settlement PricesDaily settlement prices reflect the fair market value of the underlying commodity or financial instrument, as determined by buyers and sellers during the settlement period or “close”. The price quoted in the evening news for items like a bush of corn, a barrel of crude oil, or a 10-year U.S. Treasury note frequently use the settlement price for the corresponding futures product that day.
Settlement prices are used to mark traders’ positions to market daily, determining profits or losses. Daily settlement prices play a key role in facilitating price discovery, risk management, and market integrity.
This indicator plots up to 30 settlement prices as well as the date of settlement on your chart, on time frames under 1 hour.
Customizable line types, colors, and label colors.

Daily High and Low Levels IndicatorThis Pine Script indicator displays horizontal lines representing the high and low levels of the previous trading day, extending them to the right side of the chart for better visibility. It updates automatically at the start of each new trading day.
Features:
Daily High and Low Levels: Marks the high and low levels of the previous day with horizontal lines.
Customization:
Adjust the color, style, and thickness of the lines to fit your preferences.
High Level Line Color: Customize to your preferred color (default: gray).
Low Level Line Color: Customize to your preferred color (default: white).
Line Style Options: Choose between solid, dashed, or dotted lines.
Line Thickness: Adjust the width of the lines.
Extended Lines: Extend the lines to the right side of the chart for enhanced visibility.
Labeling: Shows clear labels "Previous High" and "Previous Low" next to the lines for easy reference.
Usage :
Add this indicator to your chart to visualize the previous day's high and low levels.
Customize the appearance of the lines and labels using the input options.
The indicator will automatically update these levels at the beginning of each trading day.
This indicator is designed to help traders quickly identify significant price levels from the previous day and make informed trading decisions.
License: This script is provided under the Attribution-NonCommercial-ShareAlike 4.0 International (CC BY-NC-SA 4.0) License. For more information, visit Creative Commons License.

Daily Ratio OCHL Averager by Munif ShaikhThe "Daily Ratio OCHL Averager" indicator, is designed for use in financial charts. It calculates an average value based on the daily open, close, high, and low prices, and visualizes this average on the chart.
Ratio Calculation:
The script calculates a ratio representing the normalized difference as a percentage. This ratio helps determine if the current price is above or below the calculated average.
Plotting the Average Line:
The average value (dDaily) is plotted on the chart with a dynamic color indicating whether the current price is above (green) or below (red) the average.
Traders can use this indicator to visually analyze how the current price compares to the daily average. The color-coded average line helps quickly identify bullish or bearish conditions. The ratio percentage provides an additional quantitative measure of this relationship.
This indicator can be particularly useful in identifying trends and potential reversal points by showing how prices behave relative to their daily average, aiding in making informed trading decisions.

Daily Chess Puzzles [LuxAlgo]Play Chess Puzzles right on your Chart!
Daily Chess Puzzles brings you a new 1-Move chess puzzle straight to your chart every day.
🔶 USAGE
Submit your answer to see if your solution is correct! For quick access to the settings, Double-Click on the Chess board to open the settings interface.
The current active color (Who's move it is) is represented by the color of the information bar, and the corner board squares.
This game uses long algebraic notation without pieces names for submitting moves.
This method for determining moves is perfect for simplicity and clarity, and is standard for the Universal Chess Interface (UCI).
🔹 How to Notate
Long algebraic notation (without pieces name) is simple to understand. This notation does not use capture symbols or check/checkmate symbols; it uses only the squares involved in the move and any promotion occurring.
{Starting Square}{Ending Square}{Promotion Piece(if needed)}
Locate the starting square and the ending square of the piece being moved, without mentioning the piece itself.
Identify the column letters (a-h) and row numbers (1-8) that align with your desired move.
If a pawn reaches the opposite end of the board the pawn gets promoted, add the letter representing the piece it is promoted to at the end of the move.
Put it all together and you've got your notation!
Piece Notations for Pawn Promotions:
'n' for Knight ('k' is reserved for the King in chess notation)
'b' for Bishop
'r' for Rook
'q' for Queen
Normal Move Example: Moving a piece from e2 to e4 is notated as "e2e4".
Pawn Promotion Example: Promoting a pawn to a queen is notated as "e7e8q".
🔶 DETAILS
Miss a day? Yesterday's puzzle can be re-played, check the box for 'View Yesterday's Puzzle' in the settings.
This indicator makes use of Tooltips! . Hover over a square to see that square's notation.
This script makes use of 5 libraries, each storing 2 years worth of daily chess puzzles amounting to 10 years of unique daily chess puzzles.
"timenow" is used to determine which day it is, so even on a closed ticker or weekend or holiday a new chess puzzle will be displayed.
Users have the option to choose from 5 different board themes.

Daily Spot BTC ETF flowsIndicator for use on the daily timeframe to show combined capital flows into 8 of the largest spot bitcoin ETFs to allow the user to track potential buy and selling pressure on spot BTC.
The included ETFs are:
GBTC
ARKB
FBTC
HODL
IBIT
EZBC
BTCO
BITB
Net daily volume is derived from lower timeframe data (5 minute chart by default) for each ETF and multiplied by the average price for the period (defined by the mean of the high, low + close values). This gives the net capital inflow or outflow for each ETF, every period. The individual daily values are added together to give a total capital flow per day and plotted as columns. The cumulative sum of all previous periods is also calculated each period/day and plotted as a line chart.
This is the only indicator currently collating this capital flow data together and presents it as an easy to understand chart to help the user gauge market conditions. By using low time frame bars to calculate the up and down volumes, accuracy is improved.

Daily TrendDescription:
The "Daily Trend" script is a powerful technical analysis tool designed for TradingView. This indicator helps traders identify key support and resistance levels based on daily price data. It offers a visual representation of these levels, along with other technical indicators like Exponential Moving Averages (EMA), Supertrend, and Parabolic SAR.
Features:
Past Candle Price Levels: This script calculates and displays past daily candle price levels, including R1, R2, R3, R4, S1, S2, S3, and S4. These levels are vital for identifying potential reversals and breakout points.
Exponential Moving Average (EMA): The script includes an EMA indicator with a customizable period to help traders spot the trend direction and potential crossovers.
Supertrend Indicator: The Supertrend indicator is used to identify trend changes. It plots the Supertrend line and highlights the trend direction with color-coded regions.
Parabolic SAR: The Parabolic SAR indicator is integrated into the script to assist traders in identifying potential entry and exit points in the market.
Customizable Alerts: Traders can customize the indicator by choosing which past candle price levels and other features to display on the chart.
How to Use:
Apply the "Daily Trend" script to your TradingView chart.
Customize the indicator by enabling or disabling specific features, such as past candle price levels and EMA.
Pay attention to the color-coded regions for Supertrend and Parabolic SAR to determine the current trend direction.
Look for potential reversal or bounce signals based on the indicator's signals and the price action.
Consider using this script in conjunction with your trading strategy for enhanced technical analysis.
Risk Warning: Trading involves significant risk, and past performance is not indicative of future results. Always practice proper risk management and consider the broader context of the market before making trading decisions.

Daily Network Value to Transactions Signal (NVTS)
Quote of GlassNode ...
The NVT Signal (NVTS) is a modified version of the original NVT Ratio.
It uses a 90 day moving average of the daily transaction volume in the denominator instead of the raw daily transaction volume.
This moving average improves the ratio to better function as a leading indicator.
The Network Value to Transactions (NVT) Ratio is calculated by dividing the market cap by the transferred on-chain volume measured in USD.
GlassNode says the NVT Ratio was created by Willy Woo.
I have peaked into Glassnode and took their idea.
I also added a few more Moving Averages to select from, and the length can also be changed.
This script does not depend on Glassnode alone, instead I pulls data of several services...
CoinMarketCap
CoinMetrics
GlassNode
IntoTheBlock
Therefor we have more Tokens to select from.
I have also blocked some faulty data of each service.
If you get a study error of any kind then there is no data available,
or you on a wrong timeframe.
Best to use this script in a daily chart.
And keep in mind it pulls data of yesterday.
Therefor the plot is offset by 1 to the left.
The script will check each service if the data for the chart is available.
Market Cap is taken in the following order ...
CainMarketCap
GlassNode
CoinMetrics
Transaction volume as USD is taken in the following order ...
IntoTheBlock
CoinMetrics
GlassNode
Happy Trading!

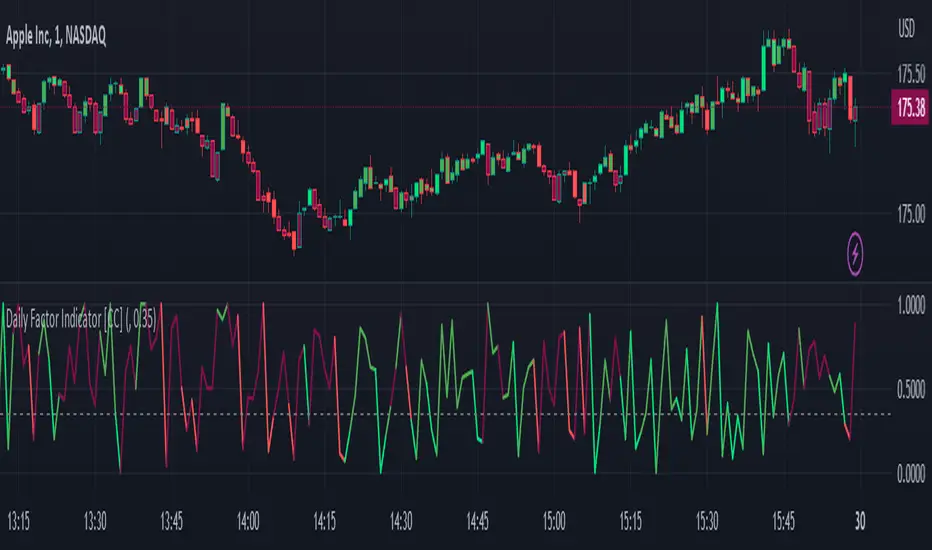
Daily Factor Indicator [CC]The Daily Factor Indicator was created by Andrea Unger (Stocks and Commodities Jun 2023 pgs 26-31), and this is a new volatility indicator that compares the body, which is the absolute difference between the previous open and previous close, and the range which is the difference between the previous high and previous low. The indicator is calculated by dividing the body and range to determine the volatility for the previous bar. This indicator will range between 0 and 1. Values closer to 1 mean very high volatility, and values closer to 0 mean very low volatility. I have introduced a simple moving average strategy to decide buy or sell signals and colors. Darker colors mean the indicator is above the threshold level, and lighter colors mean the indicator is below the threshold level. Colors are shades of green when the price is above the moving average and shades of red when the price is below the moving average. Feel free to try out your own threshold level and general buy and sell signals.
Let me know if there are any other indicators you would like me to publish!
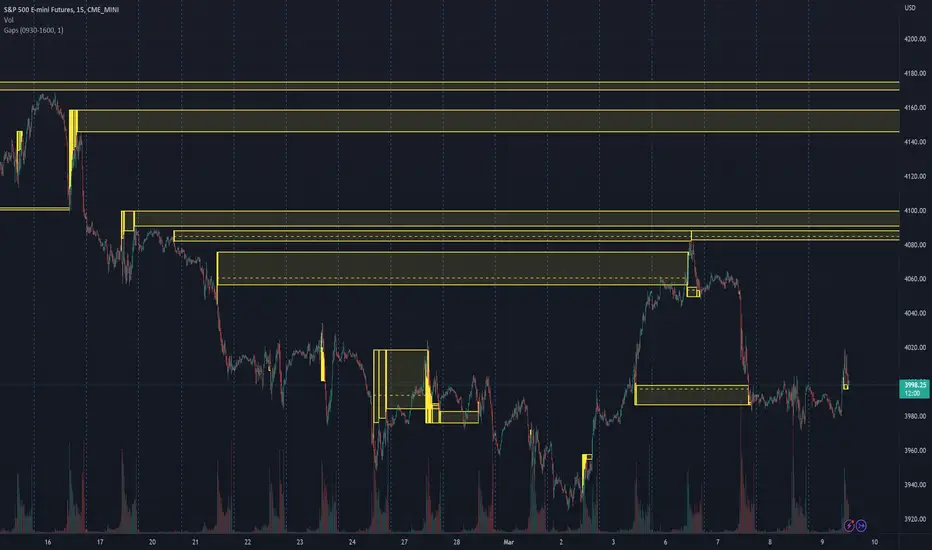
Daily Gaps & Trapped PositionsThis script builds substantially upon the default Gaps script provided by Tradingview. Functionality was added to allow users to decide what price from the previous session is used to determine a daily gap, added support for showing gaps across all timeframes up to the daily time frame, and also allow gaps to be shown even with ETH enabled on the chart. This script provides support across normal securities, futures, and also crypto.
Users can decide between the following selections to determine if a daily gap has formed:
- Previous Session Close
- Previous Session High/Low
- Last RTH Candle High/Low
The other larger piece that was added is something called trapped positions or what some folks familiar with Market Profile would call "single prints". They could also be considered FVGs but they are a specific subset of FVGs as these must from above or below the current session's high/low.
Single prints form above or below a current session's high/low and can be considered an area where price has moved too fast in that area and price will most likely return to these areas at a later point in time. In some teachings, these are also looked at as "trapped shorts" (lighter blue box color) or "trapped supply" (yellow orange box color) which creates an area where there will be potential support (trapped shorts) or resistance (trapped supply) when this area is revisited in the future. Adding these to your chart will simply provide additional areas of interest where you may see buying or selling.
Both gaps and trapped positions have the following options:
- Show only active gaps/trapped positions. Selecting this will only show areas where price has not completely traded through the box.
- Close gaps/trapped positions partially. If this is selected, it will reduce the box size as price is traded through the area. If it is not selected, the box will only disappear once price has traded through the entire box completely.
There are some additional settings that allow you to tailor how many boxes show up on the chart. These settings are as follows:
- Max number of boxes. This setting will only plot up to this number of gaps/trapped positions.
- Minimum Deviation. This will prevent gaps/trapped positions from showing if they are too small relative to average across that last 14 periods.
- Limit Max Box Trail Length (bars). If checkbox is selected, the box will stop being extended after X number of bars given in this input.

Daily Opening GAPPlots the daily opening gap as a box. As price moves into the box the size of the box is reduced until the gap is closed and the box no longer extends forward.
There are options to include middle lines for the center of the gap, as well as quartile lines.
While there are plenty of opening gap scripts out there none that I found tracked the closing of the gap over time.