Key Levels: Daily, Weekly, Monthly [BackQuant]Key Levels: Daily, Weekly, Monthly
Map the market’s “memory” in one glance—yesterday’s range, this week’s chosen day high/low, and D/W/M opens—then auto-clean levels once they break.
What it does
This tool plots three families of high-signal reference lines and keeps them tidy as price evolves:
Chosen Day High/Low (per week) — Pick a weekday (e.g., Monday). For each past week, the script records that day’s session high and low and projects them forward for a configurable number of bars. These act like “memory levels” that price often revisits.
Daily / Weekly / Monthly Opens — Plots the opening price of each new day, week, and month with separate styling. These opens frequently behave like magnets/flip lines intraday and anchors for regime on higher timeframes.
Auto-pruning — When price breaks a stored level, the script can automatically remove it to reduce clutter and refocus you on still-active lines. See: (broken levels removed).
Why these levels matter
Liquidity pockets — Prior day’s high/low and the daily open concentrate stops and pending orders. Mapping them quickly reveals likely sweep or fade zones. Example: previous day highs + daily open highlighting liquidity:
Context & regime — Monthly opens frame macro bias; trading above a rising cluster of monthly opens vs. below gives a clean top-down read. Example: monthly-only “macro outlook” view:
Cleaner charts — Auto-remove broken lines so you focus on what still matters right now.
What it plots (at a glance)
Past Chosen Day High/Low for up to N prior weeks (your choice), extended right.
Current Daily Open , Weekly Open , and Monthly Open , each with its own color, label, and forward extension.
Optional short labels (e.g., “Mon High”) or full labels (with week/month info).
How breaks are detected & cleaned
You control both the evidence and the timing of a “break”:
Break uses — Choose Close (more conservative) or Wick (more sensitive).
Inclusive? — If enabled, equality counts (≥ high or ≤ low). If disabled, you need a strict cross.
Allow intraday breaks? — If on, a level can break during the tracked day; if off, the script only counts breaks after the session completes.
Remove Broken Levels — When a break is confirmed, the line/label is deleted automatically. (See the demo: )
Quick start
Pick a Day of Week to Track (e.g., Monday).
Set how many weeks back to show (e.g., 8–10).
Choose how far to extend each family (bars to the right for chosen-day H/L and D/W/M opens).
Decide if a break uses Close or Wick , and whether equality counts.
Toggle Remove Broken Levels to keep the chart clean automatically.
Tips by use-case
Intraday bias — Watch the Daily Open as a magnet/flip. If price gaps above and holds, pullbacks to the daily open often decide direction. Pair with last day’s high/low for sweep→reversal or true breakout cues. See:
Weekly structure — Track the week’s chosen day (e.g., Monday) high/low across prior weeks. If price stalls near a cluster of old “Monday Highs,” look for sweep/reject patterns or continuation on reclaim.
Macro regime — Hide daily/weekly lines and keep only Monthly Opens to read bigger cycles at a glance (BTC/crypto especially). Example:
Customization
Use wicks or bodies for highs/lows (wicks capture extremes; bodies are stricter).
Line style & thickness — solid/dashed/dotted, width 1–5, plus global transparency.
Labels — Abbreviated (“Mon High”, “D Open”) or full (month/week/day info).
Color scheme — Separate colors for highs, lows, and each of D/W/M opens.
Capacity controls — Set how many daily/weekly/monthly opens and how many weeks of chosen-day H/L to keep visible.
What’s under the hood
On your selected weekday, the script records that session’s true high and true low (using wicks or body-based extremes—your choice), then projects a horizontal line forward for the next bars.
At each new day/week/month , it records the opening price and projects that line forward as well.
Each bar, the script checks your “break” rules; once broken, lines/labels are removed if auto-cleaning is on.
Everything updates in real time; past levels don’t repaint after the session finishes.
Recommended presets
Day trading — Weeks back: 6–10; extend D/W opens: 50–100 bars; Break uses: Close ; Inclusive: off; Auto-remove: on.
Swing — Fewer daily opens, more weekly opens (2–6), and 8–12 weeks of chosen-day H/L.
Macro — Show only Monthly Opens (1–6 months), dashed style, thicker lines for clarity.
Reading the examples
Broken lines disappear — decluttering in action:
Macro outlook — monthly opens as cycle rails:
Liquidity map — previous day highs + daily open:
Final note
These are not “signals”—they’re reference points that many participants watch. By standardising how you draw them and automatically clearing the ones that no longer matter, you turn a noisy chart into a focused map: where liquidity likely sits, where price memory lives, and which lines are still in play.
Cari dalam skrip untuk "daily"

Spiderlines BTCUSD - daily/weekly📘 Documentation – Daily and Weekly Spider Lines for Bitcoin
🔹 Purpose of the Script
This script draws dynamic “Spider Lines” in the Bitcoin chart.
The lines connect certain historical candles with a reference candle and extend to the right.
These act as guideline levels that can serve as potential support or resistance zones.
🔹 How It Works
The script operates in two modes, depending on the active chart timeframe:
Weekly Mode (timeframe.isweekly)
The reference date is July 1, 2019.
The number of weeks since that date is calculated.
This defines the connection candle (connection_candle).
Several predefined offsets (e.g., +32, +34, +36 …) are added to the reference to determine starting candles.
Lines are drawn from these candles toward the connection candle.
→ Line color: green
Daily Mode (timeframe.isdaily)
Same reference date: July 1, 2019.
The number of days since that date is calculated.
Again, a connection candle is set.
A different set of offsets (e.g., +224, +238, +252 …) defines the starting candles.
Lines are drawn accordingly.
→ Line color: red
🔹 Line Logic
Each line connects:
Start → bar_index at high
End → bar_index at close
Lines are extended indefinitely to the right (extend.right).
Appearance: dashed style, width 2.
🔹 Error Handling
If a calculated candle index does not exist in the chart history (e.g., chart data does not go back far enough),
a label is plotted in the chart showing the message:
"Daily idx out of range: 252"
This way, missing lines can be diagnosed easily.
🔹 Color Convention
Weekly Spider Lines → Green
Daily Spider Lines → Red
🔹 Use Cases
Visualization of historical cyclic line patterns.
Helps in technical chart analysis: spotting potential reaction zones in price movement.
Designed mainly for long-term traders and analysts observing Bitcoin in Daily or Weekly timeframes.
🔹 Limitations
Works only on Daily and Weekly charts.
Requires chart data going back to July 1, 2019.
Based purely on fixed offsets → not a classical indicator like Moving Averages or RSI.

Emre AOI Zonen Daily & Weekly (mit Alerts, max 60 Pips)This TradingView indicator automatically highlights Areas of Interest (AOI) for Forex or other markets on Daily and Weekly timeframes. It identifies zones based on the high and low of the previous period, but only includes zones with a width of 60 pips or less.
Features:
Daily AOI Zones in blue, Weekly AOI Zones in yellow with 20% opacity, so candlesticks remain visible.
Persistent zones: AOI boxes stay on the chart until the price breaks the zone.
Multiple zones: Supports storing multiple Daily and Weekly AOIs simultaneously.
Break Alerts: Sends alerts whenever a Daily or Weekly AOI is broken, helping traders spot key levels in real-time.
Fully automated: No manual drawing needed; zones are updated and extended automatically.
Use Case:
Ideal for traders using a top-down approach, combining Weekly trend analysis with Daily entry signals. Helps identify support/resistance, supply/demand zones, and critical price levels efficiently.

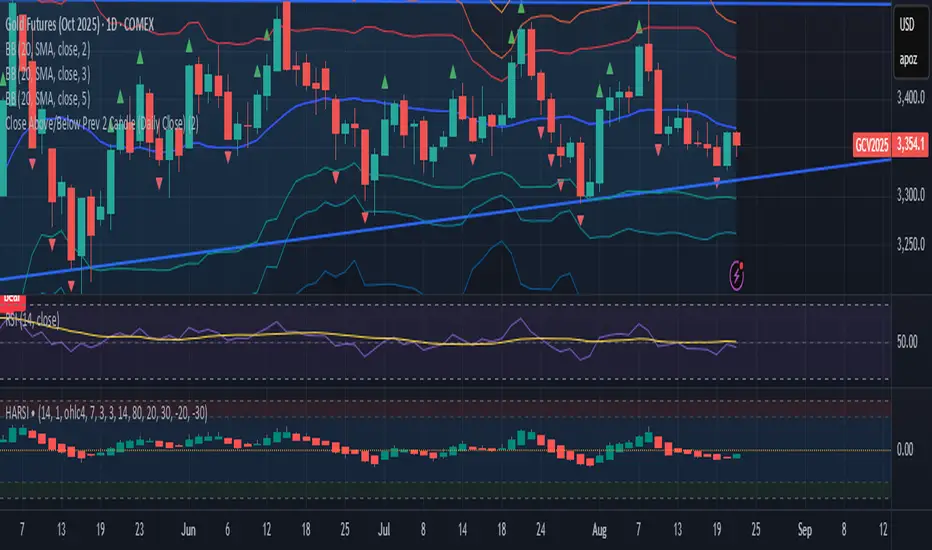
Close Above/Below Prev 2 Candle (Daily Close)This strategy identifies potential trend continuation or breakout signals by analyzing the daily candle closes relative to the previous two daily candles. It generates clear alerts and trade signals only after the daily candle has fully closed, reducing false intraday triggers.
How it works:
Long Entry (Bullish Signal): Triggered when the daily candle closes above the highs of the previous two daily candles.
Short Entry (Bearish Signal): Triggered when the daily candle closes below the lows of the previous two daily candles.
Visual Indicators: Green triangles indicate bullish signals, red triangles indicate bearish signals.
Strategy Features:
Optional long and short entries with configurable risk/reward ratio.
Automatic stop-loss and take-profit calculation based on candle structure.
Works on intraday charts using daily candle analysis.
Alerts:
Alerts trigger only after the daily candle closes above/below the previous two daily candles.
Helps traders receive precise notifications for potential breakout trades.
Benefits:
Reduces noise by using daily candle closes.
Easy to integrate with other swing or trend strategies.
Provides clear visual and alert signals for both bullish and bearish setups.
Moving Average Exponential (Daily Frozen EMA)This script plots an Exponential Moving Average (EMA) based on the daily timeframe, but with a unique twist:
✅ The EMA value is frozen for the entire current daily session, only updating when a new daily candle begins.
🔍 How it works:
The EMA is calculated using the 1-day timeframe, regardless of the chart's current timeframe.
This EMA value remains fixed throughout the day — it doesn't fluctuate intrabar.
It updates only once the daily candle has closed, providing a stable and reliable reference point during the trading day.
The default is the 5 day EMA but can be changed to any EMA timeframe you desire such as 9, 21, 50, 100. 200, etc.
✨ Additional Features:
✅ Optional smoothing with various moving average types (SMA, EMA, WMA, SMMA, VWMA).
✅ Optional Bollinger Bands on top of the smoothed EMA.
✅ Adjustable settings for EMA length, smoothing type, Bollinger Band deviation, and display options.
🛠️ Use Cases:
Ideal for traders who want a non-reactive EMA during intraday trading.
Helps reduce signal noise by anchoring EMA to higher timeframe structure.
Useful for strategy development where EMA should represent confirmed daily bias only.
Hope this helps, happy trading!

Average Daily Range in TicksPurpose: The ADR Ticks Indicator calculates and displays the average daily price range of a financial instrument, expressed in ticks, over a user-specified number of days. It provides traders with a measure of average daily volatility, which can be used for position sizing, setting stop-loss/take-profit levels, or assessing market activity.
Calculation: Computes the average daily range by taking the difference between the daily high and low prices, averaging this range over a customizable number of days, and converting the result into ticks (using the instrument's minimum tick size).
Customization: Includes a user input to adjust the number of days for the average calculation and a toggle to show/hide the ADR Ticks value in the table.
Risk Management: Helps traders estimate typical daily price movement to set appropriate stop-loss or take-profit levels.
Market Analysis: Offers insight into average daily volatility, useful for day traders or swing traders assessing whether a market is trending or ranging.
Technical Notes:
The indicator uses barstate.islast to update the table only on the last bar, reducing computational load and preventing overlap.
The script handles different chart timeframes by pulling daily data via request.security, making it robust across various instruments and timeframes.

1H & 2H Candle Panel + Daily Grid v1.2Indicator: "1H & 2H Candle Panel + Daily Grid v1.2"
This powerful indicator combines two key features into one tool:
Daily Grid anchored to the previous day’s close
Multi-Timeframe Candle Panel for comprehensive market analysis
1. Daily Grid Logic
Input:
Grid Distance (Points): Adjustable spacing between grid lines (default: 5.0 pts).
How It Works:
Detects the start of a new trading day using ta.change(time("D")).
Fetches the prior day’s close via request.security().
Draws the following elements at each new session:
Thick Red Line: Previous day’s closing price (key reference level).
8-Point Grid:
4 blue lines above the close (+1x to +4x the grid distance).
4 gold lines below the close (-1x to -4x the grid distance).
Info Label: Displays the exact prior close value.
Automatically clears and redraws all elements daily to avoid clutter.
2. Multi-Timeframe Candle Panel
Timeframes Analyzed:
Current chart TF, 30M, 1H, 2H, 3H, 4H, 6H, 12H, and Daily (1D).
Data Displayed per TF:
Open, Close, High, Low
Price Difference (Close − Open)
Candle Type (Bullish/Bearish)
Time remaining until candle close (hh:mm:ss format)
Visual Output:
A right-aligned table with conditional coloring:
Bullish candles: Green background
Bearish candles: Red background
Current timeframe highlighted in purple.
Optimized Updates:
Uses request.security() for efficient cross-TF data fetching.
Tracks candle closing times via TradingView’s native time_close.
Updates only on the last bar or in real-time (barstate.islast/isrealtime).
3. Confluence Signals
Full Confluence:
Triggers when all timeframes align:
Buy Signal: All candles bullish → Green arrow + alert.
Sell Signal: All candles bearish → Red arrow + alert.
1H Special Confluence:
Activates 30 minutes after the 1H candle opens.
Requires alignment between 1H, 4H, and 6H candles.
Marks entries with price-level arrows (no alerts).
4. Technical Optimizations
Performance:
Dynamically manages graphic objects (no redundant redrawing).
Uses arrays to track grid lines efficiently.
Precision:
Leverages TradingView’s time_close for accurate countdowns.
Formats prices with format.mintick for asset-specific precision.
How to Use
Adjust Grid Distance based on asset volatility.
Monitor the panel for multi-TF trend strength.
Use the daily grid as support/resistance reference.
Confluence signals highlight high-probability setups.
Pro Tip: Combine with volume analysis or RSI for confirmation!

Last Week's APM & Daily % Move(Corrected)Last Week's Average Price Movement + Daily Percentage Move (based on NY time)
This indicator accurately displays last week's Average Pip Movement (APM) consistently across all timeframes and tracks the true daily percentage move relative to that APM in a clear table in the top-right corner.
Key Features:
-Consistent Last Week's APM: Calculates the average pip movement from Monday to Friday of the previous trading week (based on daily wick-to-wick ranges, divided by 5). This APM value is now stable and the same across all chart timeframes.
-Accurate Live Daily % Move: Tracks the maximum percentage the price has moved (either up or down) since the 5 PM New York time daily open, compared to last week's APM. The percentage holds the maximum value reached during the day and resets at the next 5 PM NY open.
-NY Time Alignment: All time-based calculations are aligned with the New York time zone
Pip Adjustment: Automatically adjusts for JPY pairs.
⚠️ Important: For the intended display and relevance of the daily percentage move, this indicator is best used on timeframes 4-hour and under. On Daily and Weekly timeframes, the APM display will show a message indicating this.
We hope this indicator enhances your trading analysis.

Enhanced Daily Sentiment & Auction Area Trading StrategyDetermine Daily Sentiment (Anchor Chart - Daily TF):
Analyze Yesterday's Daily Candle: Look at the previous day's daily candlestick (high, low, open, close). This is the "most important information."
Establish Bias: If yesterday's candle was bullish (closed higher), the bias for today is generally long (approx. 80% of the time). If bearish, the bias is short.
Moving Average Context: Note if the daily price is above or below its short-term moving average (e.g., 21 or 50 MA). This should align with the candle's bias (e.g., bullish daily candle above its MA).
Pre-Market & Opening Analysis (Information Gathering):
Check for Gaps: Observe if the market is gapping up or down in the pre-market session relative to yesterday's close. This provides an early clue to current sentiment.
Consider Overall Sentiment: Briefly factor in relevant news or overarching market sentiment (e.g., data releases, overall market feeling from yields, gold etc.). Trading Window: Focus primarily on trading within the first hour of the U.S. market open, as this is when volatility is typically highest, which the strategy relies on.
Setup 5-Minute Chart for Execution (Trading TF - 5-min):
Apply Moving Average: Use the same short-term moving average (e.g., 21 or 50 MA) as on the daily chart.
Seek Alignment (Crucial): The 5-minute chart's trend and price action relative to its MA must align with the daily chart's bias and MA relationship.
If Daily bias is LONG (price above daily MA), the 5-minute chart should also show price establishing itself above its 5-min MA, ideally with a similar "45-degree angle" uptrend.
If Daily bias is SHORT (price below daily MA), the 5-minute chart should also show price establishing itself below its 5-min MA, with a similar downtrend. If there's no clear alignment between the daily and 5-minute chart structure/MA, do not trade.
Identify the "Auction Area" (Value/Congestion) on the 5-Minute Chart:
This is a recent area of congestion, a small support/resistance flip, or where price has paused, consolidated, and is retesting, often near the 5-minute MA.
Uptrend (Long Bias): Look for a pullback (a small "V" shape dip) towards the 5-minute MA or a recent small resistance-turned-support area. This is the "auction retest" before a potential breakout higher.
Downtrend (Short Bias): Look for a pullback rally (an inverted "V" shape) towards the 5-minute MA or a recent small support-turned-resistance area.

10 Monday's 1H Avg Range + 30-Day Daily RangeWhat This Script Does
This indicator is designed for traders who want to monitor volatility and range behavior at the start of the trading week . It focuses specifically on the first four 15-minute candles of each Monday and tracks their combined high-low range over time.
How It Works
Monday 1H Range Detection:
Each week, it automatically detects and highlights the first 4 candles of Monday on a 15-minute chart (1 hour total). It calculates the range between the highest high and lowest low of these candles.
10-Week Average of Monday 1H Ranges:
It stores and averages the last 10 such ranges, displaying this average in a table for weekly comparison.
30-Day Daily Range Average:
Separately, it calculates the average daily range (high – low) of the last 30 daily candles. This value helps put the Monday 1H range into broader context and can guide Stop Loss or TP planning.
Dynamic Labeling & Visual Highlights:
The script visually highlights the first 4 candles of Monday and places a label showing the pip range once the 4 candles have completed. It also updates a small table with the two averages described above.
How to Use It
Use it on the 15-minute timeframe to activate the Monday 1H logic.
Compare the current week’s Monday range to the 10-week average to see if volatility is increasing or decreasing.
Use the 30-day daily range to determine if the Monday opening movement is unusually large or small.
Consider adjusting trade entries, stops, or targets if the Monday range is disproportionately large compared to recent historical behavior.
What Makes It Original?
This is not a typical volatility indicator like ATR or standard deviation. Instead, it’s a purpose-built tool combining:
Time-specific behavior (first hour of the week),
Historical contextualization (10-week average tracking),
A dual-timeframe analysis (15-min + daily),
A user-friendly table and visual interface.
This script helps intraday or swing traders spot abnormal volatility early in the week and adjust their strategies accordingly—especially in fast-moving Forex or Index markets.

BTC Daily DCA CalculatorThe BTC Daily DCA Calculator is an indicator that calculates how much Bitcoin (BTC) you would own today by investing a fixed dollar amount daily (Dollar-Cost Averaging) over a user-defined period. Simply input your start date, end date, and daily investment amount, and the indicator will display a table on the last candle showing your total BTC, total invested, portfolio value, and unrealized yield (in USD and percentage).
Features
Customizable Inputs: Set the start date, end date, and daily dollar amount to simulate your DCA strategy.
Results Table: Displays on the last candle (top-right of the chart) with:
Total BTC: The accumulated Bitcoin from daily purchases.
Total Invested ($): The total dollars invested.
Portfolio Value ($): The current value of your BTC holdings.
Unrealized Yield ($): Your profit/loss in USD.
Unrealized Yield (%): Your profit/loss as a percentage.
Visual Markers: Green triangles below the chart mark each daily investment.
Overlay on Chart: The table and markers appear directly on the BTCUSD price chart for easy reference.
Daily Timeframe: Designed for Daily (1D) charts to ensure accurate calculations.
How to Use
Add the Indicator: Apply the indicator to a BTCUSD chart (e.g., Coinbase:BTCUSD, Binance:BTCUSDT).
Set Daily Timeframe: Ensure your chart is on the Daily (1D) timeframe, or the script will display an error.
Configure Inputs: Open the indicator’s Settings > Inputs tab and set:
Start Date: When to begin the DCA strategy (e.g., 2024-01-01).
End Date: When to end the strategy (e.g., 2025-04-27 or earlier).
Daily Investment ($): The fixed dollar amount to invest daily (e.g., $100).
View Results: Scroll to the last candle in your date range to see the results table in the top-right corner of the chart. Green triangles below the bars indicate investment days.
Settings
Start Date: Choose the start date for your DCA strategy (default: 2024-01-01).
End Date: Choose the end date (default: 2025-04-27). Must be after the start date and within available chart data.
Daily Investment ($): Set the daily investment amount (default: $100). Minimum is $0.01.
Notes
Timeframe: The indicator requires a Daily (1D) chart. Other timeframes will trigger an error.
Data: Ensure your BTCUSD chart has historical data for the selected date range. Use reliable pairs like Coinbase:BTCUSD or Binance:BTCUSDT.
Limitations: Does not account for trading fees or slippage. Future dates (beyond the current date) will not display results.
Performance: Works best with historical data. Free TradingView accounts may have limited historical data; consider premium for longer ranges.

Key Levels (4H and Daily)Key Levels (4H and Daily)
This indicator highlights important key price levels derived from the 4-hour (4H) and daily (D) timeframes, providing traders with critical support and resistance areas. The levels are calculated using the highest highs and lowest lows over a customizable lookback period, offering a dynamic view of significant price points that could influence market movement.
Key Features:
Key Levels for 4H and Daily Timeframes:
The indicator calculates and displays the highest high and lowest low over a user-defined period for both the 4-hour and daily timeframes. This helps traders identify key support and resistance levels that could dictate the market's behavior.
Customizable Lookback Period:
Traders can adjust the lookback period (in days) for both the 4-hour and daily timeframes to reflect different market conditions. This flexibility ensures the levels are tailored to your preferred trading style and market conditions.
Horizontal Lines:
The indicator plots horizontal lines at the high and low levels for both timeframes. These levels serve as dynamic support and resistance areas and help traders monitor price action near these critical points.
Real-Time Updates:
The lines adjust automatically with each new bar, providing up-to-date key levels based on the most recent price action and trading session.
Alert Conditions:
Alerts are built-in to notify traders when the price breaks above or below these key levels. Traders can set up notifications to stay informed when significant market moves occur.
How to Use:
Support and Resistance: Use the levels as potential support and resistance areas where price could reverse. Price often reacts at these levels, providing potential trading opportunities.
Breakouts: Pay attention to breakouts above the high or below the low of these levels. A break above the 4H or daily high could indicate bullish momentum, while a break below could signal bearish trends.
Trend Confirmation: Combine these levels with other technical analysis tools to confirm the overall market trend and enhance your trading strategy.
Perfect for:
Day Traders: Use the 4-hour levels for intraday trading setups, such as potential reversals or breakouts.
Swing Traders: The daily levels provide longer-term insights, helping to identify key zones where price might pause, reverse, or break out.
Market Context: Ideal for those who want to contextualize their trades within broader timeframes, helping to understand the market’s structure at multiple time scales.
This description conveys the utility and functionality of the indicator, focusing on how it helps traders identify and monitor key levels that influence market action.
Custom Daily % Levels Table📘 Indicator Description
"Custom Daily % Levels – table" is a dynamic and customizable tool designed to help traders visualize daily percentage-based price ranges and key metrics in a compact, table-style format.
🧩 Key Features:
📐 Custom Percent Levels: Automatically calculates upper and lower price levels based on a user-defined base percentage and number of levels, relative to the previous daily close.
🟢🔴 Color Gradient Highlighting: Positive levels are shown with a green gradient, negative levels with red, and the level labels with a neutral tone for easy reference.
📊 Live Asset Info: Displays the current symbol, percentage change from the previous daily close, and 14-period RSI, all color-coded for quick interpretation.
⚙️ Header Control: Toggle the visibility of the main info headers and level headers independently.
📌 Position Customization: Choose where the table appears on your chart (top/bottom, left/right, center).
📈 Clean Layout: Makes it easy to visually track price movement relative to daily expected ranges.
This indicator is especially useful for intraday traders, scalpers, or anyone needing a clear visual of short-term price expansion and contraction based on predefined volatility zones.

Average Daily Range ProjectionsCreates a trailing high and low projection based on the Average Daily Range.
Track the Session High and Low to determine the Daily Range.
Average the Daily Range by a fixed Period to create an Average Daily Range .
Track the Prior Daily Range .
Track the Current Daily Range .
Track the % of Range completion relative to the CDR & ADR(P).
From the Session Low, project an Average Daily Range High by adding the ADR.
From the Session High, project an Average Daily Range Low by subtracting the ADR.
When %R reaches 100% or greater, the ADR HI & LO will lock, showing the range break out or break down. As the Session High and Low create the Daily Range, observe the reaction of price as it reaches the limit of the expected daily range.
On strongly trending days, CDR is likely greater than PDR and ADR(P). Price can break away.
On ranging days, %R may fail to reach 100% and CDR may be lesser than PDR and ADR(P). Price can bounce around within the bounds of ADR HI & LO.

Drawdown from 22-Day High (Daily Anchored)This Pine Script indicator, titled "Drawdown from 22-Day High (Daily Anchored)," is designed to plot various drawdown levels from the highest high over the past 22 days. This helps traders visualize the performance and potential risk of the security in terms of its recent high points.
Key Features:
Daily High Data:
Fetches daily high prices using the request.security function with a daily timeframe.
Highest High Calculation:
Calculates the highest high over the last 22 days using daily data. This represents the highest price the security has reached in this period.
Drawdown Levels:
Computes various drawdown levels from the highest high:
2% Drawdown
5% Drawdown
10% Drawdown
15% Drawdown
25% Drawdown
45% Drawdown
50% Drawdown
Dynamic Line Coloring:
The color of the 2% drawdown line changes dynamically based on the current closing price:
Green (#02ff0b) if the close is above the 2% drawdown level.
Red (#ff0000) if the close is below the 2% drawdown level.
Plotting Drawdown Levels:
Plots each drawdown level on the chart with specific colors and line widths for easy visual distinction:
2% Drawdown: Green or Red, depending on the closing price.
5% Drawdown: Orange.
10% Drawdown: Blue.
15% Drawdown: Maroon.
25% Drawdown: Purple.
45% Drawdown: Yellow.
50% Drawdown: Black.
Labels for Drawdown Levels:
Adds labels at the end of each drawdown line to indicate the percentage drawdown:
Labels display "2% WVF," "5% WVF," "10% WVF," "15% WVF," "25% WVF," "45% WVF," and "50% WVF" respectively.
The labels are positioned dynamically at the latest bar index to ensure they are always visible.
Explanation of Williams VIX Fix (WVF)
The Williams VIX Fix (WVF) is a volatility indicator designed to replicate the behavior of the VIX (Volatility Index) using price data instead of options prices. It helps traders identify market bottoms and volatility spikes.
Key Aspects of WVF:
Calculation:
The WVF measures the highest high over a specified period (typically 22 days) and compares it to the current closing price.
It is calculated as:
WVF
=
highest high over period
−
current close
highest high over period
×
100
This formula provides a percentage measure of how far the price has fallen from its recent high.
Interpretation:
High WVF Values: Indicate increased volatility and potential market bottoms, suggesting oversold conditions.
Low WVF Values: Suggest lower volatility and potentially overbought conditions.
Usage:
WVF can be used in conjunction with other indicators (e.g., moving averages, RSI) to confirm signals.
It is particularly useful for identifying periods of significant price declines and potential reversals.
In the script, the WVF concept is incorporated into the drawdown levels, providing a visual representation of how far the price has fallen from its 22-day high.
Example Use Cases:
Risk Management: Quickly identify significant drawdown levels to assess the risk of current positions.
Volatility Monitoring: Use the WVF-based drawdown levels to gauge market volatility.
Support Levels: Utilize drawdown levels as potential support levels where price might find buying interest.
This script offers traders and analysts an efficient way to visualize and track important drawdown levels from recent highs, helping in better risk management and decision-making. The dynamic color and label features enhance the readability and usability of the indicator.

Dynamic Customizable 50% Line & Daily High/Low + True Day OpenA Unique Indicator for Precise Market-Level Analysis
This indicator is a fully integrated solution that automates complex market-level calculations and visualizations, offering traders a tool that goes beyond the functionality of existing open-source alternatives. By seamlessly combining several trading concepts into a single script, it delivers efficiency, accuracy, and customization that cater to both novice and professional traders.
Key Features: A Breakdown of What Makes It Unique
1. Adaptive Daily Highs and Lows
Automatically detects and plots daily high and low levels based on the selected time frame, dynamically updating in real time.
Features session-based adjustments, allowing traders to focus on levels that matter for specific trading sessions (e.g., London, New York).
Fully customizable styling, visibility, and alerts tailored to each trader’s preferences.
How It Works:
The indicator calculates daily high and low levels directly from price data, integrating session-specific time offsets to account for global trading hours. These levels provide traders with clear visual markers for key liquidity zones.
2. Automated ICT 50% Range Line
A pioneering implementation of ICT’s mid-range concept, this feature dynamically calculates and displays the midpoint of the daily range.
Offers traders a visual guide to identify premium and discount zones, aiding in determining market bias and potential trade setups.
How It Works:
The script calculates the range between the day’s high and low, dividing it by two to generate the midline. This line updates in real-time, ensuring that traders always see the most current premium and discount levels as price action evolves.
3. Dynamic Market Open Levels
Plots session opens (e.g., Asia, London, New York) and the True Day Open to provide actionable reference points for intra-day trading strategies.
Enhances precision in identifying liquidity shifts and aligning trades with institutional price movements.
How It Works:
The indicator uses predefined session times to calculate and display the opening levels for key trading sessions. It dynamically adjusts for time zones, ensuring accuracy regardless of the trader’s location.
4. Custom Watermark for Enhanced Visualization
Includes an optional watermark feature that allows users to display custom text on their charts.
Ideal for personalization, branding, or highlighting session notes without disrupting the clarity of the chart.
Why This Indicator Stands Out
First-to-Market Automation:
While the ICT 50% range line is a widely recognized concept, this is the first script to automate its calculation, combining it with other pivotal trading levels in a single tool.
All-in-One Functionality:
Unlike open-source alternatives that focus on individual features, this script integrates daily highs/lows, mid-range levels, session opens, and customizable watermarks into one cohesive system. The consolidation reduces the need for multiple indicators and ensures a clean, efficient chart setup.
Dynamic Customization:
Every feature can be adjusted to align with a trader’s strategy, time zone, or aesthetic preferences. This level of adaptability is unmatched in existing tools.
Proprietary Logic:
The indicator’s underlying calculations are built from scratch, leveraging advanced programming techniques to ensure accuracy and reliability. These proprietary methods differentiate it from similar open-source scripts.
How to Use This Indicator
Apply the Indicator:
Add it to your TradingView chart from the library.
Configure Settings:
Use the intuitive settings panel to adjust plotted levels, colors, styles, and visibility. Tailor the indicator to your trading strategy.
Incorporate into Analysis:
Combine the plotted levels with your preferred trading approach to identify liquidity zones, establish market bias, and pinpoint potential reversals or entries.
Stay Focused:
With all key levels automated and updated in real time, traders can focus on execution rather than manual plotting.
Originality and Justification for Closed Source
This script is closed-source due to its unique combination of features and proprietary logic that automates complex trading concepts like the ICT 50% range line and session-specific levels. Open-source alternatives lack this level of integration and customization, making this indicator a valuable and original contribution to the TradingView ecosystem.
What Sets It Apart from Open-Source Scripts?
Unlike open-source tools, this indicator doesn’t just replicate individual features—it enhances and integrates them into a seamless, all-in-one solution that offers traders a more efficient and effective way to analyze the market.

OHLC/4 Daily vs Quarterly CrossOHLC/4 Daily vs Quarterly Cross
The "OHLC/4 Daily vs Quarterly Cross" indicator is a powerful tool designed to provide traders with insights into trend alignment and potential market turning points. By calculating the average of the open, high, low, and close prices (OHLC/4), this script compares the daily average price action with the quarterly average to identify significant crossover events.
This indicator features two distinct lines: the Daily OHLC/4 and the Quarterly OHLC/4, each plotted in different colors for easy differentiation. A crossover occurs when the daily OHLC/4 moves above the quarterly average, potentially signaling bullish momentum or a shift in market direction. Conversely, a crossunder marks the daily OHLC/4 moving below the quarterly level, indicating potential bearish sentiment or a reversal.
With real-time plotting and built-in alert conditions, this script enables traders to stay ahead of critical market movements by setting automated notifications for crossover events. Whether you're seeking to confirm trends or identify new opportunities, the "OHLC/4 Daily vs Quarterly Cross" delivers clarity and actionable insights for more informed decision-making.

ICT Digital open Daily DividersDescription for "ICT Digital Open Daily Dividers" TradingView Indicator
Overview
The "ICT Digital Open Daily Dividers" is a versatile and comprehensive TradingView Pine Script indicator designed for traders who utilize Institutional Order Flow methodologies, particularly in ICT (Inner Circle Trader) trading. This indicator provides a structured visual framework to assist traders in identifying key daily market sessions, critical opening prices, and distinguishing different trading days, especially focusing on the Sunday open, which is a crucial element in the ICT trading strategy.
Core Functionalities
Daily Vertical Lines: The script plots vertical lines at the start of each trading day, which helps to demarcate daily trading sessions. These lines are customizable, allowing traders to choose their color, style (solid, dashed, or dotted), and width. This feature helps in visually segmenting each trading day, making it easier to analyze daily price action patterns.
Sunday Open Differentiation: Unlike many other daily divider indicators, this script uniquely provides the option to highlight the Sunday open at 6 PM EST with distinct lines. This feature is especially valuable for ICT traders who consider the Sunday open as a critical reference point for weekly analysis. The color, style, and width of the Sunday open lines can be set separately, providing a clear visual distinction from regular weekday separators.
12 AM Open Toggle: For markets that are influenced by midnight opens, the indicator includes an option to shift the daily open line to 12 AM instead of the default 6 PM. This flexibility allows traders to adapt the indicator to different market dynamics or trading strategies.
Timezone Customization: The indicator allows traders to set the timezone for the open lines, ensuring that the vertical lines align accurately with the trader’s specific market hours, whether they follow New York time or any other timezone.
Session Time Filters: The script can hide or show specific trading session markers, such as the New York session open and close, which are pivotal for ICT traders. These markers help in focusing on the most active and liquid trading times.
Customizable Style Settings: The script includes comprehensive styling options for the plotted lines and session markers, allowing traders to personalize their charts to suit their visual preferences and improve clarity.
Day of the Week Labels: The indicator can plot labels for each day of the week, providing a quick reference to the day’s price action. This feature is particularly useful in reviewing weekly trading patterns and performance.
Use in ICT Trading
In ICT trading, the concept of the "open" is fundamental. The "ICT Digital Open Daily Dividers" indicator serves multiple purposes:
Market Structure Identification: By clearly marking daily opens, traders can easily identify market structure changes such as breakouts, retracements, or consolidations around these key levels.
Reference Points: The Sunday open is often a key level in ICT analysis, serving as a benchmark for assessing market direction for the upcoming week. This indicator’s ability to plot Sunday opens separately makes it uniquely suited for ICT strategies.
Time-based Analysis: ICT methodology often involves analyzing the market at specific times of the day. This indicator supports such analysis by marking significant session opens and closes.
Uniqueness and Advantages
The "ICT Digital Open Daily Dividers" stands out from other similar indicators due to its specialized features:
Sunday Open Highlighting: Few indicators offer the capability to specifically mark the Sunday open with distinct styling options.
Flexibility in Time Adjustments: With options to adjust the open time to either 6 PM or 12 AM, this indicator caters to a broader range of trading strategies and market conditions.
Enhanced Visualization: The wide range of customization options ensures that traders can tailor the indicator to their specific needs, enhancing the usability and visual clarity of their charts.
Compliance with TradingView's Pine Script Community Guidelines
The description adheres to TradingView's guidelines by being comprehensive, clear, and informative. It highlights the utility of the script, its unique features, and its application in trading strategies without making exaggerated claims about performance or profitability. The detailed customization options and unique functionalities are emphasized to differentiate this script from other standard daily divider indicators.

Multi-ticker Daily Pivot AlertDescription:
The Big Tech Daily Pivot Alert is a powerful TradingView indicator designed to monitor daily pivot points for major tech and market-leading tickers. It provides real-time alerts when prices approach their daily pivot levels, helping traders identify potential trading opportunities during the U.S. market hours.
Key Features:
Multi-Ticker Monitoring: Tracks the daily pivot points for top tech and market tickers, including NVDA, TSLA, AMZN, NFLX, SPY, QQQ, GOOGL, MSFT, META, and AAPL.
Daily Pivot Calculations: Uses yesterday's high, low, and close prices to calculate the pivot point for each ticker.
Real-Time Alerts: Sends instant alerts when the open, high, low, or current price is near the pivot point (within 0.25% tolerance).
Time-Sensitive Alerts: Operates exclusively during U.S. market hours (6:00 AM to 1:00 PM PST) on weekdays (Monday to Friday).
Customizable Alert Format: Alerts are sent as JSON payloads for seamless integration with platforms like Discord or other webhook-supported systems.
How It Works:
The indicator calculates the daily pivot point for each ticker using the formula:
Pivot Point = (High + Low + Close) / 3
It continuously monitors the open, high, low, and current prices of each ticker on a 1-minute timeframe.
If any value approaches the pivot point within a configurable threshold (default: 0.25%), it triggers an alert with detailed information for all tickers meeting the criteria.
Who Should Use It:
Day Traders: Spot potential price reversal or breakout levels based on pivot point testing.
Swing Traders: Identify key levels of support and resistance to inform trading decisions.
Tech and Market Enthusiasts: Stay updated on critical price levels for major tech and market tickers.
Instructions:
Add the indicator to your chart.
Configure your webhook endpoint to receive alerts (e.g., Discord or Slack).
Monitor alerts for actionable opportunities when prices test pivot points.

Multi-Timeframe Liquidity LevelsMulti-Timeframe Liquidity Levels – Overview
The Multi-Timeframe Liquidity Levels indicator automatically displays significant highs and lows from various timeframes (Daily, Weekly, Monthly, and Quarterly) on your current chart. This allows traders to quickly identify potential support and resistance zones without frequently switching between different timeframe charts. Additionally, the script offers extra lines for special reference points (e.g., the “Midnight” midpoint of the current day and the previous day’s open/close) to highlight potential liquidity zones even more clearly.
1. Core Idea and Benefits
Time-Saving: Instead of manually reviewing charts in different timeframes, the indicator fetches relevant high/low levels automatically and shows them on your active timeframe.
Clear Layout: Traders instantly see where the Daily, Weekly, Monthly, and Quarterly highs and lows lie—areas often associated with institutional orders or liquidity hunts.
Customizable: You can tailor the color scheme, line style (Solid, Dashed, Dotted), and line width, ensuring the displayed levels fit your personal charting style.
2. How It Works
Multi-Timeframe High/Low
For each timeframe (Day, Week, Month, Quarter), the indicator references the previous candle’s high and low (high , low ).
Using request.security(...), these values are plotted on the chart you’re currently viewing.
Flexible Display
You can individually enable or disable the Daily, Weekly, Monthly, and Quarterly lines, depending on which levels are most relevant to your trading.
With Line Style (Solid, Dashed, Dotted) and Line Width, you can easily emphasize certain lines you consider more important.
Additional Lines
“Midnight” Line: A theoretical midpoint between today’s high and low, which can be useful for gauging daily pivot areas.
Previous Day’s Open/Close: Many traders track these reference points to anticipate market reactions. You can show or hide these lines as desired.
Automatic Line Removal & Creation
When a particular timeframe (e.g., “Show Monthly Levels”) is disabled, the script automatically removes the existing monthly lines.
Enabling it again recreates those lines without hassle.
3. Usage and Interpretation
Identifying Support and Resistance
Highs and lows from higher timeframes are often key zones for entries, exits, or major market reactions.
A Daily level may be crucial for short-term traders, whereas Monthly or Quarterly levels can indicate long-term liquidity areas.
Spotting Market Shifts
If price decisively moves above a Higher-Timeframe line, it could signal strong momentum.
Conversely, a failed breakout (where price quickly returns under or above a level) might warn of a potential reversal.
Extra Lines as Filters
The “Midnight” Line helps visualize a rough central price for the current day, aiding in intraday directional bias.
Previous Day’s Open/Close: Common reference points for day traders, where swift approaches and rejections can indicate potential entries or partial take-profit zones.
4. Practical Tips
Use Color-Coding Wisely: Assign distinct colors (e.g., Blue for Daily, Green for Weekly, Orange for Monthly, Purple for Quarterly) so you can easily discern which timeframe you’re looking at.
Toggle On/Off As Needed: Day traders might focus on Daily and Weekly, while long-term traders may pay closer attention to Monthly and Quarterly.
Combine with Price Action: Lines alone don’t constitute a trading strategy. Use them alongside candlestick patterns, volume analysis, or other indicators for a more complete market perspective.
5. Important Notes & Recommendations
Not Financial Advice: This indicator simply reflects historical high/low data across multiple timeframes and does not constitute a buy or sell recommendation.
Trader Responsibility: Observe how the market actually behaves around these lines and adapt your risk management accordingly.

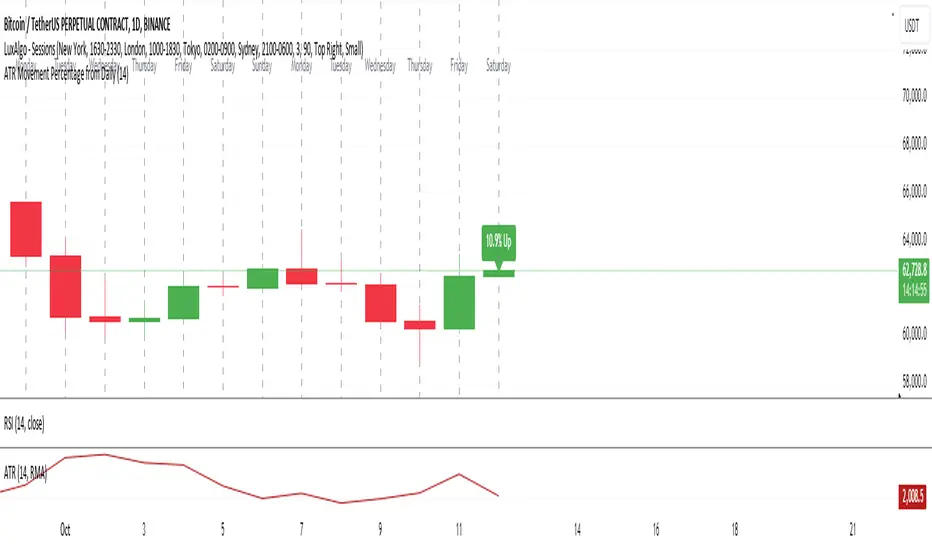
ATR Movement Percentage from Daily (Bal)Script Description: ATR Movement Percentage from Daily
The script titled "ATR Movement Percentage from Daily" is designed to help traders analyze the price movement of an asset in relation to its daily volatility, as represented by the Average True Range (ATR). Here's a breakdown of how the script works:
Key Features of the Script:
ATR Calculation:
The script allows the user to input the length of the ATR calculation (default is 14 periods).
It retrieves the daily ATR value using the request.security function, ensuring that the ATR is based on the daily timeframe, regardless of the current chart's timeframe.
Price Movement Calculation:
It calculates the opening price of the current day using request.security to ensure it is aligned with the daily timeframe.
It retrieves the current closing price and computes the price change from the opening price.
Movement Percentage:
The percentage of price movement relative to the daily ATR is calculated. This value helps traders understand how significant the current price movement is compared to the expected volatility for the day.
Direction of Movement:
The script determines the direction of the price movement (upward or downward) based on whether the price change is positive or negative.
Dynamic Label Display:
A label is created and updated to show the movement percentage and direction on the chart.
If the price movement is upward, the label is displayed in green; if downward, it is shown in red.
The label position updates with each new bar, keeping it relevant to the current price action.
Plotting Daily ATR:
The daily ATR value is plotted on the chart as a blue line, providing a visual reference for traders to see the volatility levels in relation to price movements.
Conclusion:
This script is particularly useful for traders who want to assess market conditions based on volatility. By understanding how much the price has moved in relation to the daily ATR, traders can make informed decisions about entry and exit points, and adjust their risk management strategies accordingly. The dynamic labeling feature enhances the usability of the script, allowing for quick visual assessments of market behavior.
Grandfather-Father-Son RSI Buy Indicator-only for daily TFGrandfather-Father-Son RSI Buy and Sell Indicator
This script identifies buy and sell opportunities by combining RSI values across multiple timeframes to capture market trends and reversals. The "Grandfather-Father-Son" concept breaks down RSI analysis into three key timeframes:
Grandfather (Monthly): Represents the long-term trend, helping to filter trades that align with the overall market direction.
Father (Weekly): Provides intermediate-term momentum, confirming market conditions before signaling entry or exit points.
Son (Daily): Tracks short-term corrections and movements to pinpoint precise buy and sell opportunities.
Key Features:
Buy Signal: A buy signal is triggered when:
Monthly RSI (Grandfather) and Weekly RSI (Father) are both above 70.
Daily RSI (Son) is between 40 and 45, signaling a potential market pullback before resuming the upward trend.
The indicator checks for alignment across these timeframes to generate a reliable buy signal.
Sell Signal: A sell signal occurs when the Daily RSI (Son) crosses above 70, indicating a potential overbought condition.
Multi-Timeframe Analysis: The script pulls data from higher timeframes (monthly and weekly) to ensure that signals reflect larger market trends rather than short-term fluctuations.
Instructions:
Optimal Timeframe: This script works best on the Daily timeframe, as it uses Monthly and Weekly RSI for trend confirmation. The indicator will display a warning if applied to other timeframes to ensure it is used optimally.
Trend Alignment: The strategy ensures that buy signals are triggered only when there is a strong uptrend in both the Grandfather (Monthly) and Father (Weekly) RSI, while sell signals are based on potential overbought conditions in the Son (Daily) RSI.
Limitations:
Timeframe Dependency: Signals are based on higher timeframe data (Weekly and Monthly), which may only update at the close of those respective time periods. Therefore, it is designed to work in real-time but will be most reliable when trading in alignment with these longer-term trends.
Replay Mode: The script has been optimized to function correctly during live market conditions, with no reliance on future data (no lookahead). This ensures signals appear accurately during both backtesting and live trading.
Disclaimer:
This script is for educational purposes and should be used with caution. Always backtest before using in live trading and adjust parameters to fit your trading strategy and risk management plan.

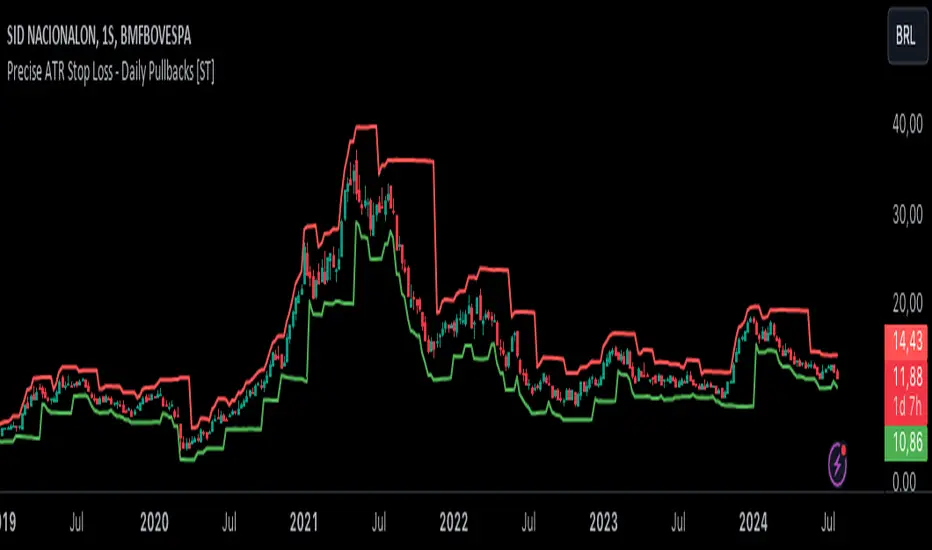
Precise ATR Stop Loss - Daily Pullbacks [ST]Precise ATR Stop Loss - Daily Pullbacks
This indicator uses ATR (Average True Range) combined with the identification of pullback lows and highs on daily charts to calculate more precise stop loss levels.
How it works:
Identification of Pullbacks:
Pullback Lows: Identifies significant low points on daily charts that can serve as support.
Pullback Highs: Identifies significant high points on daily charts that can serve as resistance.
ATR (Average True Range):
Measures market volatility and is used to adjust stop loss levels according to market conditions.
Dynamic Stop Loss:
Stop Loss for Uptrend:
When a pullback low is identified on a daily chart, the stop loss is set slightly below this point, adjusted by the ATR.
This level is shown by a green line on the chart.
Stop Loss for Downtrend:
When a pullback high is identified on a daily chart, the stop loss is set slightly above this point, adjusted by the ATR.
This level is shown by a red line on the chart.
Indicator Benefits:
Improved Precision: Uses significant pullback points on daily charts to set stops more accurately.
Dynamic Stop Loss:
Automatically adjusts stop loss levels according to market volatility, providing more effective risk management.
Título: Precise ATR Stop Loss - Daily Pullbacks
Descrição em Português:
Este indicador utiliza o ATR (Average True Range) combinado com a identificação de fundos e topos de pullback em gráficos diários para calcular níveis de stop loss mais precisos.
Como funciona:
Identificação de Pullbacks:
Fundos de Pullback: Identifica pontos de mínima significativos em gráficos diários que podem servir como suporte.
Topos de Pullback: Identifica pontos de máxima significativos em gráficos diários que podem servir como resistência.
ATR (Average True Range):
Mede a volatilidade do mercado e é utilizado para ajustar os níveis de stop loss de acordo com as condições do mercado.
Stop Loss Dinâmico:
Stop Loss para Tendência de Alta: Quando um fundo de pullback é identificado em um gráfico diário, o stop loss é colocado um pouco abaixo desse ponto, ajustado pelo ATR. Este nível é mostrado por uma linha verde no gráfico.
Stop Loss para Tendência de Baixa: Quando um topo de pullback é identificado em um gráfico diário, o stop loss é colocado um pouco acima desse ponto, ajustado pelo ATR. Este nível é mostrado por uma linha vermelha no gráfico.
Benefícios do Indicador:
Precisão Melhorada: Utiliza pontos de pullback significativos em gráficos diários para posicionar stops de forma mais precisa.
Stop Loss Dinâmico: Ajusta automaticamente os níveis de stop loss de acordo com a volatilidade do mercado, proporcionando uma gestão de risco mais eficaz.